Introduction
The solution scattering techniques are powerful tools for structural and dynamical studies on a large biological complex or system under physiological environments. Especially, neutron solution scattering is quite advantageous for the structural and dynamical studies on a large biological complex or system. One of unique features of neutron as a scattering probe is an isotope effect on the scattering length [1], which is particularly evident on hydrogen. To be more specific, the neutron scattering length of hydrogen (H) (–3.739 fm) is markedly different from that of deuterium (D) (6.671 fm), rendering the different visibility to a molecule by replacing the hydrogen with the deuterium. We shall explain the utilization of the isotope effect for the structural study of a large biological complex or system in detail afterwards.
Let’s consider a large biological complex or system comprised of several macromolecular components. These components are protein, nucleic acid, and carbohydrate with different scattering length densities (SLDs) from one another. Here, scattering intensity from one component is proportional to the square of Δρcomponent [1], where Δρcomponent is called contrast defined as the absolute difference between SLDs of the component (ρcomponent) and of solvent (ρsolvent), Δρcomponent=|ρcomponent–ρsolvent|. By setting the condition of Δρcomponent=0, namely “matching condition”, the scattering from the component almost becomes disappeared, implying that the component becomes “scatteringly invisible”. This is the most notable technique to selectively observe the target component, as a visible component, in the multi-components system and/or the complex with the solution neutron scattering.
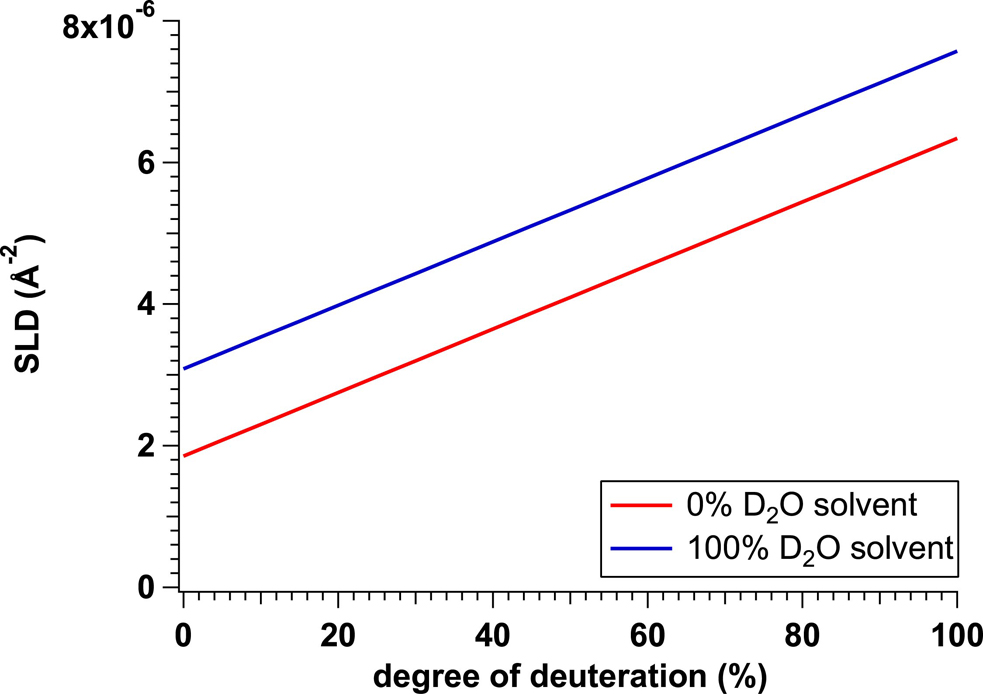
There is one inevitable prerequisite to allow the matching technique: The components in the system should have different SLD values. One of the suitable research targets with this technique is a solution structure of nucleosome, which consists of histones (protein) and DNA. Because the SLD values of histone and DNA are ~2.2×10⁻⁶ Å–2 and ~3.9×10⁻⁶ Å–2, respectively, the matching condition for histone is achieved with 40% (v/v) D2O solvent (ρsolvent=2.2×10⁻⁶ Å–2) and that for DNA is also with 65% (v/v) D2O solvent (ρsolvent=3.9×10⁻⁶ Å–2), as shown in Figure 1. Then, we can selectively observe the DNA structure of nucleosome by making the histones scatteringly invisible in 40% (v/v) D2O solvent, and can selectively observe the histones structure by making the DNA scatteringly invisible in 65% (v/v) D2O solvent as well. This has been extensively applied for the several structural studies of nucleosomes with small-angle neutron scattering (SANS) [2–4].

Here, there arises one issue, “How can we selectively observe the target protein when the all components in the complex or system are proteins?” The answer is “protein deuteration”. As shown in Figure 2, the SLD value of the protein is varied with its deuteration ratio. To selectively observe the target subunit in the complex or the target protein in the multi-component solution, the standard combination for the proteins (subunits) is 100% deuterated (100d-) proteins (subunits) and non-deuterated (hydrogenated (h-)) one(s). By using 40% (v/v) D2O as the solvent, the h-proteins become invisible (refer to Fig. 1) and the 100d-proteins are selectively visible with the high contrast. This method (CM-SANS) using small-angle neutron scattering (SANS) assisted by contrast matching (CM) has solved the structure of the target component in the complex or system [5–7].
However, there is a drawback in CM-SANS method, which is attributed to a large number of hydrogens in 40% (v/v) D2O solvent. The hydrogen atom causes the intensive incoherent scattering, which becomes the background scattering and deteriorates the signal-to-noise (S/N) ratio, especially in the higher scattering vector (Q) range of SANS intensity profile. To overcome the drawback, inverse contrast matching SANS (iCM-SANS) method has been proposed [8]. In the iCM-SANS, partially deuterated (c.a. 75%) and non-deuterated protein components are ‘invisible’ and ‘visible’, in terms of scattering, in 100% D2O solvent, respectively. In the iCM-SANS, it should be noted that partially deuterated (pd-) proteins become invisible (refer to Fig. 1) and the h-proteins are selectively observed under the low incoherent background scattering thanks to 100% D2O as the solvent. Recently, iCM-SANS is utilized for the investigation of partial structures in the complicated complexes [8–10].
As mentioned above, the protein deuteration and related techniques are indispensable for the neutron scattering study with taking the advantage of the neutron characteristics. However, there are obstacles for the normal users to perform the neutron scattering studies with deuterated protein as a conventional technique. In this report, we introduce the full protocol package for CM- and iCM-SANS, and the other neutron solution scattering. This protocol is comprised of following three sections.
In the first section, the procedure for the preparation of deuterated protein of which degree of deuteration is controlled is introduced. In the second section, the efficient procedure for the determination of the degree of deuteration of protein is presented. In the third section, the procedure for recycling of D2O, which serves to the cost reduction of sample preparation, is summarized. It is strongly expected that this protocol will offer more opportunity for structural study of a large biological complex or system with neutron scattering for the structural biologists from various research fields.
Materials and Methods
Chemical Reagents
Hydrogenated and deuterated D-glucose-1,2,3,4,5,6,6-d7 (97% atom D) were purchased from Wako Pure Chemical Industries (Osaka, Japan) and Isotec Inc. (Miamisburg, OH, USA) respectively. D2O (99.8% atom D) was purchased from Taiyo Nippon Sanso Corporation (Tokyo, Japan). LC/MS grade 0.1% aqueous trifluoroacetic acid and acetonitrile were purchased from GL Science Inc. (Tokyo, Japan). Sinapinic acid (Matrix substance for MALDI-MS) and protein standard II were purchased from Bruker Daltonics (Billerica, MA, USA). All other chemical reagents were purchased from Sigma Aldrich (St Louis, MO, USA) or Wako Pure Chemical Industries.
MALDI-TOF Mass Spectrometry (MALDI-TOF MS)
The protein sample solution and a saturated solution of sinapinic acid in TA30 (30% acetonitrile in 70% of 0.1% TFA in water) were mixed with the volume ratio of 1 to 9 and dropped on the ground steel MALDI plate: 1 μl protein for sample solution and 9 μl for saturated sinapinic acid one in the standard case. After drying of MALDI-TOF MS sample and crystallization of droplets, the measurement was conducted with a microflexLT MALDI TOF Mass Spectrometer (Bruker Daltonics) in positive ion mode. External calibrations were performed using protein standards II. Mass spectrum raw data was recorded with flexControl and analyzed with flexAnalysis (Bruker Daltonics).
Small-angle neutron scattering (SANS)
SANS experiments were performed with Quokka [11] installed at the Australian Nuclear Science and Technology Organization (ANSTO, Lucas Heights, NSW, Australia). The wavelength and the sample-to-camera distance were 6.0 Å and 6.0 m, respectively, covering the Q range from 0.012 Å–1 to 0.10 Å–1. The obtained SANS intensity profiles were corrected for background, empty cell, buffer solution scattering, and transmittance. Utilizing the incident beam flux, the SANS intensity profiles were converted to absolute intensities (cm−1).
Fourier transform infrared (FT-IR) spectroscopy
The IR spectra were measured with FT/IR-4600 (Jasco, Tokyo, Japan) equipped with a triglycine sulfate detector, Ge/KBr beam splitter and ATR PRO ONE. The sample solution with the volume of 3.0 μL was placed on the center of diamond prism and immediately measured. Spectra were recorded in the wavenumber covering from 500 to 4000 cm–1 with the resolution of 4 cm–1 at a scan rate of 2 mm/min. To secure high S/N ratio of observed spectrum, the spectrum was finally acquired after averaging of spectra from 32 scans using the Spectra Manager (Jasco).
Evaporator
To collect the D2O from the used 100% D2O containing M9 medium (used 100% D2O M9 medium), used 100% D2O M9 medium was evaporated with the Rotavapor® R-300 (Buchi, Flawil, Switzerland) equipped with the vacuum pump V-300 (Buchi), the heating bath B-305 (Buchi) and the circulating water pump LTB-125 (AS ONE Co., Osaka, Japan). The circulating water of which temperature was set to 4°C, was connected to the reflux tube of the evaporator. Flask filled with 100% D2O M9 medium was immersed in the heating bath at 42°C and rotated at 140 rpm. The internal pressure was initially set at 200 mbar and then reduced to 100 mbar step-wisely. After confirming the absence of sudden boiling, the internal pressure was gradually reduced to 30 mbar.
Software
VolumeCalc1 calculates the numbers of exchangeable and non-exchangeable H atoms with a sequence of one- or three-letter abbreviation of amino acid residues as an input file (ASCI file). For the calculation, VolumeCalc1 obtained the number of non-exchangeable hydrogen atoms in each amino acid residue from the report of Jacrot [12]. In addition, VolumeCalc1 also provides for the expected SLD of a concerned protein corresponding to the degree of deuteration of protein and the volume fraction of D2O in the buffer.
D2O/H2O ratio calculator (d2or) is a Python script using the Numpy library. The peaks at around 1200 cm–1 (Peak 1) and 1450 cm–1 (Peak 2) [13] correspond to the frequency of bending vibration of D-O-D bonding and that of H-O-D bonding, respectively (Fig. 3 (a)). By changing the volume fraction of D2O, we measured IR spectra and calculated the integrated intensity from 1150 cm–1 to 1250 cm–1 (area 1) and that from 1400 cm–1 to 1500 cm–1 (area 2). From the ratio of area 2 to area 1 as a function of volume fraction of D2O, the calibration curve was determined (Fig. 3 (b)). With this calibration curve, the D2O/H2O ratio of a concerned buffer can be computed by supplying the ratio of area 2 to area 1 as an input parameter.
Software is available from following our website (http://www.rri.kyoto-u.ac.jp/NSBNG/activity.html).
Protocols
Preparation of 100% and partially deuterated protein samples
Purpose
As described in the introduction, contrast Δρcomponent is a crucial parameter that determines “scatteringly visibility” (or “scatteringly invisibility”) of solute in the solution. The forward scattering intensity (I0) is related to Δρcomponent through the following equation.
|
I0=
NV2(ρcomponent–
ρsolvent)2=
NV2
Δρcomponent2,
| eq. (1) |
where N and V correspond to the number density and volume of component (solute), respectively. Referring to Figure 1, the SLDs of h- and pd-proteins are scatteringly invisible in 40% (v/v) D2O solvent and 100% D2O solvent, respectively. Taking advantage of their properties, the combination of hydrogenated (h-) and 100%-deuterated (100d-) proteins is utilized for CM-SANS. And the combination of h- and pd-proteins is utilized for iCM-SANS.
In this section, we introduce the procedures for the preparation of recombinant 100d- and pd-proteins with the E. coli expression system.
Preparations for pre-culture and culture of E. coli for 100d- and pd-proteins
Prior to the pre-culture of E. coli for 100d-protein, the following procedures are needed.
0. H2O should be sterilized with autoclaving.
1. Referring to the ingredients summarized in Table 1, 5 times concentrated LB broth (5× LB broth) is prepared. This is utilized for the pre-culture of both 100d- and pd-proteins.
Table 1
Ingredients of 5× LB broth
| 5× LB broth |
1× concentration |
| bacto-tryptone |
50.0 g |
10.0 g/L |
| bacto-yeast extract |
25.0 g |
5.0 g/L |
| NaCl |
50.0 g |
10.0 g/L |
| NaOH |
|
adjust to pH 7.5 |
| D. W |
up to 1 L |
|
| Total |
1 L |
*autoclave |
2. Referring to the ingredients in Table 2, 10 times concentrated M9 medium (10× M9 medium) is prepared. This is used for the culture of pd-protein.
Table 2
Ingredients of 10× M9 medium
| 10× M9 medium |
1× concentration |
| NH4Cl |
10.0 g |
18.7 mM |
| KH2PO4 |
20.0 g |
14.7 mM |
| Na2HPO4 |
63.4 g |
44.7 mM |
| NaCl |
5.0 g |
8.6 mM |
| H2O |
up to 1 L |
|
| Total |
1 L |
*autoclave |
3. Referring to the ingredients in Table 3, the additive solution for M9 medium with the volume of 1 L is prepared. To avoid the contamination of H2O to M9 medium, this solution is applied to freeze-drying. After freeze-drying, it is stored at –20 °C.
Table 3
Ingredients of additive solution for 1 L M9 medium
| Additive solution for 1 L M9 medium |
final concentration |
| 2 M MgSO4 |
1.0 mL |
2.0 mM |
| 1 M CaCl2 |
100.0 μL |
100.0 μM |
| 0.1 M FeCl3 |
216.0 μL |
21.6 μM |
| 50 mg/mL Thiamin |
48.0 μL |
2.4 mg/L |
| 1 mg/mL Biotin |
1.2 mL |
1.2 mg/L |
| Total |
2.6 mL |
*freeze-dry |
4. The solutions of appropriate inducer (ex. isopropyl β-D-thiogalactopyranoside) and antibiotic (ex. Ampicillin) are prepared in H2O. These solutions are sterilized with a filter having the pore size of 0.22 μm. To avoid the contamination of H2O to M9 medium, the filtered solutions are applied to freeze-drying. After freeze-drying, they are stored at –20°C.
5. Flask for the culture, the filtration device, the culture tubes and so on are autoclaved. They are dried at 100°C for at least 4 days to avoid the contamination of H2O.
Culture for 100d-protein
Firstly, the adaptation of E. coli to the D2O environment is indispensable for avoiding long, and variable lag time of growth [14]. The volume fraction of D2O in the culture solution must be step-wisely increased at the stage of pre-culture, hence four steps are needed for the culture for 100d-protein. In the following, we briefly summarize the procedures at each step and further detailed procedures are shown in Figure 4.
Step 1: 1st pre-culture
Referring to the ingredients in Table 4, LB broth containing 30% D2O (30% D2O LB broth) with the volume of 5 mL is prepared. Then, 30% D2O LB broth is inoculated from the glycerol stock solution of E. coli. The bacterial cells are cultured in 30% D2O LB broth for over 12 h at 37°C.
Table 4
Ingredients of 30%, 60% and 80% D
2O LB broth
| 30% D2O LB broth |
| 5× LB broth |
1.0 mL |
| filter-sterilized D2O |
1.5 mL |
| sterile H2O |
2.5 mL |
| antibiotic (in H2O) |
|
| Total |
5.0 mL |
| |
| 60% D2O LB broth |
| 5× LB broth |
1.0 mL |
| filter-sterilized D2O |
3.0 mL |
| sterile H2O |
1.0 mL |
| antibiotic (in H2O) |
|
| Total |
5.0 mL |
| |
| 80% D2O LB broth |
| 5× LB broth |
1.0 mL |
| filter-sterilized D2O |
4.0 mL |
| antibiotic (in H2O) |
|
| Total |
5.0 mL |
Referring to the ingredients in Table 4, LB broth containing 60% D2O (60% D2O LB broth) with the volume of 5 mL is prepared. Then, 50 μL of turbid 30% D2O LB broth is added to 60% D2O LB broth. E. coli is cultured in 60% D2O LB broth for over 12 h at 37°C.
Step 3: 3rd pre-culture
Referring to the ingredients in Table 4, LB broth containing 80% D2O (80% D2O LB broth) with the volume of 10 mL is prepared. Then, 40 μL of turbid 60% D2O LB broth is added to 80% D2O LB broth. E. coli is cultured in 80% D2O LB broth for over 12 h at 37°C.
Step 4: Main culture
Referring to the ingredients in Table 5, 100% D2O M9 medium with the volume of 1 L is prepared for the main culture. After dissolving the additive of M9 medium and the antibiotic in 100% D2O M9 medium, 100% D2O M9 medium is applied to the sterilized-filter. The cells in 80% D2O LB culture broth are collected by centrifugation and the collected cells are suspended against 100% D2O M9 medium. Then, the suspended solution of the cells is cultured in 100% D2O M9 medium at 37°C until the optical density of 600 nm (OD600) reaching 0.6~1.0. Finally, the protein expression is induced at the appropriate condition after adding the inducer.
Table 5
Ingredients of 100% D
2O M9 medium
| Ingredient |
weight/volume |
final concentration |
| NH4Cl |
1.0 g |
18.7 mM |
| KH2PO4 |
2.0 g |
14.7 mM |
| Na2HPO4 |
6.34 g |
44.7 mM |
| NaCl |
0.5 g |
8.6 mM |
| deuterated D-glucose |
2.0 g |
2.0 mg/mL |
| D2O |
1 L |
|
| freeze-dried antibiotic |
appropriate weight |
appropriate concentration |
| freeze-dried additive |
Refer to Table 3 |
|
| Total |
1 L |
*filter sterilize |
Three steps are needed for the culture for pd-protein. In the following, we briefly summarize the procedures at each step and further detailed procedures are presented in Figure 5.
Step 1: 1st pre-culture
Referring to the ingredients in Table 4, 30% D2O LB broth with the volume of 5 mL is prepared. Then, 30% D2O LB broth is inoculated from the glycerol stock solution of E. coli. The bacterial cells are cultured in 30% D2O LB broth for over 12 h at 37°C.
Step 2: 2nd pre-culture
Referring to the ingredients in Table 4, 60% D2O LB broth with the volume of 10 mL is prepared. Then, 100 μL of turbid 30% D2O LB broth is added to 60% D2O LB broth. E. coli is cultured in 60% D2O LB broth for over 12 h at 37°C.
Step 3: Main culture
Referring to the ingredients in Table 6, 75% D2O M9 medium with the volume of 1 L is prepared for the main culture. After dissolving the additive of M9 medium and the antibiotic in 75% D2O M9 medium, 75% D2O M9 medium is applied to the sterilized-filter. The cells in 60% D2O LB culture broth are collected by centrifugation and the collected cells are suspended against 75% D2O M9 medium. Then, the suspended solution of the cells is cultured in 75% D2O M9 medium at 37°C until OD600 reaching 0.6~1.0. Finally, the protein expression is induced at the appropriate condition after adding the inducer.
Table 6
Ingredients of 75% D
2O M9 medium
| Ingredient |
weight/volume |
final concentration |
| 10× M9 medium |
100.0 mL |
|
| deuterated D-glucose |
1.5 g |
1.5 mg/mL |
| hydrogenated D-glucose |
0.5 g |
0.5 mg/mL |
| D2O |
750.0 mL |
|
| H2O |
150.0 mL |
|
| freeze-dried antibiotic |
appropriate weight |
appropriate concentration |
| freeze-dried additive |
Refer to Table 3 |
|
| Total |
1 L |
*filter sterilize |
Following the procedures of culture for 100d-protein, deuterated synechococcus KaiA (SyKaiA) was obtained with an amount of ca. 5 mg after appropriate purification steps. Following the procedures of culture for pd-protein, pd-αB-crystallin (αB-cry) was obtained with an amount of ca. 6 mg after appropriate purification steps.
Efficient determination of the degree of deuteration of protein and D2O/H2O ratio in buffer
Purpose
As given in eq. (1), both ρcomponent and ρsolvent affect the observable I0 value. To realize a successful iCM (or CM) SANS study, both the degree deuteration of protein and the D2O/H2O ratio in the buffer should be determined accurately. In this section, we firstly introduce the procedure that can efficiently determine the degree of deuteration of protein through MALDI-TOF MS. As a next step, we also introduce the procedure that can efficiently determine the D2O/H2O ratio in the buffer through FT-IR spectroscopy.
Efficient determination of the degree of deuteration of protein with MALDI-TOF MS
Because the nonvolatile ingredients in the buffer such as Tris and NaCl sometimes retards the ionization of a sample, the desalting of a sample is normally required prior to MALDI-TOF MS measurement. On the other hand, we have succeeded to obtain a mass spectrum with high S/N even from the non-desalting sample with the following two technical tips. The first one is the adjustment of the molar ratio of a protein sample solution and saturated sinapinic acid one of 1 to 1000 in the MALDI-TOF MS sample. The second one is the preparation of a protein sample solution at the concentration of 5.0~10.0 mg/mL. Considering the above-described experimental requirements, SyKaiA solution at the concentration of 6.0 mg/mL and αB-cry at the concentration of 8.0 mg/mL were utilized for the preparation of MALDI-TOF MS samples.
The buffer containing D2O is normally utilized for neutron scattering, hence it is desirable for determining the degree of deuteration of protein in the buffer used for neutron scattering. On the other hand, it was reported that the exchange rates from H atoms to D atoms of the exchangeable H atoms of amino acid residues in D2O were different, reflecting the variation of the local environment of amino acid residues in the protein [15]. It makes the coexistence of H and D atoms in the exchangeable H atoms of protein, hindering the accurate determination of mass of 100d- (or pd-) protein. As a result, the degree of deuteration of 100d- (or pd-) protein cannot be determined accurately from a single mass spectrum of 100d- (or pd-) protein. To overcome such a problematic situation, we have to consider an alternative procedure.
Since the number of non-exchangeable H atoms in the protein is not affected by the D2O/H2O ratio in the buffer, the number of non-exchangeable D atoms in the deuterated protein is usable for the determination of the degree of deuteration of protein. We then adopt the following procedures.
1. Both deuterated and hydrogenated proteins must be dialyzed against the buffer with the same D2O/H2O ratio for the same length of time.
2. MALDI-TOF MS measurements are performed for both samples.
3. Because the peak shift between 100d- (or pd-) and h-protein in the MS spectra corresponds to the number of non-exchangeable D atoms in the deuterated protein, the peak shift value between two samples (Δm/z) is calculated.
4. The degree of deuteration of protein can be calculated from dividing Δm/z by the total number of non-exchangeable H atoms in the h-protein.
Figure 6 shows the MS spectra of hydrogenated and deuterated SyKaiA and those of hydrogenated and partially deuterated αB-cry. There are several peaks in the mass spectra. We adopted the peaks with the lowest m/z (indicated by solid arrows) for the calculation of the degree of deuteration of protein because they have less effect from the solvents. In the present work, the averaged Δm/z values from three different sample lots were utilized for further analysis. The numbers of total non-exchangeable H atoms in h-protein and Δm/z values of SyKaiA and αB-cry are summarized in Table 7 and the degrees of deuteration of SyKaiA and αB-cry are calculated to 101.0±1.5% and 70.4±1.2%, respectively. It implies that the expected degrees of deuteration are approximately realized by the above-described cultivation procedures. It should be stressed that the degree of deuteration of protein can be determined within one hour from our protocol.

Table 7
Numbers of non-exchangeable H atoms in h-protein,
Δm/
z values and the degrees of deuteration of SyKaiA and αB-cry
|
number of non-exchangeable H
atoms in h-protein |
Δm/z |
degree of deuteration (%) |
| SyKaiA |
1747 |
1764.5±26.2 |
101.0±1.5 |
| αB-cry |
1093 |
773.2±13.0 |
70.4±1.2 |
To check whether this 70.4% deuterated αB-cry is “scatteringly invisible” in 100% D2O solvent or not, SANS measurements were performed with this αB-cry in 0%, 40% and 100% D2O solvent (Fig. 7 (a)). With increasing the volume fraction of D2O, the scattering intensity decreased and 70.4% deuterated αB-cry was almost scatteringly invisible in 100% D2O. With this data, we also plotted (I0/c)0.5, which is comparable to Δρcomponent in eq. (1), as a function of volume fraction of D2O (Fig. 7 (b)). It was revealed that (I0/c)0.5 was equal to 0 at the volume fraction of 98.8±1.5% D2O, supporting its scattering invisibility in 100% D2O buffer.

To assess the tolerance of deviation from the exact degree of deuteration that can be matched in 100% D2O solvent (exact degree of deuteration point), we also calculated the expected I0 value as a function of the degree of deuteration of αB-cry in 100% D2O. As shown by the solid arrow in Figure 8, it was revealed that 73.2% deuterated αB-cry is exactly scatteringly invisible in 100% D2O solvent. Assuming the case that the degree of deuteration of pd-αB-cry was 5% deviated from 73.2%, the expected I0 value of 68.2% (or 78.2%) deuterated αB-cry is computed to 2.5×10⁻³ cm–1. This value approximately corresponds to 1/200 of I0 value of h-αB-cry in 100% D2O solvent, implying the fulfillment of the condition of scattering invisibility. Hence, it is considered that less than 5% deviation from the exact degree of deuteration point is demanded for conducting iCM-SANS study.
Efficient determination of D2O/H2O ratio in the buffer
Prior to neutron scattering, the sample is normally dialyzed against buffer including D2O. During the dialysis process, it is not possible to avoid the contamination of H2O from the ambient air absolutely. It prohibits the preparation of strictly controlled D2O/H2O ratio in the buffer, hence we also have to grasp the real D2O/H2O ratio in the buffer for neutron scattering. Here, we also introduce the efficient method for determining the D2O/H2O ratio in the buffer by FT-IR spectroscopy. As we have already explained in Materials and Methods, the ratio of the peak area at around 1450 cm–1 (Peak 2) to that of 1200 cm–1 (Peak 1) is usable for the determination of D2O/H2O ratio in the buffer.
To inspect whether the salt in the buffer affects the IR spectrum or not, we prepared D2O buffer comprising of 100 mM Tris/HCl (pH 7.4/pD 7.0), 150 mM NaCl and 90% D2O. The IR spectra from this 90% D2O (blue line), 99.96% D2O (green line) and D2O buffer (red line) are shown in Figure 9. The D2O/H2O ratio of the buffer was calculated to 89.7±0.5%, meaning that the D2O/H2O ratio is not affected by the salt in the buffer. Hence, D2O/H2O ratio of the buffer can be correctly determined through our procedure. With this technique, the D2O/H2O ratio in the buffer can be determined within five minutes.
Recycling of D2O
Purpose
Depending upon the measurement type, the sample volume ranging from 280 μL to 6.0 mL is normally necessary for conducting the neutron scattering. It also means that a large amount of expensive deuterated chemical reagents are required for the sample preparation. Then, we also have to consider the method for reducing the cost for sample preparation. Since 100% D2O is not necessary for the preparation of pd-protein, recycling of D2O from D2O containing M9 medium would contribute to the reduction of the cost for the preparation of pd-protein. In this section, we introduce the procedures for recycling of D2O from the used 100% D2O M9 medium with an evaporator.
Procedure for recycling of D2O
To remove the contaminants from the used 100% D2O M9 medium, the used medium is firstly centrifuged at 7,500×g for 15 min over prior to the commencement of evaporation. After the centrifuge, the supernatant is transferred to a flask of an evaporator. For efficient evaporation, the volume of the supernatant should not exceed 60% of the volume of the flask. Following the procedure described in Materials and Methods, the evaporation of used 100% D2O M9 medium was commenced. Distillation of D2O solvent with the volume of 300 mL was completed within 1–2 h. After distillation, a viscous residual material remain at the bottom of the flask (Fig. 10 (a)). Then, the recycled D2O is transferred from the receiver flask to a dry medium bottle. By adding 1–2 dispensing spoons of activated charcoal to the medium bottle, the bottle cap is tightly sealed with Parafilm (Fig. 10 (b)). Just prior to reuse, activated charcoal is removed from the recycled D2O by filtering with the pore size of 0.22 μm. If there is no loss during the evaporation process, about 95% of the initial volume could be recollected. The D2O/H2O ratio of recycled D2O was calculated to be 99.5±0.2% (Fig. 10 (c)), supporting the successful recycling of used D2O from our protocol.

Considering both the D2O/H2O ratio and collected volume of recycled D2O, it is possible to realize approximately 50% cost reduction for the preparation of pd-protein. Compared to the required sample volume for SANS (280~560 μL), the required sample volume for quasielastic neutron scattering (>1 mL) is still a big load for normal users. Hence, the cost reduction of sample preparation of deuterated protein will offer more opportunity for studying the dynamics of the target domain in the complex or target protein in the multi-component system with quasielastic neutron scattering.
Future perspective
Recently, more elaborate protein deuteration techniques such as selective isotopic labeling of specific amino acid residue [16], specific region [17] and specific domain in multi-domain [18] are under progress to realize the observation of functionally relevant structure and dynamics of specific sites in the protein. As a next research target, we also have started to prepare the selectively deuterated domain in the multi-domain protein assisted by segment ligation technique [19]. When the efficient segment ligation technique coupled with deuteration one will be established, this protocol will be reported in near future.


