Abstract
The green fluorescent protein (GFP) derived from Pacific Ocean jellyfish is an essential tool in biology. GFP-solvent interactions can modulate the fluorescent property of GFP. We previously reported that glycine insertion is an effective mutation in the yellow variant of GFP, yellow fluorescent protein (YFP). Glycine insertion into one of the β-strands comprising the barrel structure distorts its structure, allowing water molecules to invade near the chromophore, enhancing hydrostatic pressure or solution hydrophobicity sensitivity. However, the underlying mechanism of how glycine insertion imparts environmental sensitivity to YFP has not been elucidated yet. To unveil the relationship between fluorescence and β-strand distortion, we investigated the effects of glycine insertion on the dependence of the optical properties of GFP variants named enhanced-GFP (eGFP) and its yellow (eYFP) and cyan (eCFP) variants with respect to pH, temperature, pressure, and hydrophobicity. Our results showed that the quantum yield decreased depending on the number of inserted glycines in all variants, and the dependence on pH, temperature, pressure, and hydrophobicity was altered, indicating the invasion of water molecules into the β-barrel. Peak shifts in the emission spectrum were observed in glycine-inserted eGFP, suggesting a change of the electric state in the excited chromophore. A comparative investigation of the spectral shift among variants under different conditions demonstrated that glycine insertion rearranged the hydrogen bond network between His148 and the chromophore. The present results provide important insights for further understanding the fluorescence mechanism in GFPs and suggest that glycine insertion could be a potent approach for investigating the relationship between water molecules and the intra-protein chromophore.
Significance
This study describes the effect of the environment surrounding the chromophore of GFP variants on their spectrum. A small structural distortion by few glycine residue insertions brings water molecule cavities significantly closer to the chromophore, altering the fluorescence dependence on pH, temperature, pressure, and solution hydrophobicity. We investigated these dependencies in various chromophores. While amino acid substitution strongly alters fluorescence through the different amino acid characteristics, glycine insertion can slightly alter the arrangement of amino acids in a β-strand. The present data provide important information regarding the protein structure and the formation of a hydrogen bond network with the chromophore.
Introduction
The fluorescence of the Aequorea victoria green fluorescent protein (GFP), which is composed of 238 amino acid residues, has been improved and stabilized through protein engineering, and its color variants have been engineered [1–5]. Owing to the property aiding in the visualization and quantification of a variety of physiological events from single cells to whole tissues, GFP and its variants have become popular and essential tools in biological research as genetically encoded fluorescent probes [5–7]. The double substitution of Leu64 to phenylalanine (F64L) and Ser65 to threonine (S65T) was the breakthrough for the use of GFP in life science [8]. The original GFP exists in two alternative states with respect to its chromophore conformation, corresponding to two absorbance spectral peaks, exhibiting weak blue fluorescence at 390–400 nm in a protonated state and strong green fluorescence at 470–480 nm in a deprotonated state [9,10]. The S65T substitution rendered the deprotonated state dominant, providing remarkably strong fluorescence, called enhanced GFP (eGFP) [8]. While the fluorescence of GFP is stable at pH 6–10 [9,11], this substitution has enhanced not only the fluorescence but also the pH sensitivity [11–13]. The relationship between chromophore formation and pH sensitivity has been investigated to reveal the mechanism of fluorescence in GFP and its variants for use as an intracellular pH sensor [11,14–17]. Since then, in parallel with their development as tools, GFP and its variants have been widely used as experimental models to study how proteins function, which is to emit fluorescence in the case of GFP [18,19].
GFP and its variants commonly share a unique barrel-like structure composed of 11 β-strands, called a β-barrel structure [5,18,19]. In the center of the β-barrel, a chromophore forms a π-conjugated system composed of a phenolate ring and an imidazolinone ring, as a result of cyclization of a tri-peptide sequence of residues 65, 66, and 67 [5,18–20]. The three consecutive β-strands 7, 10, and 11 prevent the chromophore from interacting with the solvent [18–23]. However, water molecules in the solution can reach the chromophore via a proton wire transferred from glutamine at the 222nd position (Glu222) located near the chromophore to glutamine at the 5th position (Glu5) that is near the bottom of the β-barrel [24–26]. Therefore, the fluorescence of GFP and its variants are sensitive to the characteristics of water such as pH, temperature [26–28], and pressure [28–32]. However, the relationship between water molecules and the optical properties of GFPs remains to be elucidated.
The invasion of water into the β-barrel structure by steric disruption is expected to change the fluorescent characteristics by promoting the interaction of water molecules and the chromophore. We successfully placed a few water molecules near the chromophore via distortion in the β-barrel structure by inserting three glycine residues between asparagine at the 144th (Asn144) position and tyrosine at the 145th (Tyr145) position on β-strand 7 in eYFP (Fig. 1A) [33]. The phenol group of Tyr145 filling a cavity for water invasion was flipped toward the outer side of the barrel, and the invasion of the water molecules was confirmed using X-ray crystallography [33]. As a result, the emission intensity of eYFP inserted with one glycine residue was reduced by 25% and that inserted with three glycine residues was reduced by 80%. Hence, the fluorescence depended on the number of inserted glycine residues; eYFP inserted with three glycine residues demonstrated enhanced pressure dependence [33] and eYFP inserted with one glycine residue could sense the hydrophobicity in solution, providing a protein-crowding sensor, while showing less pressure dependence than the former [34,35]. Thus, glycine insertion alters the relationship between water molecules and the intra-protein chromophore by partially distorting the β-barrel structure.
The mechanisms underlying the perturbation of solvent interaction with the chromophore by glycine insertion have never been easily elucidated. In eYFP, the substitution of threonine at the 203rd position, located close to the chromophore, with tyrosine (T203Y) results in the formation of π-π stacking between the phenol ring of the tyrosine and that of the chromophore, and the delocalization of π-electrons due to π-π stacking realizes the red-shift of fluorescence from the GFP chromophore [20]. Therefore, the fluorescence characteristics of eYFP depend on the distance between the chromophore and the phenol group [32,36]. Glycine insertion caused a spectral blue-shift in both absorbance and emission via separation of the phenol ring of Thr203 and the chromophore [33]. In order to reveal the effects of glycine insertion, spectroscopic analysis of glycine-inserted variants must be performed not only for eYFP but also for its parent protein, eGFP, and cyan variant, eCFP. This is because eGFP has the same tyrosine-based chromophore as eYFP but without the π-π stacking system, and eCFP has a tryptophan-based chromophore that is not protonated unlike eGFP or eYFP developed by substituting tyrosine 65th to tryptophan [21].

In this study, we characterized the optical properties of glycine-inserted fluorescent proteins (eGFP, eYFP, and eCFP) under various experimental conditions such as pH, temperature, pressure, and dehydration. According to the present spectroscopic data and previous X-ray crystallography data [33], it is hypothesized that glycine insertion perturbs the hydrogen bond (H-bond) environment around the chromophore by relocating histidine at the 148th (His148) position, which is one of the important residues for H-bonds with the chromophore. The present results provide insights for further understanding the fluorescence mechanism of GFP and its variants.
Materials and Methods
Gene construction and purification of fluorescent proteins
The expression vectors pEGFP-C1 and pECFP-C1 for eGFP and eCFP, respectively, were purchased from Takara-Clontech (TaKaRa, Japan). eYFP was constructed by substituting five residues in eGFP according to a previous report: Lue64 to Phe, Ser65 to Gly, Val68 to Leu, Ser72 to Ala, and Thr203 to Tyr [20]. The cDNAs of fluorescent protein inserted with a single glycine (G) or three glycines (GGG) were obtained as PCR products using primers including G and GGG, respectively [33,34]. Thus, we prepared nine fluorescent proteins: eCFP, eGFP, and eYFP and their mutants inserted with glycine (eCFP-1G, eGFP-1G, eYFP-1G, eCFP-3G, eGFP-3G, and eYFP-3G). The amino acid sequences of eCFP, eGFP, and eYFP used in this study are shown in Supplementary Information, Supplementary Figure S1.
In the present study, we used the Profinity eXactTM fusion-Tag system (BIO-RAD, USA) to purify tag-free proteins containing the native N-terminal amino acid sequence. The cDNA of each variant was amplified by PCR using sense primers containing a NdeI site and reverse primers containing a HindIII site. The PCR products were ligated into the E. coli expression vector pAL7 between the NdeI and HindIII sites for the construction of a fusion-tag system (BIO-RAD, USA). The expression vector carrying the amplicon of each variant was transformed into the E. coli variant DH5α for plasmid amplification or Rosseta2 (DE3) (Merck Millipore, DEU) for protein expression. Protein purification was performed according to the protocol provided by the manufacturer as described previously using a Profinity eXact cartridge and buffers provided in the kit (BIO-RAD) [33]. Approximately 4.0–8.0 mg of protein was obtained. After purification, we concentrated each variant up to 10 mg/mL by changing the buffer to 1 mM HEPES (pH 8.0) and using Amicon Ultra Centrifugal Filters (Merck Millipore, DEU).
Spectroscopic measurements performed under different pH, temperature, and dehydration conditions
For analyses of pH and temperature dependence, the variant proteins were diluted to obtain concentrations of 0.1–0.3 mg/mL in 20 mM HEPES-NaOH (pH 8.0 to pH 7.0) or 20 mM MES (pH 6.5 or pH 6.0). For the analysis of dehydration dependence, we prepared an ethanol solution (v/v) adjusted to pH 7.4. The fluorescent proteins were diluted to 0.1 mg/mL in each solution.
The absorbance spectrum (250–600 nm) was measured with a UV–Vis spectrophotometer (UV-1650PC, Shimadzu, Japan). The step size of the spectral measurement was 1 nm for pH dependence in CFP and GFP, 0.1 nm for pH dependence in YFP, 0.5 nm for ethanol concentration dependence in all fluorescent protein variants, 1 nm for temperature dependence in all fluorescent protein variants, and 0.2 nm for pressure dependence in all fluorescent protein variants. The fluorescence emission spectra were analyzed using a fluorescence spectrophotometer (RF5300-PC, Shimadzu, JPN; FP-6200, JASCO, Japan). The excitation wavelength was set to 488 nm for eGFPs and eFYPs and 440 nm for eCFPs. The step size of the spectral measurement was 0.5 nm. The emission spectra were scanned from 450 to 600 nm for eCFPs and from 500 to 650 nm for eGFPs and eYFPs. To measure temperature dependence, the experimental temperature was controlled using a temperature-controlled cuvette holder.
High-pressure spectroscopy measurement
A high-pressure optical chamber was constructed for absorption and fluorescence spectroscopy measurements, as previously reported [37]. The pressure chamber, consisting of an inner cuvette (optical path length: 4 mm, inner volume: ~0.25 mL) and the main body, was set inside a fluorescence spectrophotometer (RF-5300PC, Shimadzu, Japan). The pressure was applied using a hand pump (HP-150, Syn Corporation, Japan) connected to the chamber. To avoid an increase in the temperature, the hydrostatic pressure was increased slowly (approximately 5 MPa/s) to the desired pressure. The emission spectra were measured one minute after reaching the target pressure. The emission spectra were scanned from 450 to 600 nm for eCFPs and from 500 to 650 nm for eGFPs and eYFPs. The protein concentration ranged from 3.3 to 10 μg/mL in 20 mM HEPES-NaOH (pH 8.0). All experiments were performed at room temperature (25±1°C). The protein concentration was corrected based on the density of distilled water at each pressure point [38].
Results
Absorbance and fluorescence spectra of glycine-inserted eYFP, eGFP, and eCFP
First, we measured the absorbance and emission spectra of eYFP, eGFP, eCFP, and their glycine-inserted mutants. The glycine insertion between Asn144 and Tyr145 in eYFP caused a spectral blue-shift in both eYFP-1G and eYFP-3G (Fig. 1B and E, orange and red), where separation in the π–π stacking distance can be considered as the explanation [33]. However, glycine insertion in eGFP resulted in a similar blue-shift in the absorbance spectrum as in eYFP, despite the absence of π-π stacking (Fig. 1C, left, and E, light green and green). Interestingly, the insertion of three glycine residues extended the Stokes shift; the emission spectrum did not differ much between eGFP and eGFP-1G but exhibited a red-shift in eGFP-3G (Fig. 1C, right, and E, light green and green). In eCFP, a small red-shift was observed in the emission spectra after glycine insertion (0.60 nm for eCFP-1G and 0.67 nm for eCFP-3G, Fig. 1D, right, and E, cyan and blue). Because the repeat accuracies of the estimation of emission spectral shift defined by the standard deviation of four individual measurements were 0.14 nm, the difference was significant following the three-sigma rule assuming a normal distribution (p-value in student t-test=0.048). Although tiny peak shifts were observed in the absorbance spectrum of eCFP around 440 nm (0.37 nm for eCFP-1G and 0.48 nm for eCFP-3G), we could not draw any conclusions as the repeat accuracies of the absorbance spectral shift were 0.2 nm (p-value=0.18) (Fig. 1D, left). As summarized, the emission spectral shift correlated to the absorbance spectral shift except of eGFPs where the shift direction was opposite between absorbance and emission, and the spectral shift of eYFP-3G was extremely large compared to those of other proteins and variants (Fig. 1E). This result that glycine insertion caused a spectral blue-shift in eGFP which does not have π–π stacking indicates that the spectral blue-shift in the absorbance of eYFP was derived not only from the separation of the π-π stacking but also by a different mechanism.
In order to roughly evaluate the effect on the quantum yield, we compared the ratio of the sum emission intensity and the absorbance intensity at the excitation wavelength. In the case of eYFP, insertion with one glycine residue caused a decrease in the intensity of both absorbance and emission (Fig. 1B, broken lines). The quantum yield was estimated to decrease to 82% with the insertion of one glycine and 30% with the insertion of three glycines. In addition, the quantum yield of eGFP was decreased to 66% after insertion of one glycine and further degraded to 46% by the insertion of two more glycine residues (Fig. 1C, broken lines). This result could be explained by the quench observed as a result of the direct interaction of the chromophore and water molecules invading the β-barrel structure with the insertion of three glycines. The decrease in the quantum efficiency of eCFP owing to glycine insertion remained at 73% even after the insertion of three glycine residues (Fig. 1D, broken lines). Thus, the quantum yield decreased with the number of inserted glycine residues in all cases and that of eYFP-3G was remarkable. Furthermore, the decrease in quantum yield correlated with the degree of spectral shift in eYFP and eGFP but not in eCFP (Fig. 1F). Considering the spectral shift results, the glycine insertion demonstrated more significant effects on the spectra with respect to the tyrosine-based chromophore than the tryptophan-based chromophore. The π-π stacking caused a further spectral blue-shift in the tyrosine-based chromophore after glycine insertion. Thus, the effect of glycine insertion differed depending on the type of chromophore.
Acidity dependence of absorbance- and fluorescence-spectra of glycine-inserted eGFP variants
To reveal the effects of glycine insertion on proton accessibility to the chromophore, we investigated the pH dependence of the glycine-inserted variants. Similar to previous reports [12,13], the acidic condition promoted the protonation of the chromophore in eYFP (Fig. 2A, left) and eGFP (Fig. 2B, left); the absorbance intensity near 400 nm increased and the absorbance near 500 nm decreased under an acidic condition, pH 6. The chromophore of eCFP did not demonstrate this antiparallel reaction, most likely due to the substitution of protonatable tyrosine to tryptophan at the 65th residue; the solution pH did not affect the absorbance spectrum of eCFP. Nevertheless, the emission intensity decreased depending on the acidity (Fig. 2C, left). Hence, pH primarily affected the quantum yield of eCFP. On closer inspection of the absorbance spectrum, the shoulder peak decreased slightly at 450 nm depending on the solution acidity (Fig. 2C, left, inset).

Glycine insertion enhanced the pH dependence in eGFP and eYFP by accelerating the transfer from the deprotonated state to the protonated state (Fig. 2AB, middle and right). Upon comparing the ratio of the sum emission intensity and the absorbance intensity at the excitation wavelength, the tendency of decrease in the ratio mediated by glycine insertion remained almost unchanged with respect to the solution acidity (Fig. 2D). The spectral peaks in both the absorbance and emission of eYFP and eGFP did not shift with pH changes (Fig. 2EF, left and middle, gray). Glycine insertion led to pH dependence; an absorbance spectral shift of 1.0 nm for eYFP-1G, 10 nm for eYFP-3G, 17 nm for eGFP-1G, and 20 nm for eGFP-3G were observed from pH 8 to pH 6 (Fig. 2E, left and middle). The emission peaks were also shifted following absorbance (1.6 nm, eYFP-1G; 3.7 nm, eYFP-3G; 1.4 nm, eGFP-1G; 3.1 nm, eGFP-3G; Fig. 2F, left and middle). In eCFP, shifts in the absorbance spectral peaks were observed; glycine insertion into eCFP reversed the pH dependence of the absorbance spectra peak (Fig. 2E, right). All these changes were observed within 0.7 nm. The repeat accuracy of the estimation of the absorbance spectral shift was degraded to 0.40 nm owing to the difficulty in pH adjustment. Therefore, a shift of less than 1.2 nm was statistically insignificant following the three-sigma rule. Meanwhile, the spectral peak observed in the emission of eCFP was significantly shifted by 2.2 nm from pH 8 to pH 6 (Fig. 2F, right, gray) with the repeat accuracy of 0.26 nm (p-value=0.002). As with the absorbance spectrum, glycine insertion dwindled this dependency (Fig. 2F, right, cyan and blue). Hence, the absorbance and emission spectral peaks of eCFP shifted toward red depending on the pH, and the degree of the shift was reduced with glycine insertion.
Overall, the effect of glycine insertion on pH dependence demonstrated the same tendency for eGFPs and eYFPs; however, the effect was more pronounced in eGFPs. Based on the results, we interpreted that glycine insertion facilitated proton accessibility in the β-barrel structure. The blue-shifts in the absorbance and emission spectra under acidic conditions were observed in glycine-inserted eGFPs and eYFPs (Fig. 2EF, left and middle), which may have been caused by the electronic state change in the protonation state of the tyrosine-based chromophore. However, the peak shifts in the tryptophan-based chromophore present in eCFPs (Fig. 2EF, right) were too small and complicated for easy interpretation.
Temperature dependence of the fluorescence spectrum of glycine-inserted eGFP variants
We next measured the emission spectra of the glycine-inserted variants at solution temperatures ranging from 5 to 45°C. eYFP exhibited a temperature-dependent decrease in emission intensity (Fig. 3A), which is typical for fluorescent proteins or dyes as the quantum yield typically decreases with an increase in the temperature. The temperature dependence of the emission intensity of eYFP was enhanced by 1.7-fold upon insertion of one glycine residue and 2.2-fold upon insertion of three glycine residues (Fig. 3A, and 3BC, left). The emission spectral peak of eYFP-3G slightly shifted to red with increasing temperature, i.e., 1 nm per 40°C. The emission spectral peaks of eYFP and eYFP-1G were slightly but significantly shifted toward blue (Fig. 3D, left). eGFP and eCFP also demonstrated a temperature-dependent decrease in emission, with eCFP showing the most remarkable change (Fig. 3BC, middle and right). In the case of eGFP, insertion of one glycine residue enhanced the emission intensity by 2.0-fold but inserting two more glycine residues demonstrated no further enhancement (Fig. 3BC, middle). The temperature dependence of eCFP was comparable to that of eYFP-3G even without glycine insertion and was enhanced by approximately 1.3-fold upon insertion of one glycine residue and 1.5-fold with three glycine residues (Fig. 3BC, right). The emission spectral peak of eGFP shifted toward red with an increase in the temperature, i.e., 2.5 nm per 40°C (Fig. 3DE, middle), similar to that reported previously [26–28]. eCFP demonstrated spectral peak shifts to the same extent as eGFP (Fig. 3D, left). The spectral shifts of eGFP and eCFP were not perturbed by glycine insertion (Fig. 3DE, middle and right). Based on these results, we speculated that temperature affects two elements as demonstrated by the blue-shift and red-shift in the absorbance and emission spectrum, respectively. They are antagonistic in eYFP and eYFP-1G, and eYFP-3G was dominated by the blue-shift population compared to the red-shift population. Subsequently, only the red-shift population contributed to eGFP and eCFP.

We previously reported the hydrostatic pressure dependence of glycine-inserted YFP variants [33]. In this study, we compared other color variants. Among eYFP, eGFP, and eCFP, eCFP was the most sensitive to pressures ranging from 0.1 to 50 MPa (Fig. 4A, and BD, gray). The fluorescence of eGFP and eCFP with no glycine insertion simply increased with pressure loading (Fig. 4BD, right and middle, gray) and that of eYFP was almost constant (Fig. 4B, left, gray). These results are consistent with those reported previously in a different study [30]. The glycine insertion rendered the eYFP sensitive to pressure based on the number of inserted glycine residues (Fig. 4B, left). eCFP was sensitive to pressure even without glycine insertion; its sensitivity was enhanced depending on the number of inserted glycine residues (Fig. 4BC, right). The effect of the glycine insertion on eGFP was different from that of eYFP or eCFP; while insertion of one glycine residue enhanced the pressure dependence of the emission intensity, insertion of three glycine residues reduced it (Fig. 4BC, middle).

The emission spectral peak of eYFP shifted toward red i.e., 0.5 nm from 0.1 to 50 MPa (Fig. 4DE, left). This can be explained by the compaction of the π-π stacking, as previously reported by other groups [32,36]. On the other hand, a blue-shift in the emission spectrum (approximately 0.7 nm by 0.1 to 50 MPa) was observed in eGFP which does not have π-π stacking (Fig. 4DE, middle), as previously reported [28]. Different mechanisms other than compaction of π-π stacking may be attributed for the spectral red-shift mediated by pressure loading. The spectral shift of eYFP and eGFP mediated by pressure loading was not affected by the insertion of one glycine residue but was altered by the insertion of three glycine residues (Fig. 4DE, left and middle). The spectral shift of the glycine-inserted eCFPs demonstrated no change compared to that of eCFP (Fig. 4DE, right).
Hydrophobicity dependence of the fluorescence spectrum of glycine-inserted eGFP variants
In a previous study, we showed that the insertion of one glycine residue enhanced the dependence on solution hydrophobicity, which resulted in increased sensitivity to the surrounding protein concentration [34]. In this study, we investigated the effect of dehydration mediated by ethanol on the fluorescence of the glycine-inserted GFP variants. Changes in the fluorescent intensity and emission spectrum peak of eYFP were negligible in response to 30% ethanol (v/v) (Fig. 5A, left and Fig. 5BC, left, gray). Insertion of one glycine residue led to the dependence of the emission intensity on ethanol concentration, and the insertion of three glycines changed ethanol dependence in the biphasic reaction for eYFP (Fig. 5A, and Fig. 5BC, orange and red). The same tendency was observed with eGFP, although the degree of change was smaller than that of eYFP (Fig. 5BC, middle). In eCFP, the intensity decreased by only 10% with 30% ethanol, and glycine insertion enhanced the dependency contingent on the number of inserted glycine residues (Fig. 5BC, right). In summary, the effect of ethanol on the emission intensity depended on whether the chromophore was tryptophan-based or tyrosine-based, where a simple decrease in the emission intensity by ethanol was observed in the tryptophan-based chromophore (CFP) whereas the effect was biphasic in the tyrosine-based chromophores (GFP, YFP).
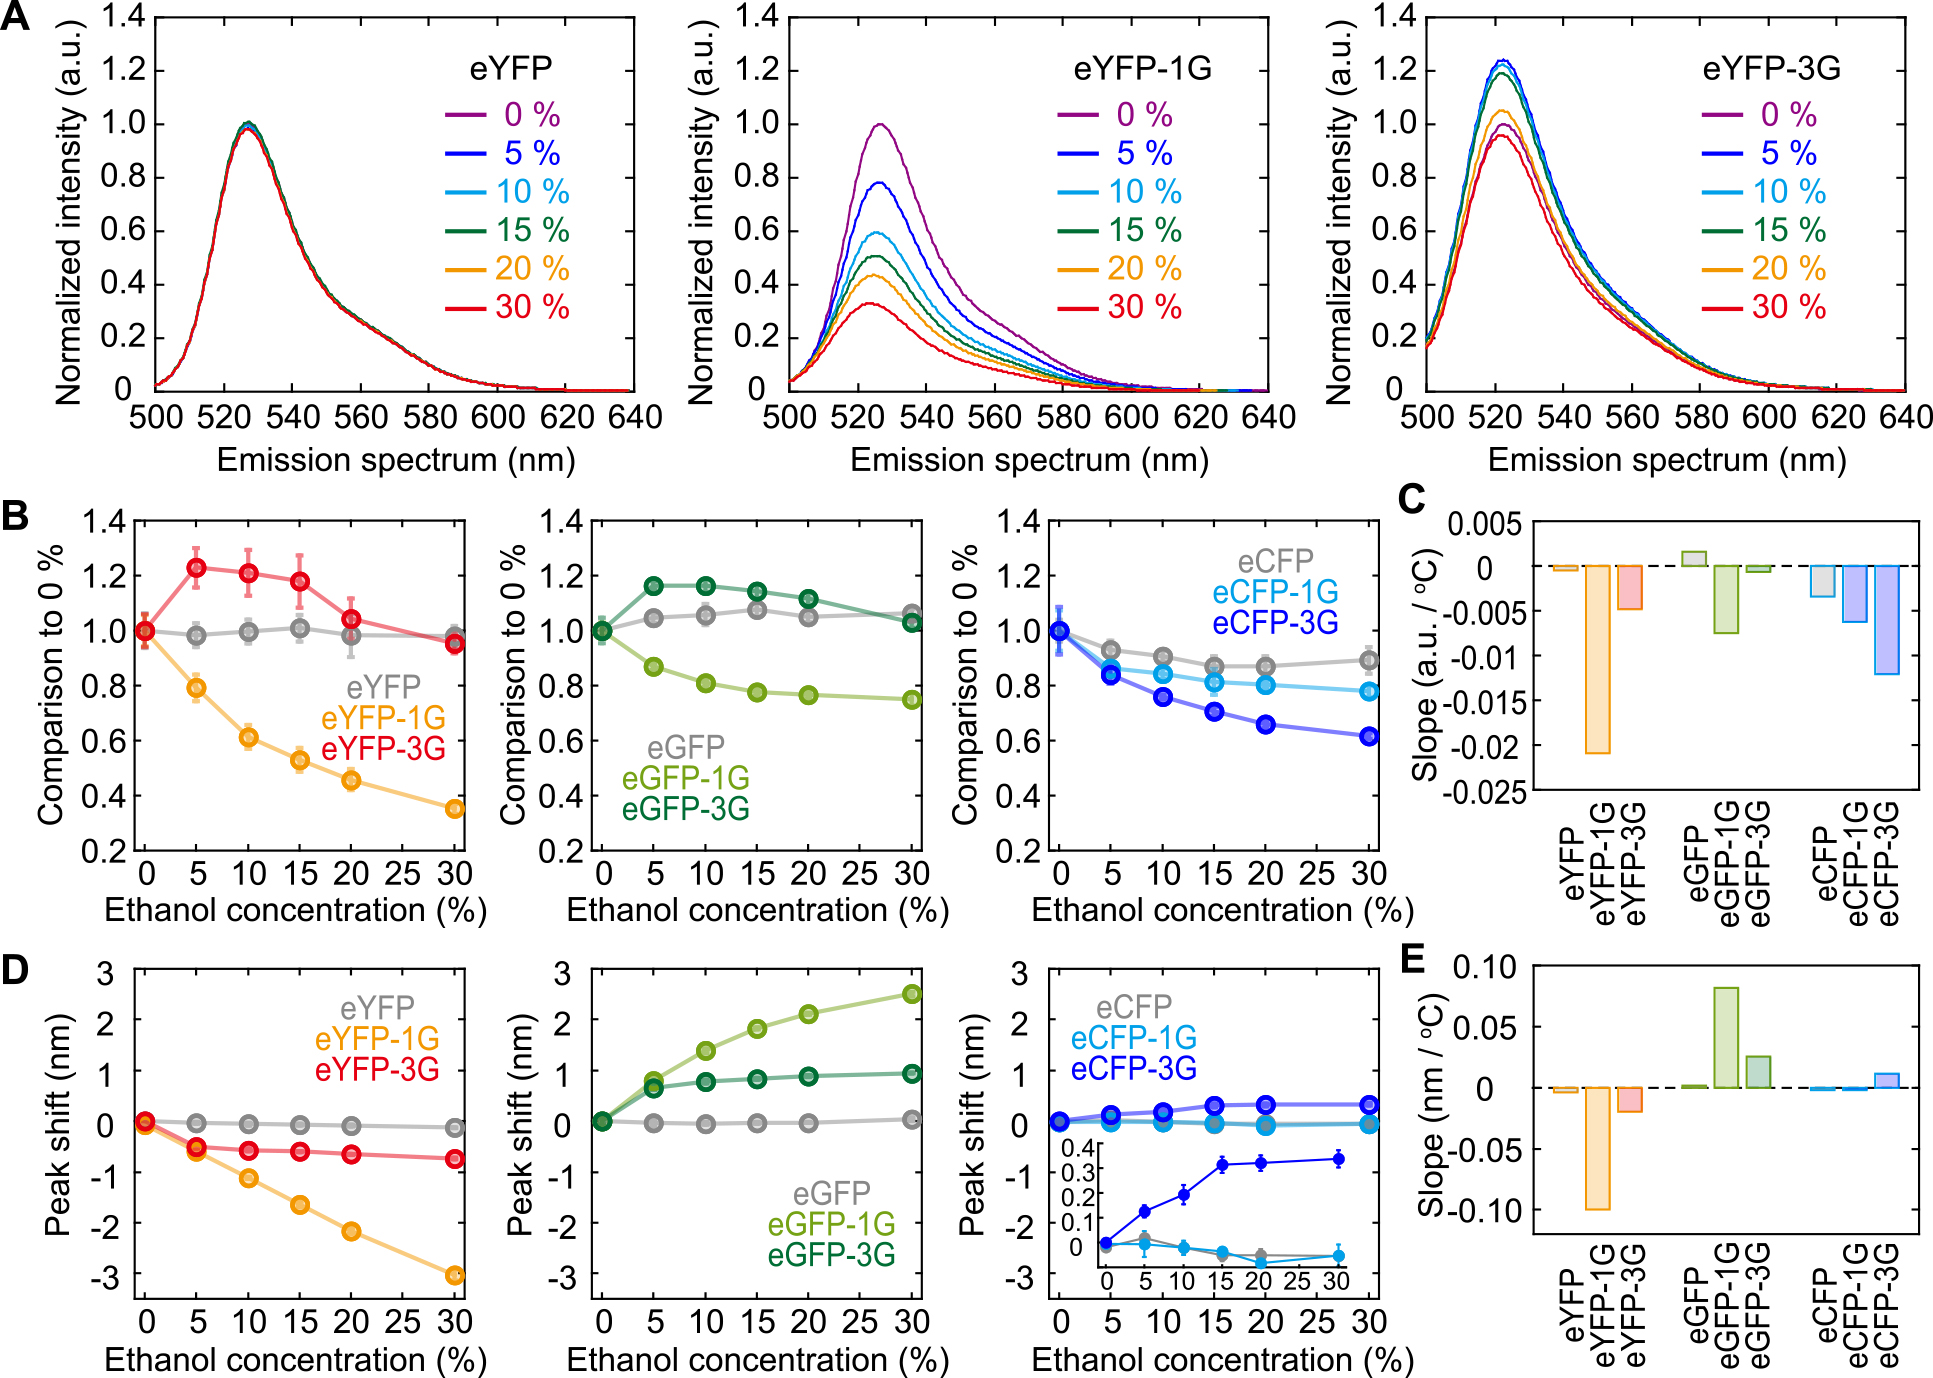
The spectral peak did not demonstrate any shift with 30% ethanol for all variants devoid of glycine insertion (Fig. 5DE, gray). The spectral peak of eYFP-1G linearly shifted toward blue, reaching 3 nm with 30% ethanol (Fig. 5DE, left, orange). However, the insertion of three glycine residues restricted this enhancement to ethanol concentrations of >10% (Fig. 5DE, left, red). Interestingly, the emission spectra of eGFP-1G and eGFP-3G showed the opposite reaction to eYFPs, with a shift toward red (Fig. 5DE, middle). In eCFPs, almost no effect of glycine insertion was observed (Fig. 5DE, middle); however, a slight red-shift (0.3 nm) was detected in eCFP-3G (Fig. 5E, right, inset). In short, glycine insertion altered the dependence of only tyrosine-based chromophores on the ethanol concentration, and the presence of π-π stacking reversed the direction of the spectral shift.
Discussion
In this study, we investigated the spectral characteristics of eYFP, eGFP, and eCFP and their variants with one or three glycine residues inserted before Tyr145, at various pHs, temperatures, pressures, and ethanol concentrations. The ratio of the sum emission intensity and absorbance intensity at the excitation wavelength decreased with the number of inserted glycine molecules (Fig. 1), indicating a decrease in quantum yields. The dependence on pH, temperature, pressure, and ethanol concentration was enhanced without any changes in the trend, except for pH dependence in eCFPs (Figs. 2–5). These results indicate that glycine insertion led to the invasion of water molecules into the β-barrel, enhancing the dependence of the emission intensity on each factor. In contrast, the peak shifts in the absorbance or emission spectrum varied among the proteins and their variants. Thus, the spectral shift is a key parameter for determining the mechanism of the effects of glycine insertion.
The absorbance/emission spectral shift occurs depending on the electronic state around both the tyrosine-based and the tryptophan-based chromophore [39,40]. The glycine insertion caused a blue-shift in the tyrosine-based chromophore, but less in the tryptophan-based chromophore (Fig. 1). X-ray crystallography revealed that glycine insertion alters the side chain of His148 by twisting the β-strand, as previously reported [33]. The theoretical simulation predicted that the blue shift in the absorbance spectrum is caused by canceling the electric charge of the His148 residue [40]. The results demonstrate the possibility that the H-bond network composed of the chromophore and the side chain on the β-strands including H148 is rearranged by glycine insertion, altering the variation of electrostatic fields around the chromophore. It is reasonable that the glycine insertion did not affect eCFP because H148 in eCFP faces toward the bulk and does not interact with the chromophore [41].
The excited-state proton transfer (ESPT), which is observed when wild-type Aequorea victoria GFP is excited by ultraviolet light, causes a large emission red shift [42,43]. With the ESPT, the proton on the phenol is passed to Glu222 through the proton wire, resulting in the deprotonation of the chromophore and emission of fluorescence at 510 nm. The S65T substitution perturbs the arrangement of the chromophore, side chains, and Glu222, thereby disabling the ESPT reaction [44]. The ESPT disabled by S65T or substitution of Glu222 with glutamine (E222Q), can be recovered by substituting His148 with aspartic acid (H148D) [12,45]. Thus, the positive charge on the His148 is critical for determining the characteristics of the spectrum.
Temperature change alters the variation in the dipolar moment, causing charge transfer between the adjacent oxygen atoms and decreasing the emission energy by reorganizing molecules around the electronically excited chromophore, causing a spectral shift [28]. As a result, a shift of charge density occurs so as to shift the emission spectrum toward red in the eGFP chromophore with an increase in temperature [46]. The glycine insertion did not affect temperature dependence in the emission spectral peak in the eGFP (Fig. 3D). Since the glycine insertion affected the pH sensitivity in all cases (Fig. 2), we assumed that the temperature of the solution altered the optical property apart from the pH sensitivity, which refers to the equilibrium between protonation-deprotonation states of the chromophore. To briefly assess this hypothesis, we investigated the temperature dependency of a YFP variant, citrine, with less dependence on pH by substituting methionine at the 69th position to glutamine (Q69M) [47], and found no obvious differences in the intensity decrease or spectral shift between eYFP and citrine as expected (Supplementary Fig. S2AB). This additional result strongly suggests that glycine insertion is not associated with the occurrence of charge density shifts that can be perturbed by increasing temperature. Altogether, it can be roughly concluded that the effect of glycine insertion can be primarily attributed to the rearrangement of the H-bond network including H148. Meanwhile, we do not have a clear explanation for the spectral shift observed with glycine-inserted eGFPs upon a decrease in pH.
In eYFP, glycine insertion alters the distance of the π-π stacking, causing a blue-shift in the spectra [33]. This outcome is thought to be more effective than the rearrangement of the H-bond network. The spectral shift due to the decrease in pH was observed not only in glycine-inserted eGFPs but also in glycine-inserted eYFPs with a similar trend (Fig. 2), indicating that π-π stacking was not the main reason for the pH dependence of the spectral blue-shift. The lower temperature sensitivity of eYFP could be explained by the participation of π-π stacking [28,32,36]. In eYFP-3G, the contribution of π-π stacking can be considered to be lower than that observed in other variants since the effect appears similar to that observed in eGFP. In the experiments measuring the dependence on ethanol, the presence of π-π stacking in eYFP completely inverted the effect of glycine insertion on spectral shift in eGFPs, which do not have π-π stacking (Fig. 5). In short, π-π stacking can be altered by temperature, pressure, or ethanol but not by pH.
In eCFP, although a small red shift and a decrease in quantum yield were observed with pH 8 at room temperature and atmospheric pressure, the overall fluorescence property was not affected significantly by glycine insertion (Fig. 1). Because the tryptophan-based chromophore in eCFP is not deprotonated, the mechanism of pH dependence of eCFP would be different from eYFP or eGFP. The spectral shoulder peak at 450 nm decreased with a decrease in pH, which was enhanced by glycine insertion (Fig. 2). This shoulder peak arises from the co-existence of cis-trans isomers, and their population is responsible for the variation in spectral shape due to pH change [48]. Glycine insertion might lead to a decrease in the free energy barrier for state transfer between cis-trans conformations of eCFP. Recently, it was reported that the tryptophan-based chromophore can be deprotonated under certain conditions or effective substitution [49]. There is also a possibility that the distortion of the β-barrel by glycine-insertion resulted in the protonated state of the eCFP chromophore, changing the spectral shape.
At high pressures, the emission intensities of eYFP, eGFP, and eCFP were all enhanced by glycine insertion (Fig. 4). This might be attributed to the increased formation of H-bonds between the chromophore and adjacent residues, as the chromophore cavity is compacted with pressure increase [28,31]. In the additional experiment, the Q69M substitution in citrine diminished this pressure sensitivity: the pressure dependence of the emission intensity of citrine was almost the same as that of eYFP, and the spectral shift was significantly smaller (Supplementary Fig. S2CD). Therefore, pressure sensitivity is thought to occur through the same mechanism as pH sensitivity and can be enhanced by glycine insertion. Moreover, the compaction of the chromophore cavity induced by a pressure increase might be enhanced by untying a part of the β-barrel via glycine insertion. The chromophore cavity is expected to shrink with the addition of the molecular crowding agent to the solution [50]. The effects of the addition of a small-molecular or macromolecular crowing agent to the eYFPs, sucrose or polyethylene glycol (PEG6000), respectively, differed compared to the pressure dependence. There was also a difference between sucrose and PEG6000 (Supplementary Fig. S3). The insertion of three glycines caused a small peak shift of less than 0.1 nm, but the direction was the opposite; a red-shift with sucrose and blue-shift with PEG6000 (Supplementary Fig. S3, red). This result indicated that the effect of molecular crowding on the eYFP structure may depend on the size of the crowding agent, and that it is not possible to simply relate the effects of molecular crowding to the effects of pressure.
With respect to the dependency on ethanol concentration, the effect of glycine insertion differed among eYFPs, eGFPs, and eCFPs (Fig. 5). Insertion of one glycine residue decreased the emission intensity by increasing the ethanol concentration. However, further insertion of glycine residues resulted in a biphasic reaction to ethanol dependence in eYFP and eGFP (Fig. 5B, left, middle). Insertion of one glycine residue produced the space for water to invade near the chromophore by twisting and shifting β-strand 7, and when glycine was further inserted, the residues of 146–149th were no longer folded [33]. Since dehydration alters not only solvent dynamics but also protein folding, the mutants inserted with three glycines with a flexible region in β-strand 7 might exhibit a more complicated alternation than the mutants inserted with one glycine residue. Meanwhile, the chromophore of fluorescent proteins without glycine insertion are perfectly protected by the barrel structure, and hence, would not be affected by the dehydration conditions of the surrounding environment. However, eCFP-3G simply enhanced the ethanol-dependent decrease in emission intensity (Fig. 5B, right). The H-bond situation around the 65th residue is thought to be altered depending on the number of inserted glycine residues. This can also explain the difference in the spectral red-shift by addition of ethanol observed between GFP-1G and GFP-3G (Fig. 5D, middle) attributed to the charge transfer, similar to temperature dependence. The shift direction of eYFP was opposite to that of eYFPs. The π-π stacking distance is thought to separate so as to exceed the red-shift. However, this explanation cannot exceed the speculation based on spectroscopic information. Crystal structure analysis is indispensable for discerning the accurate and detailed underlying mechanism. Additionally, molecular dynamics simulation and quantum mechanics/molecular mechanics simulation provide the essential help for interpretation or reproduction of structure and spectrum analysis [28,51–56].
Conclusion
The chromophore emits fluorescence as a result of a variety of excitation states derived from the physicochemical equilibrium in the ground state based on its conformation and/or protonation. In addition, various reactions in the chromophore are specifically induced in the excited state, such as enol-imine tautomeric formation, charge transfer, dielectric relaxation, etc., resulting in emission with various energies. The solvent interaction with the chromophore directly relates to the aforementioned properties. According to our present results, we conclude that glycine insertion rearranges the H-bond network including His148. Nevertheless, the present results provide important insights into the fluorescence mechanism of GFP variants by altering the solvent interaction with the chromophore via induction of a mutation. In conclusion, we believe that glycine insertion can be a good approach to investigate the relationship between water molecules and the chromophores to reveal the fluorescent mechanism or to develop variants of these fluorescent proteins with enhanced functions.
Acknowledgments
This work was supported by MEXT Grant-in-Aid for Scientific Research on Innovative Areas “Singularity Biology,” Grant Number JP18H05409 (to T.M.W.), and JSPS KAKENHI Grant Number JP19H02566 (to M.N.). We would like to thank Editage (www.editage.com) for English language editing.
Conflicts of Interest
The authors declare no conflicts of interest.
Author contributions
T.J.M mainly performed the experiments and analyses. M.N. developed the high-pressure spectroscopy measurement system and provided a critical discussion. K.Y. performed the genetic construct, protein purification, and pH dependence measurements. H.F. wrote and edited the manuscript. T.M.W. designed the experiments and wrote the manuscript.
References
- [1] Shimomura, O., Johnson, F. H. & Saiga, Y. Extraction, purification and properties of aequorin, a bioluminescent protein from the luminous hydromedusan. Aequorea. J. Cell. Comp. Physiol. 59, 223–239 (1962). DOI: 10.1002/jcp.1030590302
- [2] Prasher, D. C., Eckenrode, V. K., Ward, W. W., Prendergast, F. G. & Cormier, M. J. Primary structure of the Aequorea victoria green-fluorescent protein. Gene 111, 229–233 (1992). DOI: 10.1016/0378-1119(92)90691-H
- [3] Heim, R., Prasher, D. C. & Tsien, R. Y. Wavelength mutations and posttranslational autoxidation of green fluorescent protein. Proc. Natl. Acad. Sci. USA 91, 12501–12504 (1994). DOI: 10.1073/pnas.91.26.12501
- [4] Cubitt, A. B., Heim, R., Adams, S. R., Boyd, A. E., Gross, L. A. & Tsien, R. Y. Understanding, improving and using green fluorescent proteins. Trends Biochem. Sci. 20, 448–455 (1995). DOI: 10.1016/S0968-0004(00)89099-4
- [5] Tsien, R. Y. The green fluorescent protein. Annu. Rev. Biochem. 67, 509–544 (1998). DOI: 10.1146/annurev.biochem.67.1.509
- [6] Nifosí, R., Amat, P. & Tozzini, V. Variation of spectral, structural, and vibrational properties within the intrinsically fluorescent proteins family: a density functional study. J. Comput. Chem. 28, 2366–2377 (2007). DOI: 10.1002/jcc.20764
- [7] Germond, A., Fujita, H., Ichimura, T. & Watanabe, T. M. Design and development of genetically encoded fluorescent sensors to monitor intracellular chemical and physical parameters. Biophys. Rev. 8, 121–138 (2016). DOI: 10.1007/s12551-016-0195-9
- [8] Heim, R., Cubitt, A. B. & Tsien, R. Y. Improved green fluorescence. Nature 373, 663–664 (1995). DOI: 10.1038/373663b0
- [9] Ward, W. W., Cody, C. W., Hart, R. C. & Cormier, M. J. Spectrophotometric identity of the energy-transfer chromophores in Renilla and Aequorea green fluorescent proteins. Photochem. Photobiol. 31, 611–615 (1980). DOI: 10.1111/j.1751-1097.1980.tb03755.x
- [10] Voityuk, A. A., Michel-Beyerle, M. E. & Rösch, N. Quantum chemical modeling of structure and absorption spectra of the chromophore in green fluorescent proteins. Chem. Phys. 231, 13–25 (1998). DOI: 10.1016/S0301-0104(98)00080-9
- [11] Patterson, G. H., Knobel, S. M., Sharif, W. D., Kain, S. R. & Piston, D. W. Use of the green fluorescent protein and its mutants in quantitative fluorescence microscopy. Biophys. J. 73, 2782–2790 (1997). DOI: 10.1016/S0006-3495(97)78307-3
- [12] Elsliger, M. A., Wachter, R. M., Hanson, G. T., Kallio, K. & Remington, S. J. Structural and spectral response of green fluorescent protein variants to changes in pH. Biochemistry 38, 5296–5301 (1999). DOI: 10.1021/bi9902182
- [13] Kneen, M., Farinas, J., Li, Y. & Verkman, A. S. Green fluorescent protein as a noninvasive intracellular pH indicator. Biophys. J. 74, 1591–1599 (1998). DOI: 10.1016/S0006-3495(98)77870-1
- [14] Hanson, G. T., McAnaney, T. B., Park, E. S., Rendell, M. E., Yarbrough, D. K., Chu, S., et al. Green fluorescent protein variants as ratiometric dual emission pH sensors. 1. Structural characterization and preliminary application. Biochemistry 41, 15477–14588 (2002). DOI: 10.1021/bi026609p
- [15] McAnaney, T. B., Park, E. S., Hanson, G. T., Remington, S. J. & Boxer, S. G. Green fluorescent protein variants as ratiometric dual emission pH sensors. 2. Excited-state dynamics. Biochemistry 41, 15489–15494 (2002). DOI: 10.1021/bi026610o
- [16] McAnaney, T. B., Shi, X., Abbyad, P., Jung, H., Remington, S. J. & Boxer, S. G. Green fluorescent protein variants as ratiometric dual emission pH sensors. 3. Temperature Dependence of Proton Transfer. Biochemistry 44, 8701–8011 (2005). DOI: 10.1021/bi050132a
- [17] McAnaney, T. B., Zeng, W., Doe, C. F., Bhanji, N., Wakelin, S., Pearson, D. S., et al. Protonation, photobleaching, and photoactivation of yellow fluorescent protein (YFP 10C): a unifying mechanism. Biochemistry 44, 5510–5524 (2005). DOI: 10.1021/bi047581f
- [18] Craggs, T. D. Green fluorescent protein: structure, folding and chromophore maturation. Chem. Soc. Rev. 38, 2865–2875 (2009). DOI: 10.1039/b903641p
- [19] Stepanenko, O. V., Stepanenko, O. V., Kuznetsova, I. M., Verkhusha, V. V. & Turoverov, K. K. Beta-barrel scaffold of fluorescent proteins: folding, stability and role in chromophore formation. Int. Rev. Cell Mol. Biol. 302, 221–278 (2013). DOI: 10.1016/B978-0-12-407699-0.00004-2
- [20] Ormö, M., Cubitt, A. B., Kallio, K., Gross, L. A., Tsien, R. Y. & Remington, S. J. Crystal structure of the Aequorea victoria green fluorescent protein. Science 273, 1392–1395 (1996). DOI: 10.1126/science.273.5280.1392
- [21] Heim, R. & Tsien, R. Y. Engineering green fluorescent protein for improved brightness, longer wavelengths and fluorescence resonance energy transfer. Curr. Biol. 6, 178–182 (1996). DOI: 10.1016/S0960-9822(02)00450-5
- [22] Yang, F., Moss, L. G. & Phillips, G. N. Jr. The molecular structure of green fluorescent protein. Nat. Biotechnol. 14, 1246–1251 (1996). DOI: 10.1038/nbt1096-1246
- [23] Phillips, G. N. Jr. Structure and dynamics of green fluorescent protein. Curr. Opin. Struct. Biol. 7, 821–827 (1997). DOI: 10.1016/S0959-440X(97)80153-4
- [24] Agmon, N. Elementary Steps in Excited-State Proton Transfer. J. Phys. Chem. A 109, 13–35 (2005). DOI: 10.1021/jp047465m
- [25] Agmon, N. Kinetics of Switchable Proton Escape from a Proton-Wire within Green Fluorescence Protein. J. Phys. Chem. B 111, 7870–7878 (2007). DOI: 10.1021/jp071403p
- [26] Leiderman, P., Huppert, D. & Agmon, N. Transition in the temperature-dependence of GFP fluorescence: from proton wires to proton exit. Biophys. J. 90, 1009–1018 (2006). DOI: 10.1529/biophysj.105.069393
- [27] Savchuk, O. A., Silvestre, O. F., Adão, R. M. R. & Nieder, J. B. GFP fluorescence peak fraction analysis based nanothermometer for the assessment of exothermal mitochondria activity in live cells. Sci. Rep. 9, 7535 (2019). DOI: 10.1038/s41598-019-44023-7
- [28] Jacchetti, E., Gabellieri, E., Cioni, P., Bizzarri, R. & Nifosì, R. Temperature and pressure effects on GFP mutants: explaining spectral changes by molecular dynamics simulations and TD-DFT calculations. Phys. Chem. Chem. Phys. 18, 12828–12838 (2016). DOI: 10.1039/c6cp01274d
- [29] Scheyhing, C. H., Meersman, F., Ehrmann, M. A., Heremans, K. & Vogel, R. F. Temperature-pressure stability of green fluorescent protein: a Fourier transform infrared spectroscopy study. Biopolymers 65, 244–253 (2002). DOI: 10.1002/bip.10237
- [30] Verkhusha, V. V., Pozhitkov, A. E., Smirnov, S. A., Borst, J. W., van Hoek, A., Klyachko, N. L., et al. Effect of high pressure and reversed micelles on the fluorescent proteins. Biochim. Biophys. Acta 1622, 192–195 (2003). DOI: 10.1016/S0304-4165(03)00140-5
- [31] Mauring, K., Deich, J., Rosell, F. I., McAnaney, T. B., Moerner, W. E. & Boxer, S. G. Enhancement of the fluorescence of the blue fluorescent proteins by high pressure or low temperature. J. Phys. Chem. B 109, 12976–12981 (2005). DOI: 10.1021/jp0448595
- [32] Barstow, B., Ando, N., Kim, C. U. & Gruner, S. M. Alteration of citrine structure by hydrostatic pressure explains the accompanying spectral shift. Proc. Natl. Acad. Sci. USA 105, 13362–13366 (2008). DOI: 10.1073/pnas.0802252105
- [33] Watanabe, T. M., Imada, K., Yoshizawa, K., Nishiyama, M., Kato, C., Abe, F., et al. Glycine insertion makes yellow fluorescent protein sensitive to hydrostatic pressure. PLoS One 8, e73212 (2013). DOI: 10.1371/journal.pone.0073212
- [34] Morikawa, T. J., Fujita, H., Kitamura, A., Horio, T., Yamamoto, J., Kinjo, M., et al. Dependence of fluorescent protein brightness on protein concentration in solution and enhancement of it. Sci. Rep. 6, 22342 (2016). DOI: 10.1038/srep22342
- [35] Machiyama, H., Morikawa, T. J., Okamoto, K., Watanabe, T. M. & Fujita, H. The use of a genetically encoded molecular crowding sensor in various biological phenomena. Biophis. Phisocobiol. 14, 119–125 (2017). DOI: 10.2142/biophysico.14.0_119
- [36] Barstow, B., Ando, N., Kim, C. U. & Gruner, S. M. Coupling of pressure-induced structural shifts to spectral changes in a yellow fluorescent protein. Biophys. J. 97, 1719–1727 (2009). DOI: 10.1016/j.bpj.2009.06.039
- [37] Fujii, S., Masanari-Fujii, M., Kobayashi, S., Kato, C., Nishiyama, M., Harada, Y., et al. Commonly stabilized cytochromes c from deep-sea Shewanella and Pseudomonas. Biosci. Biotechnol. Biochem. 14, 792–799 (2018). DOI: 10.1080/09168451.2018.1448255
- [38] Marshall, W. L. & Franck, E. U. Ion product of water substance, 0–1000°C, 1–10,000 bars. New international formulation and its background. J. Phys. Chem. Ref. Data 10, 295–304 (1981). DOI: 10.1063/1.555643
- [39] Ai, H.-W., Olenych, S. G., Wong, P., Davidson, M. W. & Campbell, R. E. Hue-shifted monomeric variants of Clavularia cyan fluorescent protein: identification of the molecular determinants of color and applications in fluorescence imaging. BMC Biol. 6, 13 (2008). DOI: 10.1186/1741-7007-6-13
- [40] Kaila, V. R. I., Send, R. & Sundholm, S. Electrostatic spectral tuning mechanism of the green fluorescent protein. Phys. Chem. Chem. Phys. 15, 4491–4495 (2013). DOI: 10.1039/c3cp00058c
- [41] Lelimousin, M., Noirclerc-Savoye, M., Lazareno-Saez, C., Paetzold, B., Le Vot, S., Chazal, R., et al. Intrinsic dynamics in ECFP and Cerulean control fluorescence quantum yield. Biochemistry 48, 10038–10046 (2009). DOI: 10.1021/bi901093w
- [42] Chattoraj, M., King, B. A., Bublitz, G. U. & Boxer, S. G. Ultra-fast excited state dynamics in green fluorescent protein: multiple states and proton transfer. Proc. Natl. Acad. Sci. USA 93, 8362–8367 (1996). DOI: 10.1073/pnas.93.16.8362
- [43] Stoner-Ma, D., Jaye, A. A., Matousek, P., Towrie, M., Meech, S. R. & Tonge, P. J. Observation of excited-state proton transfer in green fluorescent protein using ultrafast vibrational spectroscopy. J. Am. Chem. Soc. 127, 2864–2865 (2005). DOI: 10.1021/ja042466d
- [44] Cui, G., Lan, Z. & Thiel, W. Intramolecular hydrogen bonding plays a crucial role in the photophysics and photochemistry of the GFP chromophore. J. Am. Chem. Soc. 134, 1662–1672 (2012). DOI: 10.1021/ja208496s
- [45] Stoner-Ma, D., Jaye, A. A., Ronayne, K. L., Nappa, J., Meech, S. R. & Tonge, P. J. An alternate proton acceptor for excited-state proton transfer in green fluorescent protein: rewiring GFP. J. Am. Chem. Soc. 130, 1227–1235 (2008). DOI: 10.1021/ja0754507
- [46] Dos Santos, A. M. Thermal effect on Aequorea green fluorescent protein anionic and neutral chromophore forms fluorescence. J. Fluoresc. 22, 151–154 (2012). DOI: 10.1007/s10895-011-0941-0
- [47] Griesbeck, O., Baird, G. S., Campbell, R. E., Zacharias, D. A. & Tsien, R. Y. Reducing the Environmental Sensitivity of Yellow Fluorescent Protein. J. Biol. Chem. 276, 29188–29194 (2001). DOI: 10.1074/jbc.m102815200
- [48] Voliani, V., Bizzarri, R., Nifosì, R., Abbruzzetti, S., Grandi, E., Viappiani, C., et al. Cis-trans photoisomerization of fluorescent-protein chromophores. J. Phys. Chem. B 112, 10714–10722 (2008). DOI: 10.1021/jp802419h
- [49] Sarkisyan, K. S., Yampolsky, I. V., Solntsev, K. M., Lukyanov, S. A., Lukyanov. K. A. & Mishin, A. S. Tryptophan-based chromophore in fluorescent proteins can be anionic. Sci. Rep. 2, 608 (2012). DOI: 10.1038/srep00608
- [50] Christiansen, A., Wang, Q., Cheung, M. S. & Wittung-Stafshede, P. Effects of macromolecular crowding agents on protein folding in vitro and in silico. Biophys. Rev. 5, 137–145 (2013). DOI: 10.1007/s12551-013-0108-0
- [51] Lill, M. A. & Helms, V. Proton shuttle in green fluorescent protein studied by dynamic simulations. Proc. Natl. Acad. Sci. USA 99, 2778–2781 (2002). DOI: 10.1073/pnas.052520799
- [52] Nifosì, R. & Tozzini, V. Molecular dynamics simulations of enhanced green fluorescent proteins: effects of F64L, S65T and T203Y mutations on the ground-state proton equilibria. Proteins 51, 378–389 (2003). DOI: 10.1002/prot.10335
- [53] Patnaik, S. S., Trohalaki, S. & Pachter, R. Molecular modeling of green fluorescent protein: structural effects of chromophore deprotonation. Biopolymers 75, 441–452 (2004). DOI: 10.1002/bip.20156
- [54] Filippi, C., Buda, F., Guidoni, L. & Sinicropi, A. Bathochromic Shift in Green Fluorescent Protein: A Puzzle for QM/MM Approaches. J. Chem. Theory Comput. 8, 112–124 (2012). DOI: 10.1021/ct200704k
- [55] Coppola, F., Perrella, F., Petrone, A., Donati, G. & Rega, N. A Not Obvious Correlation Between the Structure of Green Fluorescent Protein Chromophore Pocket and Hydrogen Bond Dynamics: A Choreography From ab initio Molecular Dynamics. Front. Mol. Biosci. 7, 569990 (2020). DOI: 10.3389/fmolb.2020.569990
- [56] Hata, H., Nishiyama, M. & Kitao, A. Molecular dynamics simulation of proteins under high pressure: Structure, function and thermodynamics. Biochim. Biophys. Acta Gen. Subj. 1864, 129395 (2020). DOI: 10.1016/j.bbagen.2019.07.004
