Regular Article
Mathematical model of chromosomal dynamics during DNA double strand break repair in budding yeast

2022 Volume 19 Article ID: e190012

Details
2022 Volume 19 Article ID: e190012
During the repair of double-strand breaks (DSBs) in DNA, active mobilizations for conformational changes in chromosomes have been widely observed in eukaryotes, from yeast to animal and plant cells. DSB-damaged loci in the yeast genome showed increased mobility and relocation to the nuclear periphery. However, the driving forces behind DSB-induced chromatin dynamics remain unclear. In this study, mathematical models of normal and DSB-damaged yeast chromosomes were developed to simulate their structural dynamics. The effects of histone degradation in the whole nucleus and the change in the physical properties of damaged loci due to the binding of SUMOylated repair proteins were considered in the model of DSB-induced chromosomes based on recent experimental results. The simulation results reproduced DSB-induced changes to structural and dynamical features by which the combination of whole nuclear histone degradation and the rigid structure formation of repair protein accumulations on damaged loci were suggested to be primary contributors to the process by which damaged loci are relocated to the nuclear periphery.
Double-strand breaks (DSBs) are the most serious types of DNA damage. From yeast to human, eukaryotes have evolved widely conserved molecular machineries and processes to recognize and repair DNA damage. During the repair process, the drastic changes in chromosome conformations with increased mobility of damaged loci have also been commonly observed among eukaryotes. Various molecular roles were clarified in last two decades, but physical mechanism of chromosome-scale dynamics remained unclear. The present study developed mathematical models of DSB-damaged yeast chromosomes considering DSB-induced local chromatin state changes and revealed physical mechanisms of such dynamical intranuclear processes.
Genomic DNA is frequently damaged by endogenous and exogenous factors [1]. Double-strand breaks (DSBs) are among the most serious types of DNA damage; unrepaired DSBs may lead to deletions or translocations of genome sequences that induce cancer [2–4]. Therefore, eukaryotes have evolved the ability to recognize and repair DNA damage.
Recent studies have suggested that molecular machineries and processes, such as DNA repair proteins and their SUMOylation, are widely conserved from simple unicellular yeast to higher multicellular organisms [5–12]. Additionally, during the repair process, an increase in the mobility of damaged loci and changes in chromosome conformations have also been observed as widely conserved DNA damage responses (DDRs) among eukaryotes [12–21].
Studies on DDRs in budding yeast have aided in developing a model system for eukaryote DDRs. In the yeast genome, the loci damaged by DSBs exhibited increased mobility [13–17] and relocation to the nuclear periphery [21]. Moreover, global histone degradation was observed according to DSB, which was expected to induce decomposition and contribute to changes in the mobility of damaged chromatin [22]. However, the driving forces behind the changes in chromosome conformations and the relocation of damaged loci remain unclear.
In this study, we developed models to represent the intranuclear dynamics of normal chromosomes (named normal model) and chromosomes with DSB-induced damage and histone degradation (named DSB model) in budding yeast. Simulations using these models aimed to reveal the driving forces and physical mechanisms of the DSB-induced increase in chromatin mobility and relocation of damaged loci to the nuclear periphery. Recently, several intranuclear chromosome models of normal budding yeast have been proposed [23–27]. In this study, a more simplified model of normal yeast chromosome than recently proposed ones was considered, by which the primary mechanism of chromosomal dynamics during the repair of DSBs in DNA could be revealed.
Coarse-grained models of normal and damaged chromosomes in the budding yeast nucleus, named the normal and DSB models, respectively, were developed as follows. The n-th of 16 chromosomes was described as a chain consisting of Nn particles with excluded volumes connected by a spring. Here, Nn was assumed to be proportional to the number of base pairs in the n-th chromosome, other than the rDNA region (Table 1). Particles in n-th chain were indexed by i=1, 2, 3, …, Nn from the upper to lower stream of the DNA sequence of the nth chromosome. Each particle was assumed to describe a 1 kbps DNA region for both normal and DSB models and to contain five sets of nucleosomes involving 150 bps DNA with a linker involving 50 bps DNA in a normal model. A recent experimental study showed that 20–40% of histones are degraded throughout the nucleus in response to DSB damage [22], while the data reported in this study suggested that the histones were degraded almost uniformly (Supplementary Figure S1). Therefore, in the DSB model, each particle was assumed to contain three sets of nucleosomes with a linker of 550/3 bp on average.
| Chromosome | # of particles in models |
Centromere particle (i=cen) |
Index i of DSB particles |
Index i of focused usual particles |
|---|---|---|---|---|
| Chr. 1 | 225 | 152 | 77 | |
| Chr. 2 | 804 | 239 | 521 | |
| Chr. 3 | 305 | 115 | 199 | |
| Chr. 4 | 1526 | 450 | 988 | |
| Chr. 5 | 564 | 153 | 359 | |
| Chr. 6 | 265 | 149 | 199 | |
| Chr. 7 | 1085 | 497 | 791 | |
| Chr. 8 | 555 | 106 | 331 | |
| Chr. 9 | 425 | 356 | 179 | |
| Chr. 10 | 735 | 437 | 218 | |
| Chr. 11 | 655 | 441 | 221 | |
| Chr. 12 | Up: 450 Down: 600 |
151 | 76 | |
| Chr. 13 | 915 | 269 | 592 | |
| Chr. 14 | 774 | 629 | 198 | |
| Chr. 15 | 1085 | 325 | 706 | |
| Chr. 16 | 934 | 557 | 279 |
Up and down: Upstream and downstream of rDNA region, respectively.
The positioning and orientation of nucleosomes and linkers in chromosomes are expected to involve randomness. Thus, the radius of the i-th particle in the n-th chain, ri,n, was assumed to be proportional to the edge-to-edge distance of 1 kbp DNA with m sets of nucleosomes with linker DNA, estimated as αi,n∙([Linker length])∙m0.6 according to the arguments of random polymers with excluded volume. Here, [Linker length]~15 nm (=0.3 nm×50 bp) and ~55 nm (=0.3 nm×550/3 bp) were assumed in the normal and DSB models, respectively. Additionally, recent observations of chromatin fibers suggested their typical width-scales were ~30 nm [28]. Therefore, αi,n=0.76 was assumed for all particles, from which ri,n~15 nm was obtained in the normal model. In the DSB model, αi,n=0.76 was also assumed, by which ri,n~40 nm was obtained for each particle. Such an increase in the ri,n of particles in the DSB model means that the average inter-loci distances in chromosomes were increased by DSB compared to those in normal chromosomes, which is qualitatively consistent with recently reported experimental results [16].
Note that the DSB model consists of particles describing chromatin regions with and without damaged loci, named usual particles and DSB particles, respectively. The rigidity of each particle is also expected to depend strongly on the differences in chromatin states characterized by the number of nucleosomes and DNA-binding protein accumulations. The rigidity parameter of the i-th particle in the n-th chain, qi,n, was estimated as follows:
Recent molecular dynamics simulation showed the elastic stress-strain relations of random polymers with excluded volumes could be approximated by that of ideal chains at least if the volume fraction of polymers was lower than 0.38 [29]. In recent experimental observations, the volume fraction of macromolecules in the nucleus was estimated as 0.2–0.3 [30]. Thus, based on the conventional arguments of the rubber elasticity of ideal chains, for all particles in the normal model and usual particles in DSB model,
Conversely, large complex accumulations of SUMOylated repair–related DNA-binding proteins, such as Mre11, Rad50, and Xrs2, are known to form on and around the damage loci [9, 12]. Therefore, for DSB particles in the DSB model, qi,n was expected to be larger than that of the usual particles (Figure 1d). In the present model, qi,n for each DSB particle was simply assumed to be
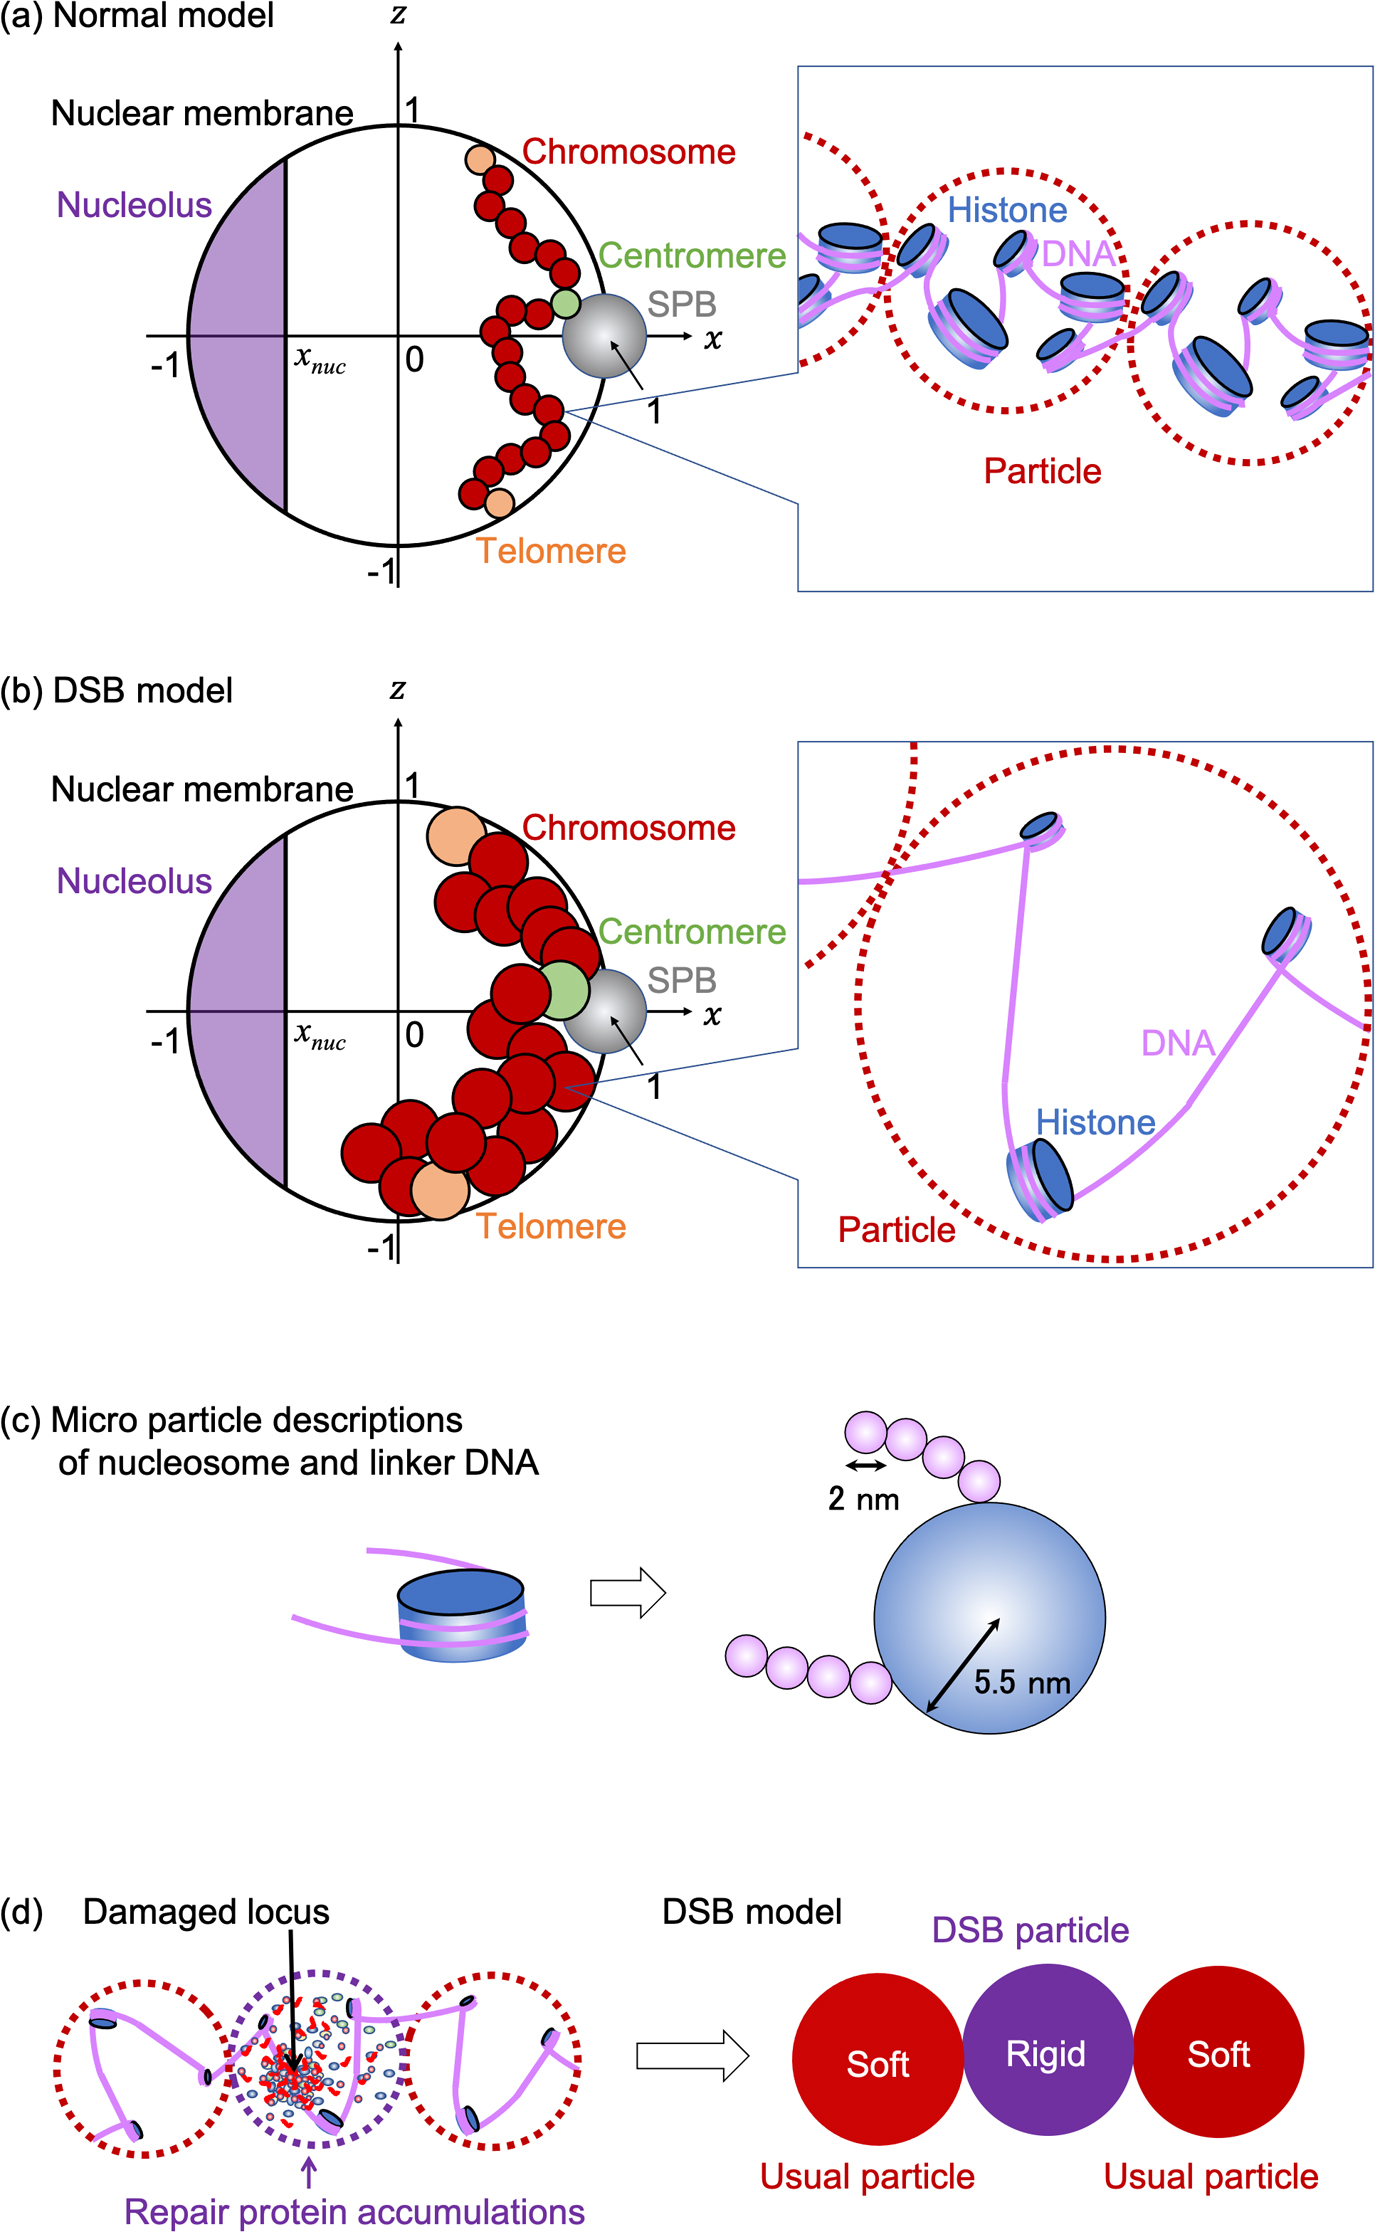
Model illustration of budding yeast chromosomes in nucleus. (a–b) Illustration of normal model (a) and double-strand break (DSB) model (b). Each particle (red) described genomic region containing 1 kbp DNA with histones. Rabble orientations were assumed where the spindle pole body (SPB) and nucleolus were positioned at the other end of the nucleus, centromere particles (green) were connected to the SPB, and telomere particles (orange) were connected to the nuclear membrane. (c) Models of nucleosome and linker DNA described by microparticles with respective radii to estimate the drag coefficient of each particle. (d) Model of DSB particles that described chromatin region containing loci damaged by DSB and large amounts of repair-related protein accumulations.
Because each part of the chromosomes was expected to exhibit 3-dimensional Brownian motion in the yeast nucleus, the position of the i-th particle in the n-th chain in the (x, y, z) 3-dimensional space, xi,n=(xi,n, yi,n, zi,n), was assumed to obey the Langevin equation, as follows:
| (1) |
where γi,n and Ri,n(t) were coefficients of drag force and Gaussian white noise, respectively, playing the role of the random force from nucleoplasm to i-th particle in n-th chain obeying ⟨Ri,n(t)⟩=0, and ⟨Ri,n(t)Ri’,n’(t)⟩=6γi,nkBTδi i’δn n’δ(t–s) with Boltzmann constant kB and temperature T; kBT=4.141947×10⁻²¹ kg m2 s–2 (T=300 K). Here, δij indicates the Kronecker delta, and δ(…) indicates the Dirac delta function. V indicates that the potential of the system involves the potential of forces among the particles and the effect of boundary conditions.
The drag coefficients γi,n for all particles in the normal model and the usual particles in the DSB model were assumed to be the sum of the drag coefficients of m sets of a nucleosome with a linker DNA. Here, each nucleosome and each 6 bps DNA region in the linker DNA were, respectively, approximated by spheres with radii rnucleosome=5.5 nm and rlinker=1 nm. Hence, γi,n was assumed to be =6πηm(rnucleosome+rlinker[Number of base pairs of linker]/6) with the viscosity of the nucleoplasm η=0.64 kg m–1 s–1 [31]. This estimation yielded γi,n=8.34×10⁻⁷ kg/sec for all particles in normal model and γi,n=1.30×10⁻⁶ kg/sec for usual particles in the DSB model.
Note that the drag coefficient for DSB particles should be assumed to be larger than that for usual particles because large amounts of repair-related proteins bind to damaged loci to form large molecular complex accumulations [9, 12]. However, its precise estimation is difficult because of the lack of experimental arguments for measuring its various physicochemical features. Hence, γi,n for DSB particles was assumed as =2.60×10⁻⁶ kg/sec, which was simply twice the value of γi,n for usual particles in the DSB model.
Interactions Among Local Chromosome, Intranuclear Structure, and Nuclear Membrane PartsIn both the normal and DSB models, the nucleus was assumed to be a spherical shell with radius R=1 (μm) containing partial regions corresponding to the nucleolus and spindle pole body (SPB). The position of the center of this container was given as (x,y,z)=(0,0,0), the region of nucleolus was assumed as x<xnuc=–0.552, and the position of the center of SPB and its radius was given as xSPB=(x,y,z)=(1 (μm),0,0) and rSPB=0.1 μm. All particles were assumed to move in a spherical shell, other than the region corresponding to the nucleolus.
The potential of system V providing the forces working on and among the particles is given as
| (2) |
Here, Vbond was the interaction potential to connect each particle forming the chains corresponding to chromosomes, and Vcol is the potential of the collisional interactions among the particles with excluded volumes, the wall of the spherical shell playing the role of the nuclear membrane, and the region corresponding to the nucleolus.
Vrable was the ability to form the rabble orientation of chromosomes where the centromere and telomeres of each chromosome were, respectively, associated with SPB and nuclear membrane, and a part of the 12-th chromosome, the rDNA region, was involved in the nucleolus.
The potential Vbond was assumed by the following:
| (3) |
where
The potential Vrable was assumed by the following:
| (4) |
where the first and second terms indicate the potential of connective interaction between SPB and the particle describing the chromatin region containing the centromere (particle with i=cen, named centromere particle; Table 1 and Figure 1) and that between the wall corresponding to the nuclear membrane and particles describing the chromatin region containing telomeres (particles with i=1 or Nn named telomere particles; Figure 1), respectively. The interaction strengths were assumed to be
The potential Vcol was assumed by the following:
| (5) |
where each term indicates repulsion among particles, that between the particle and the wall corresponding to the nuclear membrane, and that between the particle and the region corresponding to the nucleolus. The interaction strengths were assumed to be
| (6) |
To simulate the model, the time integral of Langevin Eq. (1) was numerically calculated using the Euler–Maruyama method with a unit step of 0.00024 s. The nondimensional parameters,
As the initial condition, particles were placed in the sphere along the order of the coordinates of loci inferred by 4C budding yeast experiments [32]. The mean square displacement (MSD) and radial probability density (RPD) distributions of the particles were measured using the simulation data at t=24000–96000 s, where the system appeared to relax to a steady state (Figure 2).
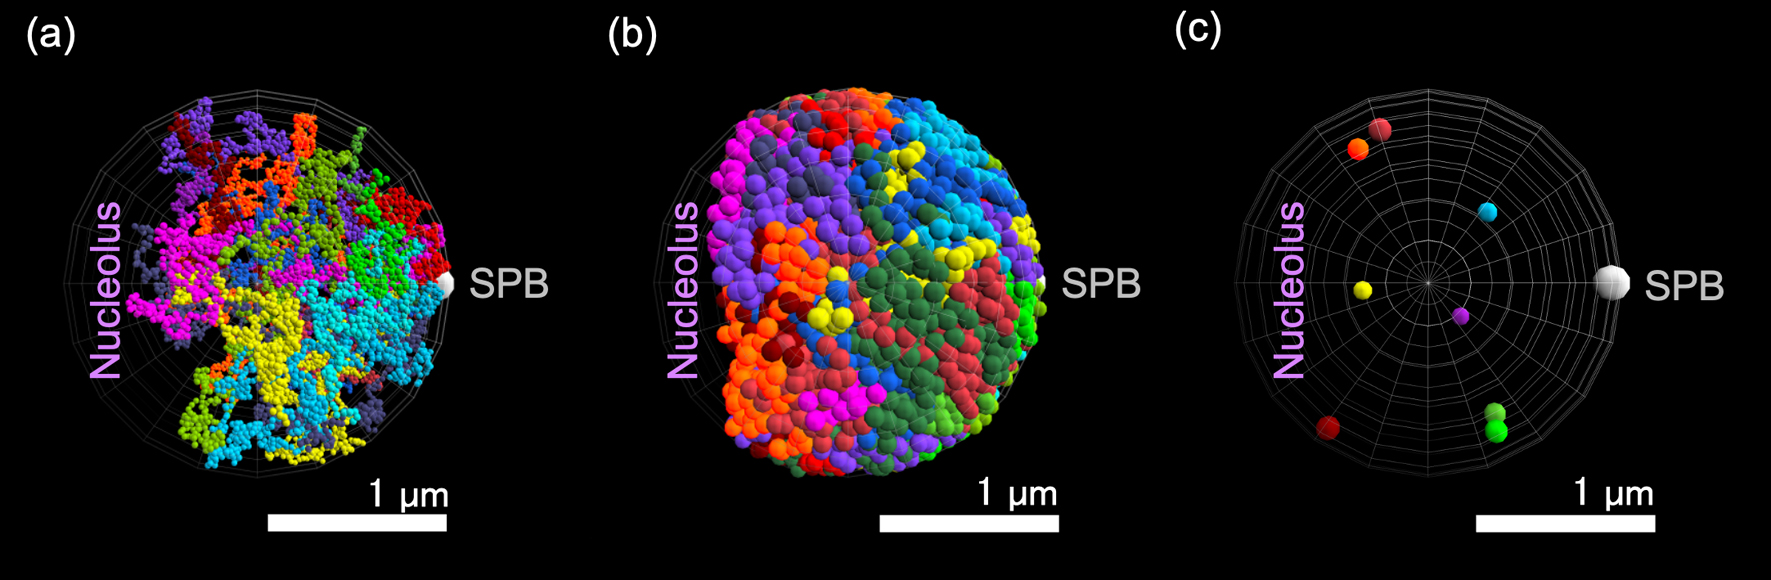
Snapshots of model simulations. (a–b) Snapshots of normal (a) and double-strand break (DSB) models; (b) simulations at 24000 s from initial conditions. Different chromosomes are described by chains of particles with different colors. (c) Eight DSB particles in the snapshot of simulation of the DSB model in (b).
The square displacement of the i-th particle was obtained by SDi(τ,t)=|xi(t+τ)–xi(t)|2, MSD, and the standard deviation of SD (StdSD) of the i-th particle was evaluated using
For each τ, p-value of Welch’s t-test was estimated to compare the MSD of each particle between normal and DSB models. Fitting of each MSD by the function AτB was performed using the least square method.
The radial probability distribution of each particle is defined as the probability distribution of the distance between the centers of the particle and that of the sphere describing the nucleus.
The MSDs of each particle in the normal and DSB models were measured (Figure 3). The DSB models were assumed to contain eight DSB particles (Table 1), where DSB-damages were assumed to be induced to the chromosomes 2, 3, 4, 6, 7, 10, 14, and 15, as one of example cases. To clarify the DSB-damage induced changes in chromatin structures and dynamics, the behaviors of DSB particles were compared to those of some chosen usual particles, named focused usual particles (Table 1), that belong to chromosomes with no DSB particles (chromosomes 1, 5, 8, 9, 11, 12, 13, and 16.).

Mobility of local chromosome parts by model simulations. Mean square displacements (MSDs: solid curves) and their standard deviations (StdSDs: broken curves) of eight DSB particles and eight focused usual particles (Table 1) in the DSB model (red), those of corresponding particles in the normal model (blue). Coefficients A and exponents B were the parameters given by MSDs of normal model (blue) and DSB model (red), respectively, when MSDs were fitted by the function A∙TimeB.
In the DSB model, both DSB and usual particles exhibited larger MSDs than the corresponding particles in the normal model at time =200 sec. Here, for each particle, p-values of Welch’s t-test between MSDs in normal and DSB models at time >2.5 sse was obtained as <10–100. These results were qualitatively consistent with the increases in chromosome mobility reported in recent experimental studies [13–17]. However, when MSD was fitted by the function AτB, the exponent B was obtained as ~0.5 for all cases, which tend to be slightly smaller than those obtained in experimental results [13–17].
Notably, the results were confirmed to be quantitatively independent of γi,n for the DSB particles (Supplementary Figure S2,S3).
Simulations Reproduced Relocation of Damaged Loci to the Nuclear PeripheryThe RPD of the DSB particles in the DSB model and the corresponding particles in the normal model were measured (Figure 4). The DSB models were assumed to contain eight DSB particles (Table 1). The RPD of each DSB particle exhibited a steep peak near the spherical wall, playing the role of a nuclear membrane, whereas the RPD of the corresponding particle in the normal model exhibited low values. It was noted that in the DSB model, the RPD of the usual particles also exhibits large values near the spherical wall compared to those of the corresponding particles in the normal model (Figure 4). However, the RPD values of the DSB particles near the spherical wall were much larger than those of typical particles.

Radial probability density (RPD) of local chromosome parts determined by model simulations. RPD of eight DSB particles and eight focused usual particles (Table 1) in the DSB model (red) and that of corresponding particles in the normal model (blue). Focused usual particles were selected as particles on chromosomes containing no DSB particles. Although the steepness of peaks obtained in DSB particles become weaker than those presented with Q=10, qualitatively similar results were confirmed even in the case of Q=3 (Supplementary Figure S4).
It was noted that the same behaviors of both DSB and usual particles were obtained in DSB models with one DSB particle (Supplementary Table S1 and Figure S5). This indicated that the relocations of the DSB particles occur not collectively but independently.
The DSB model exhibited a higher mobility for each particle and specific localization of DSB particles in the vicinity of the spherical wall than the normal model. These results indicated that the present model reproduced the experimentally-observed DSB-induced phenomena in budding yeast nuclei, where the mobility of chromosomes in the whole nucleus was increased, and damaged loci were relocalized near the nuclear membrane [13–15,21].
The length of each linker was elongated on average by the whole chromosome uniform histone degradation induced by DSBs. Following recent arguments in polymer physics, such linker elongations were considered to enlarge the volume of the effective region occupied by chromatin fibers and weaken the excluded volume effects among the effective regions. In the present study, these two effects were observed, affected by the difference in radius and rigidity of particles describing the chromatin region containing 1 kbp DNA between normal and DSB models; each particle in the DSB model was assumed to be larger and softer than that of the normal model. The present study suggests that these effects play key roles in the occurrence of DSB response behaviors in the yeast chromosomes.
The centromere of each chromosome is connected to the SPB in the yeast nucleus, which restricts the motion of the intranuclear chromosomes. However, DSB-induced expansion and softening of the effective chromatin regions weakened this restriction and extended the intranuclear mobile space of these regions. These facts could explain the increase in the mobility of chromatin regions in the whole nucleus, which is consistent with the recently proposed explanation based on observations of chromatin elongation by DSBs in the yeast nucleus [16]. It should also be noted that the simulation of the following variant of the DSB model, which consists of only usual particles with larger radii than the particles in the normal model, also shows an increase in particle mobility (Supplementary Figure S6). This suggests that the expansion of chromatin region by histone degradation is a primary contributor to the increase in chromatin mobility, which is consistent with recently reported experimental results [22].
The expansion of effective chromatin regions increases the volume fraction of chromosomes in the nucleus. Additionally, elements with different physical characteristics such as volume, shape, and rigidity tend to segregate with each other in space under crowded situations by various elements, which may be explained by the entropy effects and a similar mechanism to the depletion force [33–40] (note that the excluded volumes of rigid particles were effectively larger than those of soft particles even if the volumes of particles were uniform). Here, the chromatin regions containing DSB-induced damaged loci were expected to be more rigid than other regions due to the accumulation of DNA-binding repair–related proteins; these regions were implemented by rigid particles in the present model. These facts suggest that the chromatin region with damaged loci tends to be driven away to the nuclear periphery from the inner space of the nucleus, where non-damaged chromatin regions are crowded. In other words, the entropic effect induced by the increase in the volume fraction of effective chromosome regions in the nucleus and subsequent rigidization of the chromatin region around damaged loci was likely the driving force inducing the relocation of damaged loci to the nuclear periphery. This fact can also be easily imaged by brief considerations using simple lattice-blocks model consisting of rigid and soft blocks (Figure 5).

Illustrations of simple one-dimensional lattice model-blocks model containing soft and rigid blocks providing the intuitive understanding of why rigid DSB particles tend to locate near nuclear periphery. (a) Model consists of six sites with edge walls and three blocks, one yellow block and two green blocks, with the width=2 sites, that the lattice space was highly crowded. It was assumed that the two soft blocks overlap each other by half (width=1 site). (b) Illustrations of all states when all blocks were assumed as soft blocks. The number of all states, W, was obtained as 30, and the number of states that yellow block contacts with edge walls, w, was obtained as 12. Therefore, the probability that the yellow block contacts with edge walls was estimated at 2/5. (c) Illustrations of all states when green and yellow blocks were assumed as soft and rigid blocks, respectively. W and w were obtained as 9 and 6, respectively. Then, the probability that yellow block contact with the edge walls was estimated at 2/3, that was higher than the case in (b). These facts suggested that the rigid objects like DSB particles in the present models tend to contact with edge walls like nuclear membrane more frequently than the soft objects like usual particles.
It should be noted that the simulation of the following variant of the DSB model, where DSB particles were assumed to be rigid, but the radii of all particles remained the same as the normal model, did not exhibit any clear localization of DSB particles around the spherical wall (Supplementary Figure S7). This observation supports the importance of chromatin region expansion by histone degradation for inducing relocation of damaged loci to the nuclear periphery.
Mathematical models of normal and DSB-damaged yeast chromosomes were developed and simulated. Various aspects of the mechanisms of DSB-induced chromatin dynamics in the yeast genome such as the increase in mobility of whole chromosomes and relocation of DSB-damaged loci to the nuclear periphery were revealed.
The present models qualitatively reproduced the experimentally observed DSB-induced increase in the mobility of each chromatin region [13–17], but could not reproduce them quantitatively. Additionally, the standard deviation of mobilities of each chromatin region in the present models seem larger than that observed in experiments. This is because some effects other than histone degradation might also contribute to DSB-induced increases in whole chromosome mobility, which should be discovered to prove the model in the future. The assumptions for modeling the chromatin structures after histone degradations and those for modeling chromatin regions with damaged loci should be validated and improved based on more detailed biochemical studies with experiments and analyses in future. The clarification of the more detailed mechanism of histone degradation will also be an important future issue to describe the entire process of the DSB damage response of yeast chromosomes. Additionally, based on the progress of studies on such future issues, a model that can reproduce the damage response phenomena quantitatively will be constructed in the future.
The authors declare that they have competing interests.
S.N. and A.A. conceived and designed the study; S.N. and A.A. developed the mathematical model. S.N. and T.K. conducted the simulations; S.N., T.K., M.F., and A.A. analyzed the data; S.N., T.K., M.F., and A.A. wrote the manuscript.
We thank C. Horigome for providing the useful information. Computations were partially performed on the NIG supercomputer at ROIS National Institute of Genetics.