Abstract
Human cytomegalovirus (CMV) is the most common cause of viral intrauterine infection in developed countries. It has been shown that CMV DNA was frequently detected in the fetal membranes when the placenta was infected in utero. However, it is still not clear whether CMV replicates in constituent cells of the fetal membranes. We investigated CMV infection of primary cultured chorion and amnion cells prepared from human fetal membrane tissues. In both types of cell cultures, rounded cells were observed at day 8 and 12 after CMV inoculation, and virus yields in culture supernatants were increased after the inoculation. In both types of cells, viral immediately early 1 (IE1) protein-positive nuclei were scattered at day 4 after the inoculation, and IE1 mRNA was expressed throughout day 1 to 12 after CMV inoculation. In chorion cell cultures, the number of IE1 protein-positive nuclei increased significantly at day 8 and 12 after CMV inoculation as compared to day 4, by which foci were formed. Furthermore, an evident increase in levels of lactate dehydrogenase leakage from chorion cells was observed after CMV inoculation. Contrary, these phenomena were not observed in amnion cell cultures. These results demonstrated that both chorion and amnion cells were permissive to CMV infection, while the velocity of cell-to-cell spread of CMV infection in amnion cells was much lower than that in chorion cells. Therefore, the present study suggests that CMV may replicate rapidly in the chorion cell layer and slowly in the amnion cell layer during intrauterine infection.
Human cytomegalovirus (CMV) is the most common cause of viral intrauterine infection in developed countries, affecting 0.5 to 2% of all live births.1) Primary CMV infection during pregnancy presents a 30 to 40% risk of intrauterine transmission of virus to the fetus.2,3) Congenital CMV infection may result in abnormal pregnancy outcomes (i.e., abortion, premature delivery and stillbirth), microcephaly, chorioretinitis, hepatosplenomegaly, jaundice, deafness and mental retardation.4,5) A recent study in Japan has revealed that seroprevalence of CMV in pregnant women gradually decreased from 74.6% in 2000 to 42.5% in 2008.6) Thus pregnant women in Japan are commonly considered to be at increased risk of primary CMV infection and congenital CMV infection during pregnancy.
The pathogenesis of CMV transmission to the fetus during pregnancy is largely unknown. Since congenital CMV infections are commonly associated with chronic villitis4,7–9) and infection of the placenta.10,11) Using placentas infected naturally in utero, CMV immediately early 1 (IE1) protein was detected in villous cytotrophoblast cells, syncytiotrophoblast cells, vascular endothelial cells and macrophages by immunohistochemical analysis.12–14) CMV genome was detected most frequently in the villi, including the mesenchyme and trophoblasts, by in situ hybridization.10) When isolated chorionic villi were exposed to CMV in vitro, IE1 protein was expressed in cytotrophoblast cells, but not syncytiotrophoblast cells.14,15) Progeny virus particles were produced and released from cultured cytotrophoblast cells, syncytiotrophoblast cells, amnion epithelial cells and placental fibroblast cells after CMV inoculation in vitro.15–17) Therefore, it is widely accepted that CMV transmission to the fetus likely occurs through the placenta.18)
Human fetal membranes are appendages of placenta, which are composed of fetus-derived amnion and chorion tissues, and maternal decidua tissue.19,20) They form boundaries between the fetus and the external world and play a critical role as defensive barriers against infectious agents in order to maintain normal pregnancy.21) A recent study has demonstrated that CMV DNA was frequently detected in the fetal membranes as similar to the parenchyma of placenta.10) In the fetal membranes infected naturally in utero, CMV DNA was localized in chorionic trophoblast cells, decidua cells and macrophages.10) Although it has been reported that CMV replicated in cultured amnion epithelial cells as described above,17) it is not clear whether CMV replicates in other types of constituent cells of the fetal membranes. Therefore, we investigated the infection of cultured human fetal membrane cells with CMV. The present study demonstrates that the progeny virus particles are produced and released from both cultured chorion and amnion cells, suggesting that CMV may replicate rapidly in the chorion cell layer and slowly in the amnion cell layer during intrauterine infection.
MATERIALS AND METHODS
Preparation of Primary Cultured Chorion and Amnion CellsHuman fetal membrane tissues were obtained by elective cesarean section in the month of normal parturition. The study using human tissues has been approved by the Institutional Review Board Committee at Tokyo University of Pharmacy and Life Sciences. An informed consent was obtained from patients at the time of surgery. Primary cultured chorion and amnion cells were prepared from human fetal membrane tissues and grown in 1 : 1 mixture of Dulbecco’s modified Eagle’s medium (DMEM) and Ham’s F-12 medium supplemented with 20% heat-inactivated fetal bovine serum (FBS), 120 µg/mL kanamycin sulfate, 120 units/mL penicillin G sodium, 120 µg/mL streptomycin sulfate, 16 µg/mL gentamicin sulfate and 0.3 µg/mL amphotericin B as described.22)
Preparation of CMV StockHuman embryonal lung fibroblast MRC-5 cells infected with CMV (strain AD169) and non-infected MRC-5 cells were obtained from American Type Tissue Culture Collection (VA, U.S.A.). Non-infected MRC-5 cells were grown in Eagle’s minimum essential medium (MEM) containing 10% heat-inactivated FBS, 100 units/mL penicillin G sodium and 100 µg/mL streptomycin sulfate. CMV-infected MRC-5 cells were added to confluent monolayers of MRC-5 cells, which were incubated for 11 d with culture medium containing 2% heat-inactivated FBS at 37°C in a humidified atmosphere containing 5% CO2 in air. The cells were homogenized in culture supernatants with a Potter–Elvehjem homogenizer, followed by centrifugation at 50×g for 5 min at 4°C. The supernatants were divided into aliquots and stored at –80°C till use. The infectious virus titers in supernatants were determined by 2 d infection focus assay as described below. The CMV suspension containing 6×10⁶ infection focus units (IFU)/mL was thawed at room temperature and diluted at 6×10⁴ and 6×10⁵ IFU/mL with serum-free culture medium for use.
Infection ProcedureConfluent monolayers of chorion (8×10⁴ cells/cm2) and amnion (20×104 cells/cm2) cells were rinsed with phosphate buffered saline (PBS) and inoculated with 0.5×10⁴ and 5×10⁴ IFU of CMV particles in a volume of 0.08 mL/cm2 for 1 h at 37°C. Multiplicity of infection (MOI) was calculated by dividing the cell density by the inoculated IFU density and shown in Table 1. As mock-inoculated control cells, cells were inoculated with serum-free culture medium alone in the absence of viruses for 1 h at 37°C. After removal of inoculants, cells were incubated for desired periods till 12 d with medium containing 20% heat-inactivated FBS (0.2 mL/cm2) at 37°C in a humidified atmosphere containing 5% CO2 in air. Culture medium was changed every 4 d. Culture supernatants were collected by a centrifugation at 50×g for 5 min at 4°C to remove cell debris and stored at –80°C till use.
Table 1. Parameters of CMV Infection and Replication
| Chorion cells | Amnion cells |
|---|
| Cell density (cells/cm2) | 80000 | 200000 |
| Inoculated virus particle density (IFU/cm2) | 50000 | 50000 |
| Multiplicity of infection (MOI) | 0.625 | 0.250 |
| Relative infection efficiency (%) | 5.5±0.2† | 1.4±1.0 |
| Relative replication efficiency | 56000±18000 | 44000±39000 |
The relative infection efficiency was calculated by dividing the percentages of IE1-positive cells on day 4 by the MOI. The relative replication efficiency was calculated by dividing the virus yield (PFU/mL) in culture supernatants on day 12 by the percentages of IE1-positive cells. These parameters were calculated from there independent experiments. Data are shown as means and standard deviations. Statistical analysis using the Student’s t-test (n=3) shows a significant difference in infection efficiencies between chorion and amnion cells († p<0.005).
The density of infectious virus particles was determined by an infection focus assay as described.16) Moreover, the assay method was applied for the detection of CMV-infected cells. Chorion, amnion and MRC-5 cells were grown to confluency on cover slips coated with type I collagen. Cells were rinsed with PBS and inoculated with samples at 0.08 mL/cm2 for 1 h at 37°C. After removal of inoculants, chorion and amnion cells were incubated for desired periods till 12 d with culture medium containing 20% heat-inactivated FBS at 37°C in a humidified atmosphere containing 5% CO2 in air changing medium every 4 d. MRC-5 cells were incubated till 4 d with culture medium containing 10% heat-inactivated FBS. Cells on cover slips were rinsed with PBS and 1% bovine serum albumin (BSA) in PBS (blocking buffer) and air-dried. The cells were fixed with ice-cold acetone for 5 min and air-dried. The cells were incubated with 5 µg/mL mouse monoclonal antibody against CMV IE1 protein (Chemicon, CA, U.S.A.) in blocking buffer for 1 h at 37°C and rinsed with PBS. The cells were incubated with 10 µg/mL goat polyclonal anti-mouse immunoglobulin (Ig) G antibody conjugated with tetramethylrhodamine (Wako Pure Chemical Industries, Ltd., Osaka, Japan) in blocking buffer for 30 min at 37°C and rinsed with PBS. Furthermore, the cells were incubated with 1.4 µg/mL 4′,6-diamidino-2-phenylindole dihydrochloride (DAPI; Wako Pure Chemical Industries, Ltd., Osaka, Japan) in PBS for 10 min and rinsed with PBS. The stained cells were enclosed in FluorSave™ Reagent (Calbiochem, CA, U.S.A.) of a mounting medium. DAPI-stained nuclei and IE1 protein-expressing nuclei were observed under a fluorescence microscope, Axiovert 200 (Carl Zeiss, Germany), and counted visually on photomicrographs of randomized five fields. The relative infection efficiencies were calculated by dividing the percentages of IE1-positive cells on day 4 by the MOI and shown in Table 1. The number of IE1 protein-expressing MRC-5 cells on day 2 after CMV inoculation was equated to an ability of infection focus-forming units (IFU) in sample, and the virus titers in samples were determined within a linear dose–response concentration range as IFU/mL.
Plaque-Forming AssaySince plaque-forming assay is a simple method for determination of infectious virus titers in samples, it was carried out in confluent monolayers of human embryonal lung fibroblast HEL 299 cells (American Type Culture Collection, VA, U.S.A.) as described.23) Plaque formed by virus was observed under a microscope after staining with Giemsa’s solution and counted visually. The infectious virus titer was calculated and indicated as plaque-forming units (PFU)/mL. The relative replication efficiencies were calculated by dividing the virus titers in culture supernatants on day 12 by the percentages of IE1-positive cells and shown in Table 1.
Reverse Transcriptase-Polymerase Chain Reaction (RT-PCR) MethodMessenger RNAs for viral IE1 and cellular glycerol-3-phosphate dehydrogenase (G3PDH) were amplified with RT-PCR techniques as described.24) DNA sequences of primers and conditions for PCR are shown in Table 2. PCR primers for G3PDH were purchased from Clontech Laboratories, Inc. (CA, U.S.A.). DNA sequences of primers for IE1 were referred to published DNA sequences and custom-made by Sigma (Tokyo, Japan).25) PCR consisted of denaturation at 94°C for 45 s, annealing at 55°C or 60°C for 45 s and extension at 72°C for 2 min. PCR products were analyzed by agarose gel electrophoresis.
Table 2. PCR Primers and Conditions
| Target mRNA | DNA sequence of primers | Size of PCR product (bp) | Annealing temp. (°C) | Optimal PCR cycle no. |
|---|
| IE1 | S | 5′-GGT GCA TTG GAA CGC GGA TT-3′ | 353 | 55 | 30 |
| AS | 5′-ATT CTA TGC CGC ACC ATG TCC A-3′ |
| G3PDH | S | 5′-TGA AGG TCG GAG TCA ACG GAT TTG GT-3′ | 983 | 60 | 21 |
| AS | 5′-CAT GTG GGC CAT GAG GTC CAC CAC-3′ |
Abbreviations: S, sense; AS, antisense; bp, base pairs.
Cell damage was estimated by LDH leakage into culture supernatants as described.22) Culture supernatants were diluted 8-fold with PBS, in which the LDH activity was measured using the LDH-Cytotoxic Wako kit (Wako Pure Chemical Industries, Ltd., Osaka, Japan) and indicated as absorbance at 550 nm.
Statistical AnalysisStatistical analysis was performed using the Wilcoxon’s test or the Student’s t-test methods. A p-value less than 0.05 was considered significant.
RESULTS AND DISCUSSION
Observations under a phase contrast microscope noted that rounded cells appeared at day 4 after CMV inoculation in the chorion cell cultures but not after mock inoculation (Fig. 1). In the chorion cell cultures, the number of rounded cells increased at day 8 after CMV inoculation. At 12 d after CMV inoculation, the rounded cells formed foci. Contrary, in the amnion cell cultures, rounded cells were observed at day 8 and 12 after CMV inoculation but not after mock inoculation. After hematoxylin–eosin staining (Fig. 2), rounded cells with increased eosinophilia and a degraded cell were observed in the chorion cell cultures after CMV inoculation, the cytopathic effect (CPE) on chorion cells was characteristic for that on fibroblast cells.26) In the amnion cell cultures after CMV inoculation, owl’s eye-like cells with increased eosinophilia were observed (Fig. 2), corresponding with the previous observations as reported by Figueroa and co-workers.17) It has been reported that the CPE of CMV infection on amnion cells progressed slowly for several weeks until most of the cells were affected, and the cells eventually detached and disintegrated.17)


Both in chorion cells and in amnion cells, yields of infectious virus particles in culture supernatants were significantly increased during day 8–12 after CMV inoculation as compared to that of day 0–4 (Fig. 3). The virus yields in chorion and amnion cell cultures during day 8–12 were 16000±9300 and 620±310 PFU/mL, respectively. The levels of virus yield in chorion cell cultures were significantly higher than those of amnion cell cultures. In our parallel experiments using human embryonal lung fibroblast MRC-5 cells, CMV replication accomplished by 4 d after CMV inoculation (data not shown). These results indicated that chorion and amnion cells were permissive to CMV infection and released progeny virus particles, but CMV replication in chorion and amnion cells was slower than that in fibroblast cells.

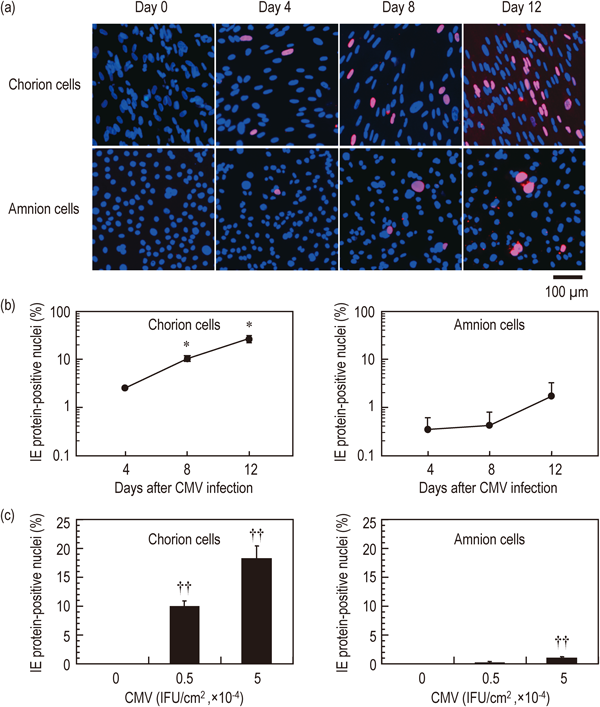
IE1 gene is the first to be transcribed and plays a pivotal role in determining CMV replication.27) The infection of chorion and amnion cells with CMV was further examined by analyzing viral IE1 gene expression. IE1 mRNA was expressed in both chorion and amnion cells throughout day 1 to 12 after CMV inoculation (Fig. 4). Although G3PDH mRNA was amplified from all samples, IE1 mRNA was not detected after mock inoculation. In the chorion cell cultures at day 4 and 8 after CMV inoculation, IE1 protein-positive nuclei (pink) were scattered (Fig. 5a), the numbers of which were 2.6±1.7% and 10.3±5.0%, respectively (Fig. 5b). IE1 protein-positive nuclei spread as islands and formed foci at day 12 (Fig. 5a), the number of which significantly increased to 27.1±16.0% (Fig. 5b). The increase of IE1 protein-positive nuclei at day 12 was depending on the density of virus particles inoculated (Fig. 5c). In the amnion cell cultures at day 4 after CMV inoculation, IE1 protein-positive nuclei were scattered (Fig. 5a), the number of which was 0.4±0.4% (Fig. 5b). IE1 protein-positive nuclei did not form focus at day 12 (Fig. 5a). The numbers of IE1 protein-positive nuclei at day 8 and 12 were 0.4±0.5% and 1.7±2.0%, respectively (Fig. 5b). There was no significant difference in the number of IE1 protein-positive nuclei among day 4, 8 and 12 after CMV inoculation, although it increased at day 12 depending on the density of virus particles inoculated (Fig. 5c). The relative infection efficiencies of chorion cells were significantly higher than those of amnion cells, while there was no significant difference in relative replication efficiencies between chorion and amnion cells (Table 1). Accordingly, the higher virus yields in chorion cell cultures can be ascribed to the higher infection efficiency. These results indicated that IE1 gene expressed in both chorion and amnion cells. The velocities of cell-to-cell spread of CMV infection during the period of day 4–12 among chorion and amnion cell cultures were calculated as 3.1% and 0.2% increase/day, respectively. The velocity of cell-to-cell spread of CMV infection in amnion cells was much lower than that in chorion cells, which might be due to the lower infection efficiency.

Our results demonstrated that CMV infection resulted in permissive infection in both chorion and amnion cells, while there was a definitive difference in the velocities of cell-to-cell spread of CMV infection between them. It is possible that CMV infection spreads rapidly in the chorion layer of the fetal membranes in utero but slowly in the amnion layer. Heparan sulfate proteoglycans are ubiquitously expressed and absolutely required for CMV entry into host cells, however, heparan sulfate proteoglycans alone are not sufficient to mediate CMV entry.28) Recent studies have revealed that cellular integrins (α2β1, α6β1 and αVβ3) and epidermal growth factor receptor are identified as entry receptors for CMV.29,30) The activation of platelet-derived growth factor receptor α is required for CMV infection,31) although CMV infection decreases the expression of platelet-derived growth factor receptor α.32) Histone acetylation controls CMV replication and cell lysis.33) Inhibition of cyclooxygenase activity blocks cell-to-cell spread of CMV infection.34) Furthermore, it has been known that histone acetylation at cyclooxygenase gene promoter in amnion cells is higher after labor than before.35) An investigation of these cellular components may help to understand mechanisms of slow cell-to-cell spread of CMV infection among amnion cells.
LDH is wide spread in cell membrane and cytoplasm and released into the culture medium when the cells are damaged by infection with cytopathogenic viruses as observed in influenza viruses.36) Cell damage induced by CMV infection was determined by the measurement of LDH leakage from cells. As compared to day 0–4 after CMV inoculation, LDH activities during day 4–8 and 8–12 were increased in culture supernatants of chorion cells with a time dependent manner (Fig. 6a). After mock inoculation, LDH activity was not increased. These results indicated that CMV infection induced lysis in chorion cells. No detectable cell lysis was observed in amnion cells by day 12 after CMV inoculation. It is conceivable that the intrauterine CMV infection induces fetal membrane dysfunction through the degradation of chorion tissue layer.

In conclusion, our results demonstrated that both cultured chorion and amnion cells prepared from human fetal membrane tissues were permissive to CMV infection and released progeny virus particles, while the velocity of cell-to-cell spread of CMV infection in amnion cells was much lower than that in chorion cells. Therefore, the present study suggests that CMV may replicate rapidly in the chorion cell layer and slowly in the amnion cell layer during intrauterine infection.
Acknowledgements
This work was supported in part by grants from the Ministry of Education, Culture, Sports, Science and Technology of Japan and by the Promotion and Mutual Aid Corporation for Private School of Japan.
REFERENCES
- 1) Alford CA, Stagno S, Pass RF, Britt WJ. Congenital and perinatal cytomegalovirus infections. Rev. Infect. Dis., 12 (Suppl. 7), S745–S753 (1990).
- 2) Stagno S, Pass RF, Dworsky ME, Henderson RE, Moore EG, Walton PD, Alford CA. Congenital cytomegalovirus infection: The relative importance of primary and recurrent maternal infection. N. Engl. J. Med., 306, 945–949 (1982).
- 3) Stagno S, Pass RF, Cloud G, Britt WJ, Henderson RE, Walton PD, Veren DA, Page F, Alford CA. Primary cytomegalovirus infection in pregnancy. Incidence, transmission to fetus, and clinical outcome. JAMA, 256, 1904–1908 (1986).
- 4) Wen LZ, Xing W, Liu LQ, Ao LM, Chen SH, Zeng WJ. Cytomegalovirus infection in pregnancy. Int. J. Gynaecol. Obstet., 79, 111–116 (2002).
- 5) Horstmann DM. Viral infections in pregnancy. Yale J. Biol. Med., 42, 99–112 (1969).
- 6) Inde Y, Yamaguchi S, Kamoi S, Takeshita T. Transition of cytomegalovirus seropositivity in Japanese puerperal women. J. Obstet. Gynaecol. Res., 36, 488–494 (2010).
- 7) Sachdev R, Nuovo GJ, Kaplan C, Greco MA. In situ hybridization analysis for cytomegalovirus in chronic villitis. Pediatr. Pathol., 10, 909–917 (1990).
- 8) Nakamura Y, Sakuma S, Ohta Y, Kawano K, Hashimoto T. Detection of the human cytomegalovirus gene in placental chronic villitis by polymerase chain reaction. Hum. Pathol., 25, 815–818 (1994).
- 9) Saetta A, Agapitos E, Davaris PS. Determination of CMV placentitis. Diagnostic application of the polymerase chain reaction. Virchows Arch., 432, 159–162 (1998).
- 10) Kumazaki K, Ozono K, Yahara T, Wada Y, Suehara N, Takeuchi M, Nakayama M. Detection of cytomegalovirus DNA in human placenta. J. Med. Virol., 68, 363–369 (2002).
- 11) Paradowska E, Przepiórkiewicz M, Nowakowska D, Studzińska M, Wilczyński J, Emery VC, Leśnikowski ZJ. Detection of cytomegalovirus in human placental cells by polymerase chain reaction. APMIS, 114, 764–771 (2006).
- 12) Mühlemann K, Miller RK, Metlay L, Menegus MA. Cytomegalovirus infection of the human placenta: an immunocytochemical study. Hum. Pathol., 23, 1234–1237 (1992).
- 13) Sinzger C, Müntefering H, Löning T, Stöss H, Plachter B, Jahn G. Cell types infected in human cytomegalovirus placentitis identified by immunohistochemical double staining. Virchows Arch. A Pathol. Anat. Histopathol., 423, 249–256 (1993).
- 14) Fisher S, Genbacev O, Maidji E, Pereira L. Human cytomegalovirus infection of placental cytotrophoblasts in vitro and in utero: implications for transmission and pathogenesis. J. Virol., 74, 6808–6820 (2000).
- 15) Halwachs-Baumann G, Wilders-Truschnig M, Desoye G, Hahn T, Kiesel L, Klingel K, Rieger P, Jahn G, Sinzger C. Human trophoblast cells are permissive to the complete replicative cycle of human cytomegalovirus. J. Virol., 72, 7598–7602 (1998).
- 16) Hemmings DG, Kilani R, Nykiforuk C, Preiksaitis J, Guilbert LJ. Permissive cytomegalovirus infection of primary villous term and first trimester trophoblasts. J. Virol., 72, 4970–4979 (1998).
- 17) Figueroa ME, Geder L, Rapp F. Infection of human amnion cells with cytomegalovirus. J. Med. Virol., 2, 369–375 (1978).
- 18) McCarthy FP, Giles ML, Rowlands S, Purcell KJ, Jones CA. Antenatal interventions for preventing the transmission of cytomegalovirus (CMV) from the mother to fetus during pregnancy and adverse outcomes in the congenitally infected infant. Cochrane Database Syst. Rev., CD008371 (2011). doi: 10.1002/14651858.CD008371.pub2
- 19) Lavery JP. Appendages of the placenta. The Human Placenta. (Lavery JP ed.) Aspen Publishers Inc., Maryland, pp. 257–279 (1987).
- 20) Malak TM, Bell SC. Structural characteristics of term human fetal membranes: a novel zone of extreme morphological alteration within the rupture site. Br. J. Obstet. Gynaecol., 101, 375–386 (1994).
- 21) Grossman JH, Dennis LG. Infections affecting the placenta. The Human Placenta. (Lavery JP ed.) Aspen Publishers Inc., Maryland, pp. 131–154 (1987).
- 22) Uchide N, Suzuki A, Ohyama K, Bessho T, Toyoda H. Secretion of bioactive interleukin-6 and tumor necrosis factor-alpha proteins from primary cultured human fetal membrane chorion cells infected with influenza virus. Placenta, 27, 678–690 (2006).
- 23) Neyts J, Andrei G, Snoeck R, Meerbach A, De Clercq E. Methods in Anti-HCMV Research. Cytomegalovirus Protocols. (Sinclair J ed.) Human Press Inc., New Jersey, pp. 129–152 (2000).
- 24) Uchide N, Ohyama K, Yuan B, Sano T, Bessho T, Yamakawa T. Differential mRNA expression of inflammatory cytokines in cultured human fetal membrane cells responding to influenza virus infection. Biol. Pharm. Bull., 25, 239–243 (2002).
- 25) Mendelson M. Analysis of Human Cytomegalovirus Using the Polymerase Chain Reaction. Cytomegalovirus Protocols. (Sinclair J ed.) Human Press Inc., New Jersey, pp. 39–52 (2000).
- 26) Furukawa T, Fioretti A, Plotkin S. Growth characteristics of cytomegalovirus in human fibroblasts with demonstration of protein synthesis early in viral replication. J. Virol., 11, 991–997 (1973).
- 27) Mach M, Stamminger T, Jahn G. Human cytomegalovirus: recent aspects from molecular biology. J. Gen. Virol., 70, 3117–3146 (1989).
- 28) Compton T, Nowlin DM, Cooper NR. Initiation of human cytomegalovirus infection requires initial interaction with cell surface heparan sulfate. Virology, 193, 834–841 (1993).
- 29) Feire AL, Koss H, Compton T. Cellular integrins function as entry receptors for human cytomegalovirus via a highly conserved disintegrin-like domain. Proc. Natl. Acad. Sci. U.S.A., 101, 15470–15475 (2004).
- 30) Wang X, Huong SM, Chiu ML, Raab-Traub N, Huang ES. Epidermal growth factor receptor is a cellular receptor for human cytomegalovirus. Nature, 424, 456–461 (2003).
- 31) Soroceanu L, Akhavan A, Cobbs CS. Platelet-derived growth factor-α receptor activation is required for human cytomegalovirus infection. Nature, 455, 391–395 (2008).
- 32) Gredmark S, Strååt K, Homman-Loudiyi M, Kannisto K, Söderberg-Nauclér C. Human cytomegalovirus downregulates expression of receptors for platelet-derived growth factor by smooth muscle cells. J. Virol., 81, 5112–5120 (2007).
- 33) Ioudinkova E, Arcangeletti MC, Rynditch A, De Conto F, Motta F, Covan S, Pinardi F, Razin SV, Chezzi C. Control of human cytomegalovirus gene expression by differential histone modifications during lytic and latent infection of a monocytic cell line. Gene, 384, 120–128 (2006).
- 34) Schröer J, Shenk T. Inhibition of cyclooxygenase activity blocks cell-to-cell spread of human cytomegalovirus. Proc. Natl. Acad. Sci. U.S.A., 105, 19468–19473 (2008).
- 35) Mitchell CM, Johnson RF, Giles WB, Zakar T. Zakar T., Prostaglandin H synthase-2 gene regulation in the amnion at labour: histone acetylation and nuclear factor kappa B binding to the promoter in vivo. Mol. Hum. Reprod., 14, 53–59 (2008).
- 36) Uchide N, Ohyama K, Bessho T, Yuan B, Yamakawa T. Apoptosis in cultured human fetal membrane cells infected with influenza virus. Biol. Pharm. Bull., 25, 109–114 (2002).