Abstract
Mycophenolate mofetil (MMF) is used for oral administration to prevent rejection in renal transplant recipients, and is rapidly converted into mycophenolic acid (MPA), the active metabolite, by hydrolysis in vivo. The area under the concentration–time curve (AUC0–12 h) of MPA is considered to be an effective pharmacokinetics parameter for predicting acute rejection. However, frequent blood sampling is required to calculate AUC0–12 h, which imposes a burden on patients and providers. Therefore, we examined a limited sampling strategy (LSS) for estimation of MPA-AUC0–12 h using only a trough level (C0) and two points including C0 in Japanese living-related renal transplant recipients with concomitant extended-release tacrolimus (ER-TAC). The present study suggests that better estimation of MPA-AUC0–12 h can be obtained by using two points including C0 as compared with only C0 regardless of transplant progress. Furthermore, blood collection points showing the highest estimation of MPA-AUC0–12 h by adding to C0 were C4 at pre-transplantation (Tx) and 1 month post-Tx, and C6 at 3 months post-Tx. We conjecture that changes in renal function and serum albumin (Alb) accompanying transplant progress are aggravating factors in terms of estimation, because there was also a significant difference in the reciprocal of serum creatinine (1/Scr) and Alb between pre-Tx and post-Tx in this study. In conclusion, the present study provides useful information for effective and efficient monitoring of MPA levels in Japanese living-related renal transplant recipients.
Mycophenolate mofetil (MMF) is rapidly hydrolyzed in vivo to the active compound mycophenolic acid (MPA). MPA is a potent and reversible uncompetitive inhibitor of inosine monophosphate dehydrogenase (IMPDH) and depletes the pool of deoxyguanosine triphosphate (dGTP) required for DNA synthesis by inhibiting IMPDH.1) MMF is generally combined with calcineurin inhibitors (CNIs), tacrolimus and Cyclosporin A, and a steroid to prevent rejection after renal transplantation. Dosage of MMF is often adjusted based on therapeutic drug monitoring because past reports have suggested that the area under the concentration–time curve (AUC0–12 h) of MPA is a useful pharmacokinetic parameter for predicting the clinical effect and rejection.2–4) However, since the calculation of AUC0–12 h requires frequent sampling of blood, convenience, invasiveness, cost efficiency, etc. have become problems.
Moreover, although monitoring with a trough level (C0) is common for CNIs, especially tacrolimus, there are reports that the correlativity of C0 and MPA-AUC0–12 h is low,5) and MPA-AUC0–12 h has become a useful index for prediction of clinical effect and rejection compared with C0.6) Subsequently, many limited sampling strategies (LSS) which estimate MPA-AUC0–12 h from the levels of 3 or 4 points have been reported.7–14) However, the results differ according to the patient background or concomitant CNIs, and no clear conclusions have been reached. Furthermore, if the number of blood collection points increases, the mental and physical burden in patients and medical staff will increase. Therefore, in clinical settings, an estimate equation which can predict MPA-AUC0–12 h using the fewest possible blood collection points is desirable. Therefore, we examined LSS using only C0 and two points including C0 in Japanese renal transplant recipients with concomitant extended-release tacrolimus (ER-TAC).
MATERIALS AND METHODS
PatientsAmong the patients who received renal transplantation at Kagawa University Hospital, the subjects of this study were 22 patients for whom we could calculate MPA-AUC0–12 h by the linear trapezoidal rule. The observation period was from February, 2011 through April, 2012. Blood samples were collected immediately before administration and at 1, 2, 4, 6, 8 and 12 h (C0, C1, ···, C12) after administration. All subjects received combined therapy of MMF (Cellcept®, Chugai Pharmaceutical Co., Ltd., Tokyo, Japan) and ER-TAC (Graceptor Capsules®, Astellas Pharma Inc., Tokyo, Japan). Calculation of AUC0–12 h was carried out at pre-transplantation (Tx), 1 month post-Tx, and 3 months post-Tx. In the respective periods, we carried out single regression analysis with MPA-AUC0–12 h as a dependent variable, only C0 as an independent variable and multiple regression analysis (forced entry method) with MPA-AUC0–12 h as a dependent variable, and two points including C0 among C0–C6 as an independent variable. The study, the Sikoku Mycophenolic Acid Pharmacokinetics Study, was approved by the institutional review board of Kagawa University Hospital, and informed consent was obtained from all patients.
MPA AssayPlasma levels of MPA were measured by Viva-E™ System (Siemens Healthcare Diagnostics Inc., Newark, DE, U.S.A.). For reagents, controls and calibrators, the products of this company were used: Emit®2000 Mycophenolic Acid Assay, Emit®2000 Mycophenolic Calibrators, Emit®2000 Mycophenolic Controls, respectively.
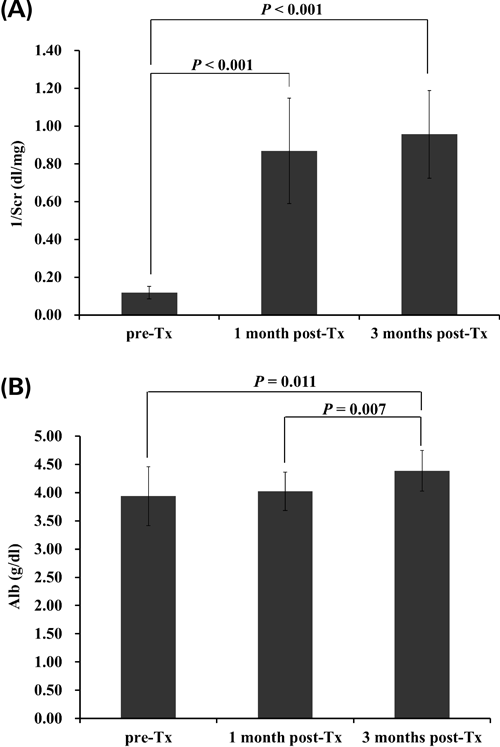
Variable FactorsAs factors which affect the pharmacokinetics of MPA, we focused on changes in renal function and serum albumin (Alb) accompanying transplant progress. A reciprocal of the serum creatinine (1/Scr) was used as an index of renal function. We compared the patient’s Alb and 1/Scr at pre-Tx, 1 month post-Tx and 3 months post-Tx.
StatisticsWe used SPSS Statistics 17.0 (SPSS Inc., Chicago, IL, U.S.A.) for all analyses. Descriptive statistics used were mean±standard deviation for continuous variables, and percentages for categorical variables. The multicollinearity in multiple regression analysis was checked by using a correlation matrix. Games–Howell’s multiple comparison test was used to compare groups. All p-values were two sided, and p≤0.05 was considered significant.
RESULTS
Regression AnalysisPatient Demographics (N=22) and the results of regression analysis are summarized in Tables 1 and 2. At pre-Tx, 1 month post-Tx and 3 months post-Tx, patients for whom we could calculate MPA-AUC0–12 h numbered 20, 21 and 20, respectively. Patients with less than seven blood sampling points were excluded from subjects. Spearman’s rank correlation coefficients in the combination of independent variables were all r≤0.8 regarding multicollinearity in multiple regression analysis. The strength of estimation of MPA-AUC0–12 h tended to be more favorable for the two rather than one time-point method regardless of transplant progress. A model based on C0 and C4 provided the highest estimation of MPA-AUC0–12 h for pre-Tx and 1 month post-Tx. On the other hand, a model based on C0 and C6 provided the highest estimation of MPA-AUC0–12 h for 3 months post-Tx. Furthermore, the estimation of post-Tx showed a tendency towards aggravation compared with pre-Tx. The standard deviation of residual error ranged from 11.1 to 20.5 µg·h/mL.
Table 1. Patient Demographics (
N=22)
| Variable | N | Percentage/mean and S.D. (range) |
|---|
| Age (years) | | 47±15 (22–75) |
| Weight (kg) | | 60±15 (36–90) |
| Gender | | |
| Male | 13 | 59 |
| Female | 9 | 41 |
| Pre-emptive transplantation | 7 | 32 |
| Unrelated donor | 14 | 64 |
| ABO incompatibility | 10 | 45 |
| Positive T-cell FCXM | 4 | 18 |
| Positive B-cell FCXM | 11 | 50 |
| Disease | | |
| Diabetes mellitus | 4 | 18 |
| Glomerulonephritis | 3 | 14 |
| IgA nephropathy | 3 | 14 |
| Hypertensive nephrosclerosis | 2 | 9 |
| Unknown | 6 | 27 |
| Other | 5 | 23 |
S.D., standard deviation; FCXM, flow cytometry crossmatch; IgA, immunoglobulin A.
Table 2. Single and Multiple Regression Analyses (Forced Entry Method) for Estimation of MPA-
AUC0–12 h| Time after Tx | Time point | Equation for estimation of MPA-AUC0–12 h | Adjusted R2 | p | S.D. of residual error |
|---|
| Pre-Tx (N=20) | Trough (0) | 26.78+9.25×C0 | 0.71 | <0.001 | 20.5 |
| 0, 1 h | 22.50+6.64×C0+1.97×C1 | 0.74 | <0.001 | 19.6 |
| 0, 2 h | 20.87+5.94×C0+2.68×C2 | 0.77 | <0.001 | 18.2 |
| 0, 4 h | 20.30+5.80×C0+3.06×C4 | 0.91 | <0.001 | 11.2 |
| 0, 6 h | 2.08+3.68×C0+10.80×C6 | 0.87 | <0.001 | 13.6 |
| 1 month post-Tx (N=21) | 0 | 42.56+5.04×C0 | 0.18 | 0.030 | 13.9 |
| 0, 1 h | 42.52+5.04×C0+0.01×C1 | 0.14 | 0.102 | 14.3 |
| 0, 2 h | 28.08+4.68×C0+1.74×C2 | 0.36 | 0.007 | 12.3 |
| 0, 4 h | 23.37+4.21×C0+3.60×C4 | 0.48 | 0.001 | 11.1 |
| 0, 6 h | 32.27+3.73×C0+3.89×C6 | 0.43 | 0.003 | 11.6 |
| 3 months post-Tx (N=20) | 0 | 33.47+7.80×C0 | 0.32 | 0.006 | 16.7 |
| 0, 1 h | 25.96+6.05×C0+1.67×C1 | 0.48 | 0.002 | 14.6 |
| 0, 2 h | 19.07+7.51×C0+1.60×C2 | 0.46 | 0.002 | 14.9 |
| 0, 4 h | 25.93+6.00×C0+2.70×C4 | 0.38 | 0.007 | 16.0 |
| 0, 6 h | 22.93+4.63×C0+5.60×C6 | 0.60 | <0.001 | 12.8 |
Tx, transplantation; MPA, mycopenolic acid; AUC0–12 h, area under the concentration–time curve from 0 to 12 h; S.D., standard deviation.
The changes in 1/Scr and Alb accompanying transplant progress are summarized in Fig. 1. There was a significant difference in 1/Scr between pre-Tx and 1 month post-Tx and 3 months post-Tx, but no significant difference between 1 month post-Tx and 3 months post-Tx. On the other hand, there was a significant difference in Alb between 3 months post-Tx and pre-Tx and 1 month post-Tx, but no significant difference between pre-Tx and 1 month post-Tx.
DISCUSSION
This study suggests that better estimation of MPA-AUC0–12 h can be obtained by using two points including C0 compared with only C0 regardless of transplant progress. Furthermore, blood collection points showing the highest estimation of MPA-AUC0–12 h by adding to C0 were C4 at pre-Tx and 1 month post-Tx, and C6 at 3 months post-Tx. The LSS of the previous studies measured the MPA concentration at 3 to 4 time-points to estimate the AUC0–12 h. On the other hand, we examined the estimation of the AUC0–12 h based on MPA concentrations at minimum time-points (only 1 to 2 time-points). Compared with previous reports, our estimation may be less accurate, especially in post-Tx. However, judging from the target range of MPA-AUC0–12 h (30–60 µg·h/mL)15) and values of standard deviation of residual error in the present study, it is believed that our estimation equations have clinically applicable accuracy. To determine the clinical utility of our proposed estimation equations, we should carefully evaluate our estimation equations in future clinical studies using engraftment, rejection, and adverse effect endpoints.
On the other hand, the estimation in post-Tx showed a tendency towards aggravation compared with pre-Tx. We focused on changes in the pharmacokinetics of MPA accompanying transplant progress as factors. Renal dysfunction and hypoalbuminemia are known as variable factors.16,17) There was also a significant difference in 1/Scr and Alb between pre-Tx and post-Tx in this study. In particular, since the inter-individual variability of 1/Scr at post-Tx was large compared with pre-Tx, it is assumed that renal function is an aggravating major factor for estimation. Thus, the present results suggest that drug monitoring of MPA is insufficient using only C0 and that it needs to be carried out considering changes in the pharmacokinetics of MPA accompanying transplant progress. However, since cross reactivity is reported with the enzyme multiplied immunoassay technique, a principle of the measurement of Viva-E™,18) for the present study may have found different results from other reports using the HPLC method. In the future, we will examine the estimation of our regression models in another group for clinical application.
In past reports on LSS of MPA, many combined their use with Cyclosporin A or twice-daily tacrolimus.7–14) Hence, the present study in Japanese renal transplant recipients, using a combination with ER-TAC, provides new and useful information for monitoring MPA levels, although estimation of MPA-AUC0–12 h may be slightly inferior to past reports.
Acknowledgment
We appreciate the advice and expertise of Professor Yasuo Shinohara (Institute for Genome Research, The University of Tokushima).
REFERENCES
- 1) Allison AC, Eugui EM. Mycophenolate mofetil and its mechanisms of action. Immunopharmacology, 47, 85–118 (2000).
- 2) Gaston RS, Kaplan B, Shah T, Cibrik D, Shaw LM, Angelis M, Mulgaonkar S, Meier-Kriesche HU, Patel D, Bloom RD. Fixed- or controlled-dose mycophenolate mofetil with standard- or reduced-dose calcineurin inhibitors: the Opticept trial. Am. J. Transplant., 9, 1607–1619 (2009).
- 3) Le Meur Y, Büchler M, Thierry A, Caillard S, Villemain F, Lavaud S, Etienne I, Westeel PF, Hurault de Ligny B, Rostaing L, Thervet E, Szelag JC, Rérolle JP, Rousseau A, Touchard G, Marquet P. Individualized mycophenolate mofetil dosing based on drug exposure significantly improves patient outcomes after renal transplantation. Am. J. Transplant., 7, 2496–2503 (2007).
- 4) van Gelder T, Tedesco Silva H, de Fijter JW, Budde K, Kuypers D, Arns W, Soulillou JP, Kanellis J, Zelvys A, Ekberg H, Holzer H, Rostaing L, Mamelok RD. Renal transplant patients at high risk of acute rejection benefit from adequate exposure to mycophenolic acid. Transplantation, 89, 595–599 (2010).
- 5) van Gelder T, Le Meur Y, Shaw LM, Oellerich M, DeNofrio D, Holt C, Holt DW, Kaplan B, Kuypers D, Meiser B, Toenshoff B, Mamelok RD. Therapeutic drug monitoring of mycophenolate mofetil in transplantation. Ther. Drug Monit., 28, 145–154 (2006).
- 6) Hale MD, Nicholls AJ, Bullingham RE, Hené R, Hoitsma A, Squifflet JP, Weimar W, Vanrenterghem Y, Van de Woude FJ, Verpooten GA. The pharmacokinetic–pharmacodynamic relationship for mycophenolate mofetil in renal transplantation. Clin. Pharmacol. Ther., 64, 672–683 (1998).
- 7) Barraclough KA, Isbel NM, Johnson DW, Hawley CM, Lee KJ, McWhinney BC, Ungerer JP, Campbell SB, Leary DR, Staatz CE. A limited sampling strategy for the simultaneous estimation of tacrolimus, mycophenolic acid and unbound prednisolone exposure in adult kidney transplant recipients. Nephrology (Carlton), 17, 294–299 (2012).
- 8) Kuypers DR, Claes K, Evenepoel P, Maes B, Coosemans W, Pirenne J, Vanrenterghem Y. Long-term changes in mycophenolic acid exposure in combination with tacrolimus and corticosteroids are dose dependent and not reflected by trough plasma concentration: a prospective study in 100 de novo renal allograft recipients. J. Clin. Pharmacol., 43, 866–880 (2003).
- 9) Le Guellec C, Büchler M, Giraudeau B, Le Meur Y, Gakoué JE, Lebranchu Y, Marquet P, Paintaud G. Simultaneous estimation of cyclosporin and mycophenolic acid areas under the curve in stable renal transplant patients using a limited sampling strategy. Eur. J. Clin. Pharmacol., 57, 805–811 (2002).
- 10) Miura M, Satoh S, Niioka T, Kagaya H, Saito M, Hayakari M, Habuchi T, Suzuki T. Limited sampling strategy for simultaneous estimation of the area under the concentration–time curve of tacrolimus and mycophenolic acid in adult renal transplant recipients. Ther. Drug Monit., 30, 52–59 (2008).
- 11) Pawinski T, Hale M, Korecka M, Fitzsimmons WE, Shaw LM. Limited sampling strategy for the estimation of mycophenolic acid area under the curve in adult renal transplant patients treated with concomitant tacrolimus. Clin. Chem., 48, 1497–1504 (2002).
- 12) Teshima D, Maiguma T, Kaji H, Otsubo K, Kitagawa N, Okabe Y, Sugitani A, Tanaka M, Oishi R. Estimation of the area under the curve for mycophenolic acid in adult renal transplant patients with concomitant tacrolimus using a limited sampling strategy. J. Clin. Pharm. Ther., 33, 159–163 (2008).
- 13) Schütz E, Armstrong VW, Shipkova M, Weber L, Niedmann PD, Lammersdorf T, Wiesel M, Mandelbaum A, Zimmerhackl LB, Mehls O, Tönshoff B, Oellerich M, German Study Group on MMF Therapy in Pediatric Renal Transplant Recipients. Limited sampling strategy for the determination of mycophenolic acid area under the curve in pediatric kidney recipients. Transplant. Proc., 30, 1182–1184 (1998).
- 14) Yeung S, Tong KL, Tsang WK, Tang HL, Fung KS, Chan HW, Chan AY, Chan L. Determination of mycophenolate area under the curve by limited sampling strategy. Transplant. Proc., 33, 1052–1053 (2001).
- 15) Mourad M, Malaise J, Chaib Eddour D, De Meyer M, König J, Schepers R, Squifflet JP, Wallemacq P. Pharmacokinetic basis for the efficient and safe use of low-dose mycophenolate mofetil in combination with tacrolimus in kidney transplantation. Clin. Chem., 47, 1241–1248 (2001).
- 16) Johnson AG, Rigby RJ, Taylor PJ, Jones CE, Allen J, Franzen K, Falk MC, Nicol D. The kinetics of mycophenolic acid and its glucuronide metabolite in adult kidney transplant recipients. Clin. Pharmacol. Ther., 66, 492–500 (1999).
- 17) Naesens M, de Loor H, Vanrenterghem Y, Kuypers DR. The impact of renal allograft function on exposure and elimination of mycophenolic acid (MPA) and its metabolite MPA 7-O-glucuronide. Transplantation, 84, 362–373 (2007).
- 18) Oellerich M, Shipkova M, Schütz E, Wieland E, Weber L, Tönshoff B, Armstrong VW. German Study Group on Mycophenolate Mofetil Therapy in Pediatric Renal Transplant Recipients. Pharmacokinetic and metabolic investigations of mycophenolic acid in pediatric patients after renal transplantation: implications for therapeutic drug monitoring. Ther. Drug Monit., 22, 20–26 (2000).