Review
Total Purine and Purine Base Content of Common Foodstuffs for Facilitating Nutritional Therapy for Gout and Hyperuricemia
2014 Volume 37 Issue 5 Pages 709-721

Details
2014 Volume 37 Issue 5 Pages 709-721
Purines are natural substances found in all of the body’s cells and in virtually all foods. In humans, purines are metabolized to uric acid, which serves as an antioxidant and helps to prevent damage caused by active oxygen species. A continuous supply of uric acid is important for protecting human blood vessels. However, frequent and high intake of purine-rich foods reportedly enhances serum uric acid levels, which results in gout and could be a risk factor for cardiovascular disease, kidney disease, and metabolic syndrome. In Japan, the daily intake of dietary purines is recommended to be less than 400 mg to prevent gout and hyperuricemia. We have established an HPLC method for purine analysis and determined purines in a total of 270 foodstuffs. A relatively small number of foods contained concentrated amounts of purines. For the most part, purine-rich foods are also energy-rich foods, and include animal meats, fish meats, organs such as the liver and fish milt, and yeast. When the ratio of the four purine bases (adenine, guanine, hypoxanthine, and xanthine) was compared, two groups of foods were identified: one that contained mainly adenine and guanine and one that contained mainly hypoxanthine. For patients with gout and hyperuricemia, the amount of total purines and the types of purines consumed, particularly hypoxanthine, are important considerations. In this context, the data from our analysis provide a purine content reference, and thereby clinicians and patients could utilize that reference in nutritional therapy for gout and hyperuricemia.
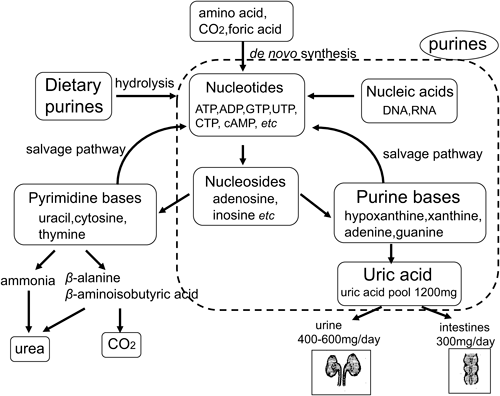
Dietary purines, including nucleotides, nucleosides and bases, are reported to be absorbed as their corresponding nucleosides or bases and are then utilized through the purine metabolic pathway (Fig. 1). The end product of purine metabolism is uric acid and the increase of serum uric acid level causes gout and hyperuricemia.1–3) Gout and hyperuricemia are therefore considered to be lifestyle-related diseases.4–6) Patients with gout and hyperuricemia tend to have consumed a large amount of meat or giblets over many years.7) During the last 10 years, epidemiological surveys have revealed an association between the intake of purine-rich food and the serum concentration of uric acid,8,9) which is higher in individuals who regularly consume large quantities of purine-rich foods than in those who consume less. Moreover, an association between the intake of these foods and the risk of gout has also been reported.10,11) A higher consumption of meat and seafood is reportedly associated with an increased gout risk. Acute purine intake also increases the risk of recurrent gout attacks by almost fivefold.12)
With the realization that hyperuricemia and gout are related to excessive intake of purine-rich foods, education and proper guidance is considered to be important. In the guidelines for the management of hyperuricemia and gout in Japan, specific details for lifestyle guidance are included.13) In nutritional therapy, it is recommended that the amount of dietary purines should be less than 400 mg per day. Guidelines for hyperuricemia and gout are also given in the United States and the United Kingdom.14–16)
Although there have been several reports investigating the effects of food on purine metabolism and the serum concentration of uric acid,2,17–20) only a few have reported both the amounts of the four purine bases and the total amount of purines in foodstuffs.21,22) There are several reports on purine content in foodstuffs, but these reports are written in Japanese or in German and are not highly cited.23–29) We previously established a method to determine the purine base and total purine content of alcoholic beverages.30) We applied this method to several vegetables and mushrooms,22) and determined the purine base and total purine content of many foodstuffs.23,28,29) We recently refined this technique to enable the detection of very small amounts of purines in alcoholic beverages.31)
In the present review, we add our latest data and summarize the amount of total purines as well as the four individual purine bases in various foodstuffs, as determined by high-performance liquid chromatography (HPLC). We also calculated the ratio of adenine, guanine or hypoxanthine to the total purine in these foods, and discussed the association with the risk of gout.
The protocol of purine analysis in foodstuffs is shown in Fig. 2.

Foodstuffs were purchased from several supermarkets. For several types of food, the effect of heating on purine content was examined. Heating of foodstuffs was performed by boiling in hot water, steaming in a steamer, or frying in a frying pan.
Each foodstuff was divided into several parts and weighed. Two or three pieces of the same foodstuff of similar weight were homogenized with a Polytron homogenizer PT3100 (Kimematica AG, Littau-Lucerne, Switzerland) at 12000 rpm on ice and frozen before lyophilization. After lyophilization, 30 mL of 70% perchloric acid was added, and the solution was heated at 95°C with stirring for 60 min. This converted the nucleic acids, nucleosides, and nucleotides to corresponding purine bases by hydrolysis. A portion of the hydrolyzed sample solution was neutralized and centrifuged, and then aliquots were injected into the HPLC system.22,28–30)
2.2. HPLCHPLC was performed under the following conditions: instrument, Shimadzu LC10A HPLC system with autoinjector SIL-10AD (Kyoto, Japan); column, Shodex Asahipak GS-320HQ (7.6 mm i.d. and 300 mm length) (Tokyo, Japan); mobile phase, 150 mM sodium phosphate buffer (pH 2.5–2.8); flow rate, 0.6 mL/min; column temperature, 35°C; and detector wavelength, 260 nm.22,28–30) The measurement of adenine, guanine, hypoxanthine, and xanthine was performed in duplicate.
Purine bases (adenine, guanine, hypoxanthine, xanthine, and uric acid) were completely separated by HPLC and their detection limits were 0.05–0.2 ng (Fig. 2).
2.3. Peak-Shift Assay with Enzyme TreatmentTo eliminate interference from other metabolic compounds, a comparison with or without enzyme treatment was performed. Xanthine oxidase is an enzyme that oxidizes hypoxanthine, xanthine, adenine, and guanine, and guanase is an enzyme that converts guanine to xanthine. Each aliquot of the food samples was therefore treated with xanthine oxidase and guanase before HPLC analysis.22,28–31) The content of purine bases was determined as the mean of two or three experiments. As shown in Figs. 3 and 4, after undergoing enzymatic treatment to identify purine base peaks, the amount of each of the four purine bases except uric acid was determined exactly.

The purine peaks are indicated with arrows. A: Adenine; G: Guanine; HX: Hypoxanthine; X: Xanthine. A′, G′, HX′, X′: Adenine, guanine, hypoxanthine, and xanthine, respectively, were oxidized and the peaks disappeared.

The peaks of guanine and xanthine are indicated with arrows. G: Guanine; X: Xanthine. G′: Guanine was deaminated and the peak disappeared. Xanthine was generated from guanine by the action of guanase.
The total purine content was calculated from the combined amounts of adenine, guanine, hypoxanthine, and xanthine. The calculated uric acid value represents the amount of uric acid produced in the body when ingested food is absorbed and metabolized in the purine metabolic pathway. Calculated amount as uric acid (mg/100 g) was given after multiplying the molecular weight of uric acid (168.1) by total purine amount (µmol/100 g) and dividing by 1000.
Total purine and purine base content of 8 cereals, 5 beans, 10 soybean products, 5 seaweeds, 2 eggs, 4 dairy products, 22 mushrooms, 2 fruits, 38 vegetables (separate parts), 43 meats (separate parts), 9 processed meats, 36 fish (separate parts), 9 fish roe or milt, 24 shellfish or mollusks, 8 dried or half-dried fish, 2 canned fish, 8 processed fish, 3 snacks, 17 seasonings, and 15 supplements are shown in Tables 1 to 8.
The amount of total purines was classified into five groups, the very low group: <50 mg/100 g, the low group: 50–100 mg/100 g, the moderate group: 100–200 mg/100 g, the high group: 200–300 mg/100 g, and the very high group: >300 mg/100 g. We determined considerable number of dried or half-dried food. When the dried food cannot be eaten without cooking, it is not classified into the high or very high group even if the appearance value of purine was high. In such food, the amount of purines increases from the corresponding raw value because the weight of foodstuffs is lighter following moisture evaporation than in its raw state.
3.2. Amount of Purines in Cereals, Beans, Soybean Products, and Dried SeaweedsTable 1 shows that most of the cereals, beans, and soybean products contained less than 50 mg/100 g purines. Dried soybean contained higher amounts of purines than other beans at 172.5 mg/100 g, although raw soybean (green soybean) had a much lower amount at 47.9 mg/100 g (very low group). Soybean products including tofu and soymilk contained less than 50 mg/100 g purines except for fermented soybeans (natto).
| (mg/100 g) | ||||||||
|---|---|---|---|---|---|---|---|---|
| Foodstuffs | Part | Adenine | Guanine | Hypoxanthine | Xanthine | Total | Calculated as uric acid | Classified group # |
| Cereals | ||||||||
| Barley | 21.6 | 22.7 | 0.0 | 0.0 | 44.3 | 52.1 | 1 | |
| Buckwheat flour | 35.1 | 40.8 | 0.0 | 0.0 | 75.9 | 89.1 | 2 | |
| Flour (bread flour) | 12.2 | 13.6 | 0.0 | 0.0 | 25.8 | 30.3 | 1 | |
| Flour (cake flour) | 8.1 | 7.6 | 0.0 | 0.0 | 15.7 | 18.5 | 1 | |
| Flour (pastry flour) | 12.2 | 13.6 | 0.0 | 0.0 | 25.8 | 30.3 | 1 | |
| Rice (polished) | 10.8 | 15.1 | 0.0 | 0.0 | 25.9 | 30.3 | 1 | |
| Rice (unpolished) | 16.2 | 21.2 | 0.0 | 0.0 | 37.4 | 43.7 | 1 | |
| Rice (with the bud) | 14.9 | 19.6 | 0.0 | 0.0 | 34.5 | 40.3 | 1 | |
| Beans | ||||||||
| Almond | 13.6 | 13.8 | 2.3 | 1.7 | 31.4 | 37.0 | 1 | |
| Azuki bean (dried) | 33.8 | 43.8 | 0.0 | 0.0 | 77.6 | 90.8 | 2* | |
| Broad bean | 14.1 | 19.9 | 1.3 | 0.2 | 35.5 | 41.5 | 1 | |
| Green-peas (canned) | 6.8 | 12.1 | 0.0 | ND | 18.8 | 21.9 | 1 | |
| Peanut | 18.9 | 28.6 | 0.0 | 1.6 | 49.1 | 57.1 | 1 | |
| Soybean products | ||||||||
| Bean curd lees (Okara) | 15.0 | 24.0 | 4.5 | 5.0 | 48.6 | 56.6 | 1 | |
| Deep-fried tofu | 20.3 | 32.4 | 0.5 | 1.2 | 54.4 | 63.2 | 2 | |
| Fermented soybean (Natto) | 40.5 | 51.4 | 6.8 | 15.2 | 113.9 | 132.8 | 3 | |
| Freeze-dried tofu | 120.4 | 168.3 | 0.6 | 3.7 | 293.1 | 342.0 | 4* | |
| Green soybean | 20.8 | 27.2 | 0.0 | 0.0 | 47.9 | 56.1 | 1 | |
| Soymilk | 7.7 | 11.7 | 2.5 | 0.0 | 22.0 | 25.8 | 1 | |
| Soybean (dried) | 74.3 | 98.2 | 0.0 | 0.0 | 172.5 | 201.7 | 3* | |
| Tofu (Kinu) | 7.6 | 11.2 | 0.5 | 0.7 | 20.0 | 23.3 | 1 | |
| Tofu (Momen, chilled) | 14.0 | 16.7 | 0.4 | 0.0 | 31.1 | 36.5 | 1 | |
| Tofu (Momen, 3 min boiled) | 13.1 | 8.8 | 0.0 | 0.0 | 21.9 | 26.0 | 1 | |
| Dried seaweeds | ||||||||
| Cladosiphon okamuranus (Mozuku) | 5.6 | 9.4 | 0.5 | 0.0 | 15.4 | 18.0 | 1 | |
| Hijiki | 31.1 | 76.5 | 25.1 | 0.0 | 132.8 | 154.9 | 3* | |
| Kombu | 18.0 | 21.8 | 4.7 | 1.9 | 46.4 | 54.5 | 1 | |
| Nori | 216.0 | 299.2 | 73.3 | 3.2 | 591.7 | 695.6 | 5* | |
| Wakame | 67.7 | 148.1 | 46.6 | 0.0 | 262.4 | 306.5 | 4* | |
#: Classification according to purine content; 1: the very low group: less than 50 mg/100 g (less than 350 µmol/100 g), 2: the low group: 50–100 mg/100 g (350–700 µmol/100 g), 3: the moderate group: 100–200 mg/100 g (700–1400 µmol/100 g), 4: the high group: 200–300 mg/100 g (1400–2050 µmol/100 g), 5: the very high group: more than 300 mg/100 g (more than 2050 µmol/100 g). The dried food that cannot be eaten without cooking is demonstrated with asterisk. ND: not detected.
Seaweeds were all dried. Although wakame and nori had high purine values, they were dried and very light, and a little amount is used during cooking. Thus, seaweeds were not considered to be foodstuffs affecting serum uric acid level.
All cereals, beans, soybean products, and seaweeds contained >60% of their total purines as adenine and guanine.
3.3. Amount of Purines in Eggs, Dairy Products, Mushrooms, and FruitsEggs and dairy products contained almost no purine or less than 13 mg/100 g (Table 2). Most mushrooms, except for dried shiitake and hiratake, contained 6.9–98.5 mg/100 g purines, so they were classified in the low or very low group. Dried shiitake contained more than 240 mg/100 g purines. It is thought that the amount of purine became larger because purines in mushroom was condensed and the weight became light by drying. Purine content in 2 fruits, namely, banana and strawberry, was very low at 2.1 and 3.0 mg/100 g, respectively.
| (mg/100 g) | ||||||||
|---|---|---|---|---|---|---|---|---|
| Foodstuffs | Part | Adenine | Guanine | Hypoxanthine | Xanthine | Total | Calculated as uric acid | Classified group # |
| Eggs | ||||||||
| Chicken egg | 0.0 | ND | 0.0 | 0.0 | 0.0 | 0.0 | 1 | |
| Quail egg | 0.0 | ND | 0.0 | ND | 0.0 | 0.0 | 1 | |
| Dairy products | ||||||||
| Cheese | 2.7 | 3.0 | 0.0 | 0.0 | 5.7 | 6.7 | 1 | |
| Grated cheese | 8.2 | 4.2 | ND | 0.6 | 12.9 | 15.4 | 1 | |
| Milk | 0.0 | 0.0 | 0.0 | 0.0 | 0.0 | 0.0 | 1 | |
| Yogurt | 1.4 | 2.1 | 1.5 | 0.2 | 5.2 | 6.2 | 1 | |
| Mushrooms | ||||||||
| Bunapii | 12.2 | 12.3 | 3.2 | 3.0 | 30.8 | 36.2 | 1 | |
| Bunashimeji | 9.4 | 8.0 | 1.1 | 2.3 | 20.8 | 24.6 | 1 | |
| Enokidake | 29.7 | 19.6 | 0.0 | 0.0 | 49.4 | 58.8 | 1 | |
| Eringi | 5.0 | 5.3 | 0.7 | 2.4 | 13.4 | 15.7 | 1 | |
| Hatakeshimeji | 9.1 | 5.7 | 0.7 | 0.5 | 16.0 | 19.1 | 1 | |
| Hiratake | 74.3 | 68.0 | 0.0 | 0.0 | 142.3 | 168.1 | 3 | |
| Jew’s-ear (dried) | 54.8 | 93.0 | 7.9 | 0.0 | 155.7 | 181.4 | 3* | |
| Maitake | 47.4 | 38.9 | 7.9 | 4.4 | 98.5 | 116.7 | 2 | |
| Nameko | 14.9 | 13.6 | ND | 0.0 | 28.5 | 33.6 | 1 | |
| Nameko (big type) | 3.8 | 2.9 | 1.4 | 1.3 | 9.5 | 11.2 | 1 | |
| Shiitake (dried) | 202.7 | 167.7 | 0.0 | 9.1 | 379.5 | 448.8 | 5* | |
| Shiitake (for Broth, dried) | 132.5 | 97.8 | 11.5 | 0.5 | 242.3 | 288.4 | 4* | |
| Shiitake (raw) | 8.3 | 10.0 | 1.6 | 0.9 | 20.8 | 24.4 | 1 | |
| Shiitake No. 115 (raw) | 5.5 | 7.6 | 0.5 | 2.1 | 15.6 | 18.2 | 1 | |
| Shiitake No. 240 (raw) | 10.6 | 11.0 | 4.5 | 0.0 | 26.1 | 31.0 | 1 | |
| Shiitake No. 697 (raw) | 9.9 | 12.5 | 6.1 | 1.0 | 29.5 | 34.9 | 1 | |
| Tsukuritake | 28.4 | 21.2 | 0.0 | 0.0 | 49.5 | 58.8 | 1 | |
| Usu-hiratake | 16.8 | 15.7 | 1.9 | 3.5 | 37.9 | 44.6 | 1 | |
| White aragekikurage | 2.3 | 4.1 | 0.4 | 0.1 | 6.9 | 8.0 | 1 | |
| White hiratake | 27.0 | 32.8 | 2.6 | 4.3 | 66.7 | 78.1 | 2 | |
| Yamabushitake | 12.1 | 20.7 | 0.7 | 0.0 | 33.5 | 38.9 | 1 | |
| Yanagimatsutake | 6.1 | 11.9 | 4.9 | 3.3 | 26.2 | 30.5 | 1 | |
| Fruits | ||||||||
| Banana | 1.2 | 1.7 | 0.1 | 0.0 | 3.0 | 3.5 | 1 | |
| Strawberry | 0.5 | 1.2 | 0.5 | 0.0 | 2.1 | 2.4 | 1 | |
#: Classification according to purine content; 1: the very low group: less than 50 mg/100 g (less than 350 µmol/100 g), 2: the low group: 50–100 mg/100 g (350–700 µmol/100 g), 3: the moderate group: 100–200 mg/100 g (700–1400 µmol/100 g), 4: the high group: 200–300 mg/100 g (1400–2050 µmol/100 g), 5: the very high group: more than 300 mg/100 g (more than 2050 µmol/100 g). The dried food that cannot be eaten without cooking is demonstrated with asterisk. ND: not detected.
All dairy products and mushrooms contained more than 60% of their total purines as adenine and guanine.
3.4. Amount of Purines in VegetablesThe amount of purines in vegetables is shown in Table 3. About 70% of vegetables contained less than 50 mg/100 g purines, thus they were classified in the very low group. However, 13 of 38 vegetables contained more than 50 mg/100 g purines. Parsley contained 288.9 mg/100 g of total purines. As with seaweed, parsley is used in only small amounts (at most 2 g) in cooking or as a garnish, so the amount of purine derived from parsley consumption will be limited.
All vegetables contained >60% of their total purines as adenine and guanine.
| (mg/100 g) | ||||||||
|---|---|---|---|---|---|---|---|---|
| Foodstuffs | Part | Adenine | Guanine | Hypoxanthine | Xanthine | Total | Calculated as uric acid | Classified group # |
| Asparagus | Upper part | 20.7 | 30.5 | 3.8 | 0.3 | 55.3 | 64.7 | 2 |
| Asparagus | Lower part | 3.6 | 4.8 | 1.7 | 0.1 | 10.2 | 12.0 | 1 |
| Avocado | 10.6 | 7.5 | 0.3 | 0.0 | 18.4 | 21.8 | 1 | |
| Balsam pear (goya) | 3.5 | 4.3 | 1.1 | 1.0 | 9.9 | 11.6 | 1 | |
| Bamboo shoot | Upper part | 24.8 | 35.2 | 2.8 | 0.6 | 63.3 | 74.0 | 2 |
| Bamboo shoot | Lower part | 12.8 | 17.0 | 0.7 | 0.4 | 30.8 | 36.1 | 1 |
| Bean sprouts | 14.1 | 14.2 | 3.2 | 3.5 | 35.0 | 41.2 | 1 | |
| Broccoli | 25.1 | 33.9 | 5.7 | 5.3 | 70.0 | 81.8 | 2 | |
| Broccoli sprout | 59.5 | 57.2 | 8.1 | 4.8 | 129.6 | 153.0 | 3 | |
| Cabbage | 1.3 | 1.7 | 0.2 | 0.0 | 3.2 | 3.8 | 1 | |
| Carrot | 0.7 | 1.4 | 0.0 | 0.0 | 2.2 | 2.5 | 1 | |
| Cauliflower | 27.0 | 30.2 | ND | 0.0 | 57.2 | 67.2 | 2 | |
| Cherry tomato | 1.6 | 1.5 | 0.0 | 0.0 | 3.1 | 3.7 | 1 | |
| Chinese cabbage | 2.6 | 2.9 | 1.2 | 0.3 | 7.0 | 8.2 | 1 | |
| Corn | 4.7 | 6.9 | 0.1 | 0.1 | 11.7 | 13.7 | 1 | |
| Cucumber | 4.2 | 5.0 | 0.1 | 0.1 | 9.4 | 11.1 | 1 | |
| Eggplant | 11.0 | 31.6 | 6.6 | 1.6 | 50.7 | 58.7 | 2 | |
| Garlic | 6.0 | 6.9 | 3.4 | 0.7 | 17.0 | 20.1 | 1 | |
| Garlic chives (nira) | 9.4 | 8.5 | 1.4 | 0.1 | 19.4 | 23.0 | 1 | |
| Ginger | 0.4 | 1.4 | 0.0 | 0.5 | 2.3 | 2.5 | 1 | |
| Green pepper | 15.9 | 35.5 | 7.0 | 10.7 | 69.2 | 79.8 | 2 | |
| Gumbo (okura) | 17.2 | 21.3 | 0.3 | 0.7 | 39.5 | 46.3 | 1 | |
| Japanese ginger (myoga) | 3.1 | 3.5 | 0.7 | 0.4 | 7.8 | 9.2 | 1 | |
| Japanese leek (negi) | 12.0 | 26.8 | 2.6 | 0.0 | 41.4 | 48.0 | 1 | |
| Japanese pumpkin | 23.2 | 29.1 | 1.9 | 2.5 | 56.6 | 66.3 | 2 | |
| Komatsuna | Leaf | 4.2 | 6.3 | 0.0 | 0.0 | 10.6 | 12.3 | 1 |
| Komatsuna | Young leaf | 13.0 | 24.7 | 0.0 | 1.4 | 39.0 | 45.1 | 1 |
| Onion | 1.0 | 1.1 | 0.1 | 0.0 | 2.3 | 2.7 | 1 | |
| Parsley | 121.5 | 135.1 | 32.3 | 0.0 | 288.9 | 341.3 | 4 | |
| Perilla leaves (shiso) | 19.1 | 19.1 | 3.1 | 0.2 | 41.4 | 49.0 | 1 | |
| Potato | 2.1 | 4.2 | 0.2 | 0.0 | 6.5 | 7.5 | 1 | |
| Spinach | Leaf | 29.8 | 13.8 | 0.0 | 7.7 | 51.4 | 61.0 | 2 |
| Spinach | Young leaf | 83.5 | 88.3 | 0.0 | 0.0 | 171.8 | 202.1 | 3 |
| Sprouts (with bean) | 28.1 | 28.2 | 0.0 | 1.1 | 57.3 | 67.4 | 2 | |
| Sweet potato | 6.7 | 7.3 | 2.4 | 0.6 | 17.0 | 20.1 | 1 | |
| White radish sprouts | 33.9 | 29.4 | 6.4 | 3.5 | 73.2 | 86.6 | 2 | |
| Zucchini | 5.0 | 6.3 | 1.0 | 0.8 | 13.1 | 15.3 | 1 | |
The purine contents of animal meats are shown in Table 4. All raw meat contained more than 50 mg/100 g purines, and 60% of raw meat contained more than 100 mg/100 g. Many types of animal meat were classified in the moderate group. Chicken liver contained a very large amount of purine (312.2 mg/100 g), and beef liver and pork liver contained high amounts of purines, at 219.8 and 284.8 mg/100 g, respectively. The amount of uric acid produced in the body following the ingestion of 100 g of these giblets was estimated to be 256–363 mg, a considerable amount of purines. Purine content in processed meats was 45.5–138.3 mg/100 g (Table 4).
| (mg/100 g) | ||||||||
|---|---|---|---|---|---|---|---|---|
| Foodstuffs | Part | Adenine | Guanine | Hypoxanthine | Xanthine | Total | Calculated as uric acid | Classified group # |
| Meat | ||||||||
| Beef | Brisket | 13.5 | 7.6 | 49.0 | 9.1 | 79.2 | 95.8 | 2 |
| Clod | 18.9 | 9.1 | 65.3 | 10.6 | 104.0 | 126.1 | 3 | |
| Heart | 45.9 | 27.2 | 96.6 | 15.2 | 185.0 | 223.6 | 3 | |
| Kidney | 67.6 | 63.5 | 8.2 | 35.0 | 174.2 | 203.4 | 3 | |
| Large intestine | 27.1 | 38.6 | 15.2 | 7.3 | 88.0 | 103.3 | 2 | |
| Liver | 86.5 | 83.1 | ND | 50.2 | 219.8 | 255.5 | 4 | |
| Neck | 18.9 | 13.6 | 54.4 | 13.7 | 100.6 | 121.0 | 3 | |
| Ribloin | 13.5 | 7.6 | 39.5 | 13.7 | 74.2 | 89.1 | 2 | |
| Shin | 17.6 | 13.6 | 58.5 | 16.7 | 106.4 | 127.8 | 3 | |
| Shoulder ribs | 14.9 | 9.1 | 36.7 | 16.7 | 77.4 | 92.5 | 2 | |
| Shoulder sirloin | 16.2 | 9.1 | 55.8 | 9.1 | 90.2 | 109.3 | 2 | |
| Stomach | 28.4 | 21.2 | 17.7 | 16.7 | 83.9 | 99.2 | 2 | |
| Tenderloin | 16.2 | 9.1 | 64.0 | 9.1 | 98.4 | 119.4 | 2 | |
| Tongue | 24.3 | 12.1 | 44.9 | 9.1 | 90.4 | 109.3 | 2 | |
| Topside | 18.9 | 10.6 | 72.1 | 9.1 | 110.8 | 134.5 | 3 | |
| Topside (raw) | 20.3 | 15.1 | 77.3 | 22.5 | 135.2 | 162.4 | 3 | |
| Topside (heated) | 27.1 | 15.8 | 87.2 | 13.3 | 143.5 | 173.8 | 3 | |
| Chicken | Breast | 20.5 | 21.4 | 98.4 | 1.0 | 141.2 | 171.8 | 3 |
| Buttocks | 17.0 | 21.9 | 23.2 | 6.7 | 68.8 | 81.6 | 2 | |
| Gizzard | 45.9 | 51.4 | 39.5 | 6.1 | 142.9 | 169.8 | 3 | |
| Heart | 31.3 | 36.1 | 52.6 | 5.4 | 125.4 | 150.0 | 3 | |
| Leg | 27.0 | 19.6 | 76.2 | 0.0 | 122.9 | 149.6 | 3 | |
| Liver | 121.6 | 151.1 | ND | 39.5 | 312.2 | 363.1 | 5 | |
| Skin | 48.6 | 43.8 | 27.2 | ND | 119.7 | 142.9 | 3 | |
| White meat | 27.0 | 16.6 | 110.2 | 0.0 | 153.9 | 188.3 | 3 | |
| Wing | 28.4 | 16.6 | 92.5 | 0.0 | 137.5 | 168.1 | 3 | |
| Horse | 10.0 | 10.0 | 77.8 | 15.2 | 113.1 | 136.5 | 3 | |
| Mutton | Mutton | 17.6 | 10.6 | 68.1 | ND | 96.2 | 117.7 | 2 |
| Rum | 17.6 | 10.6 | 65.3 | ND | 93.5 | 114.3 | 2 | |
| Pork | Heart | 39.2 | 24.2 | 55.8 | 0.0 | 119.2 | 144.6 | 3 |
| Kidney | 64.8 | 77.1 | 53.1 | 0.0 | 195.0 | 232.0 | 3 | |
| Liver | 81.1 | 102.7 | 34.0 | 66.9 | 284.8 | 331.2 | 4 | |
| Neck | 14.9 | 12.1 | 43.6 | 0.0 | 70.5 | 85.7 | 2 | |
| Ribs | 13.5 | 10.6 | 51.7 | 0.0 | 75.8 | 92.5 | 2 | |
| Rump | 20.3 | 15.1 | 77.6 | 0.0 | 113.0 | 137.8 | 3 | |
| Shoulder | 16.2 | 12.1 | 53.1 | 0.0 | 81.4 | 99.2 | 2 | |
| Shoulder ribs | 16.2 | 10.6 | 64.0 | 0.0 | 90.8 | 110.9 | 2 | |
| Shoulder sirloin | 18.9 | 13.6 | 62.6 | 0.0 | 95.1 | 116.0 | 2 | |
| Shoulder knee | 21.6 | 16.6 | 69.4 | 0.0 | 107.6 | 131.1 | 3 | |
| Sirloin | 17.6 | 12.1 | 61.2 | 0.0 | 90.9 | 110.9 | 2 | |
| Tenderloin | 23.0 | 15.1 | 81.7 | 0.0 | 119.7 | 146.2 | 3 | |
| Tongue | 24.3 | 21.2 | 58.5 | 0.0 | 104.0 | 126.1 | 3 | |
| Whale | Meat | 18.9 | 12.1 | 80.3 | ND | 111.3 | 136.2 | 3 |
| Tail meat | 13.5 | 6.0 | 68.1 | ND | 87.6 | 107.6 | 2 | |
| Processed meat | ||||||||
| Bacon | 12.2 | 6.0 | 43.6 | ND | 61.8 | 75.6 | 2 | |
| Boneless ham | 10.8 | 7.6 | 55.8 | 0.0 | 74.2 | 90.8 | 2 | |
| Corned beef | 8.1 | 6.0 | 31.3 | 1.5 | 47.0 | 57.2 | 1 | |
| Frankfurt sausage | 8.1 | 7.6 | 32.7 | 1.5 | 49.8 | 60.5 | 1 | |
| Liver paste | 25.7 | 30.2 | 15.0 | 9.1 | 80.0 | 94.1 | 2 | |
| Pressed ham | 8.1 | 4.5 | 51.7 | 0.0 | 64.4 | 79.0 | 2 | |
| Prosciutto (Parma ham) | 23.4 | 22.8 | 92.1 | 0.0 | 138.3 | 168.2 | 3 | |
| Salami | 16.2 | 13.6 | 83.0 | 7.6 | 120.4 | 146.2 | 3 | |
| Vienna sausage | 6.8 | 6.0 | 32.7 | ND | 45.5 | 55.5 | 1 | |
#: Classification according to purine content; 1: the very low group: less than 50 mg/100 g (less than 350 µmol/100 g), 2: the low group: 50–100 mg/100 g (350–700 µmol/100 g), 3: the moderate group: 100–200 mg/100 g (700–1400 µmol/100 g), 4: the high group: 200–300 mg/100 g (1400–2050 µmol/100 g), 5: the very high group: more than 300 mg/100 g (more than 2050 µmol/100 g). ND: not detected.
Most animal meat and processed meat items, except giblets, contained a high ratio of hypoxanthine (from 50.8% for beef tongue to 80.9% for pressed ham). However, liver, kidney, and stomach contained mainly adenine and guanine as 59.3–90.7% of their total purines.
3.6. Amount of Purines in Fresh FishThe purine content in fish is shown in Table 5. About 90% of raw fish contained >100 mg/100 g of purines. Bonito and sardine contained 211.4 and 210.4 mg/100 g, respectively, and were classified as foods with a large amount of purine (more than 200 mg/100 g). The steamed liver of monkfish contained a very high amount of purine (399.2 mg/100 g), which was presumably condensed by steaming.
| (mg/100 g) | ||||||||
|---|---|---|---|---|---|---|---|---|
| Foodstuffs | Part | Adenine | Guanine | Hypoxanthine | Xanthine | Total | Calculated as uric acid | Classified group # |
| Arabesque greenling | 18.9 | 34.0 | 94.7 | 2.4 | 150.0 | 181.0 | 3 | |
| Ayu | 17.6 | 25.7 | 89.8 | 0.0 | 133.1 | 161.4 | 3 | |
| Barracuda | 13.5 | 24.2 | 110.2 | ND | 147.9 | 179.9 | 3 | |
| Bastard halibut | 17.6 | 15.1 | 100.7 | 0.0 | 133.4 | 163.1 | 3 | |
| Bonito | 21.6 | 19.6 | 170.1 | 0.0 | 211.4 | 258.9 | 4 | |
| Carp | 16.2 | 12.1 | 74.9 | ND | 103.2 | 126.1 | 3 | |
| Chub mackerel | 13.5 | 10.6 | 98.0 | 0.0 | 122.1 | 149.6 | 3 | |
| Fat greenling | 20.3 | 13.6 | 95.3 | ND | 129.1 | 158.0 | 3 | |
| Flying fish | 13.5 | 22.7 | 118.4 | 0.0 | 154.6 | 188.3 | 3 | |
| Gnomefish | Meat | 14.6 | 15.3 | 120.1 | 0.8 | 150.8 | 184.4 | 3 |
| Gnomefish | Skin | 9.6 | 296.7 | 73.5 | 2.5 | 382.3 | 435.5 | 5 |
| Herring | 13.5 | 22.7 | 103.4 | ND | 139.6 | 169.8 | 3 | |
| Jack mackerel | 17.6 | 48.4 | 99.4 | 0.0 | 165.3 | 198.4 | 3 | |
| Japanese amberjack | 18.9 | 12.1 | 89.8 | 0.0 | 120.8 | 147.9 | 3 | |
| Japanese eel | 13.5 | 24.2 | 54.4 | ND | 92.1 | 110.9 | 2 | |
| Japanese seabass | 13.5 | 12.1 | 93.9 | 0.0 | 119.5 | 146.2 | 3 | |
| Mebaru | 13.5 | 18.1 | 92.5 | 0.0 | 124.2 | 151.3 | 3 | |
| Monkfish | Meat | 17.5 | 19.5 | 32.6 | 0.5 | 70.0 | 84.2 | 2 |
| Monkfish | Liver (raw) | 38.2 | 55.6 | 6.0 | 4.4 | 104.3 | 121.8 | 3 |
| Monkfish | Liver (steamed) | 158.2 | 211.4 | 26.6 | 3.1 | 399.2 | 468.2 | 5 |
| Pacific saury | 14.9 | 52.9 | 87.1 | 0.0 | 154.9 | 184.9 | 3 | |
| Rainbow trout | 25.7 | 55.9 | 99.4 | ND | 180.9 | 216.8 | 3 | |
| Red seabream | 13.5 | 10.6 | 104.8 | 0.0 | 128.9 | 158.0 | 3 | |
| Sablefish | Meat | 27.4 | 11.9 | 83.9 | 0.2 | 123.3 | 151.1 | 3 |
| Sablefish | Skin | 12.1 | 14.0 | 39.2 | 1.6 | 66.9 | 80.8 | 2 |
| Sailfin sandfish | 16.2 | 30.2 | 49.0 | 3.0 | 98.5 | 117.7 | 2 | |
| Salmon | 17.6 | 10.6 | 91.2 | 0.0 | 119.3 | 146.2 | 3 | |
| Sardine | 17.6 | 105.8 | 87.1 | ND | 210.4 | 247.1 | 4 | |
| Sillaginidae | 13.5 | 10.6 | 119.8 | ND | 143.9 | 176.5 | 3 | |
| Spanish mackerel | 12.2 | 6.0 | 121.1 | ND | 139.3 | 171.5 | 3 | |
| Striped pigfish | 13.5 | 10.6 | 125.2 | ND | 149.3 | 183.2 | 3 | |
| Tilefish | 9.5 | 10.6 | 99.4 | 0.0 | 119.4 | 146.2 | 3 | |
| Tuna | 17.6 | 10.6 | 129.3 | 0.0 | 157.4 | 193.3 | 3 | |
| Wakasagi smelt | 13.5 | 24.2 | 57.2 | 0.0 | 94.8 | 114.3 | 2 | |
| Weather loach | 28.4 | 49.9 | 51.7 | 6.1 | 136.0 | 161.4 | 3 | |
| Yellow striped flounder | 14.9 | 28.7 | 69.4 | 0.0 | 113.0 | 136.2 | 3 | |
Most of the fresh fish meat (29/32 items) contained a high ratio of hypoxanthine (from 51.4% for sailfin sandfish to 87.3% for Spanish mackerel). Eleven fresh fish (11/32 items) contained guanine as more than 20% of their total purines (47.6% for sardine, 31.8% for Pacific saury, 28.7% for rainbow trout, 27.1% for jack mackerel, 23.5% for wakasagi smelt).
Guanine is reported to be present in fish skin as anhydrous crystals producing a metallic color and sometimes iridescence.32,33) A shining mechanism of guanine crystals has also been reported.34,35) This explains why the skin of gnomefishes and other such fish with a metallic color have a large amount of guanine (296.7 mg/100 g for the gnomefish skin, 105.8 mg/100 g for sardine).
3.7. Amount of Purines in Fish Roe, Fish Milt, Shellfish, Mollusks, and Dried FishPurines in other forms of seafood are shown in Tables 6 and 7. The amount of purines in many shellfish, mollusks, and dried fish was high, with values exceeding 150 mg/100 g. Pigfish milt, several shellfish, and half-dried fish contained 208.8–305.7 mg/100 g, placing them within the high or very high groups. By contrast, several types of fish roe and processed fish contained only small amounts of purines.
| (mg/100 g) | ||||||||
|---|---|---|---|---|---|---|---|---|
| Foodstuffs | Part | Adenine | Guanine | Hypoxanthine | Xanthine | Total | Calculated as uric acid | Classified group # |
| Fish roe, Fish milt | ||||||||
| Caviar | 7.5 | 46.1 | 39.4 | 1.7 | 94.7 | 111.1 | 2 | |
| Flying fish roe (in soy sauce, Tobiko) | 21.3 | 47.7 | 20.4 | 2.2 | 91.5 | 107.1 | 2 | |
| Flying fish roe (Tobiko) | 9.9 | 14.5 | 41.4 | 2.1 | 67.8 | 81.8 | 2 | |
| Herring roe (Kazunoko) | 6.8 | 15.1 | 0.0 | 0.0 | 21.9 | 25.2 | 1 | |
| Salmon roe (Ikura) | 0.0 | 0.0 | 2.5 | 1.1 | 3.7 | 4.4 | 1 | |
| Pollock roe (marinated, Mentaiko) | 32.9 | 81.0 | 36.9 | 8.6 | 159.3 | 186.0 | 3 | |
| Pollock roe (Tarako) | 35.1 | 66.5 | 19.1 | ND | 120.7 | 141.2 | 3 | |
| Salmon roe (Sujiko) | 4.1 | 7.6 | 4.1 | ND | 15.7 | 18.5 | 1 | |
| Milt (Striped pigfish) | 67.0 | 211.5 | 19.4 | 7.7 | 305.5 | 351.1 | 5 | |
| Shellfish, Mollusk | ||||||||
| Botan shrimp | 8.3 | 16.4 | 28.7 | 0.0 | 53.4 | 64.0 | 2 | |
| Botan shrimp (roe) | 75.0 | 53.0 | 34.5 | 0.0 | 162.5 | 194.9 | 3 | |
| Clam | 63.5 | 39.3 | 12.2 | 30.4 | 145.5 | 171.5 | 3 | |
| Common orient clam | 45.9 | 24.2 | 5.4 | 28.9 | 104.5 | 122.7 | 3 | |
| Crab | Ovary | 42.5 | 105.8 | 3.9 | 0.0 | 152.2 | 175.4 | 3 |
| Firefly squid | 51.4 | 57.6 | 15.6 | 3.4 | 128.1 | 151.2 | 3 | |
| Japanese flying squid | 47.3 | 21.2 | 80.3 | 38.0 | 186.8 | 223.6 | 3 | |
| Japanese scallop | 63.6 | 6.6 | 5.3 | 1.0 | 76.5 | 94.2 | 2 | |
| Kuruma shrimp | 58.1 | 15.1 | 87.1 | 35.0 | 195.3 | 235.3 | 3 | |
| Octopus | 21.6 | 18.1 | 36.7 | 60.8 | 137.3 | 159.7 | 3 | |
| Octopus | Organs | 29.1 | 42.0 | 4.8 | 4.0 | 79.8 | 93.1 | 2 |
| Okiami (Krill) | 108.1 | 74.0 | 17.7 | 25.9 | 225.7 | 267.3 | 4 | |
| Oriental shrimp | 40.5 | 12.1 | 103.4 | 117.1 | 273.2 | 321.1 | 4 | |
| Oyster | 55.4 | 34.8 | 12.2 | 82.1 | 184.5 | 213.5 | 3 | |
| Red king crab | 56.7 | 19.6 | 9.5 | 13.7 | 99.6 | 119.4 | 2 | |
| Sakura shrimp (dried) | 83.9 | 124.0 | 512.2 | 29.0 | 749.1 | 907.0 | 5* | |
| Sea cucumber | 3.2 | 2.1 | 0.2 | 0.0 | 5.5 | 6.6 | 1 | |
| Sea Urchin | 40.0 | 65.7 | 22.5 | 9.1 | 137.3 | 160.7 | 3 | |
| Shiba shrimp | 43.2 | 16.6 | 84.4 | ND | 144.2 | 176.5 | 3 | |
| Shredded squid (dried) | 24.9 | 20.6 | 47.9 | 1.0 | 94.4 | 114.2 | 2* | |
| Snow crab | 75.7 | 13.6 | 0.0 | 47.2 | 136.4 | 161.4 | 3 | |
| Spear squid | 58.1 | 15.1 | 34.0 | 53.2 | 160.5 | 190.0 | 3 | |
| Spiny lobster | 31.1 | 9.8 | 61.2 | 0.1 | 102.1 | 125.2 | 3 | |
| Squid | Organs | 0.0 | 17.1 | 22.1 | 20.4 | 59.6 | 68.8 | 2 |
| (mg/100 g) | ||||||||
|---|---|---|---|---|---|---|---|---|
| Foodstuffs | Part | Adenine | Guanine | Hypoxanthine | Xanthine | Total | Calculated as uric acid | Classified group # |
| Half-dried fish | ||||||||
| Jack mackerel | 14.9 | 119.4 | 111.6 | ND | 245.8 | 289.1 | 4 | |
| Pacific saury | 12.2 | 102.7 | 93.9 | ND | 208.8 | 245.4 | 4 | |
| Sardine | 20.3 | 157.1 | 125.2 | 3.0 | 305.7 | 358.1 | 5 | |
| Shishamo with roe | 12.1 | 60.4 | 74.5 | 2.6 | 149.6 | 177.1 | 3 | |
| Dried fish | ||||||||
| Anchovy (dried) | 258.3 | 464.6 | 381.8 | 4.0 | 1108.6 | 1314.2 | 5* | |
| Katsuobushi (dried bonito) | 51.3 | 78.6 | 363.4 | 0.0 | 493.3 | 600.1 | 5* | |
| Niboshi (dried baby sardines) | 133.7 | 355.1 | 257.2 | 0.0 | 746.1 | 879.2 | 5* | |
| Whitebait (dried) | 159.0 | 235.4 | 69.6 | 7.5 | 471.5 | 554.0 | 5* | |
| Canned fish | ||||||||
| Salmon | 24.3 | 37.8 | 70.8 | 0.0 | 132.9 | 159.7 | 3 | |
| Tuna | 14.9 | 13.6 | 88.5 | 0.0 | 116.9 | 142.9 | 3 | |
| Processed fish | ||||||||
| Fish ball | 12.2 | 24.2 | 31.3 | 0.0 | 67.6 | 80.7 | 2 | |
| Fish sausage | 6.8 | 9.1 | 6.8 | 0.0 | 22.6 | 26.9 | 1 | |
| Fishcake tube (Chikuwa) | 14.9 | 15.1 | 17.7 | 0.0 | 47.7 | 57.2 | 1 | |
| Fish product (Hanpen) | 1.6 | 3.3 | 7.4 | 0.2 | 12.5 | 15.0 | 1 | |
| Fish product (Kamaboko) | 9.5 | 6.0 | 10.9 | 0.0 | 26.4 | 31.9 | 1 | |
| Fish product (Narutomaki) | 8.1 | 12.1 | 12.2 | 0.0 | 32.4 | 38.7 | 1 | |
| Fish product (Sasakamaboko) | 14.9 | 16.6 | 16.3 | 0.0 | 47.8 | 57.2 | 1 | |
| Fish product (Satsuma age) | 6.8 | 10.6 | 4.1 | 0.0 | 21.4 | 25.2 | 1 | |
| Snacks | ||||||||
| Deep-fried rice cracker | 0.0 | 4.3 | 4.2 | 5.7 | 14.1 | 16.2 | 1 | |
| Ramen (Japanese noodle) | Soup | 4.7 | 9.9 | 16.5 | 1.5 | 32.7 | 39.0 | 1 |
| Ramen (Japanese noodle) | Noodle | 7.5 | 6.8 | 0.0 | 7.3 | 21.6 | 25.0 | 1 |
#: Classification according to purine content; 1: the very low group: less than 50 mg/100 g (less than 350 µmol/100 g), 2: the low group: 50–100 mg/100 g (350–700 µmol/100 g), 3: the moderate group: 100–200 mg/100 g (700–1400 µmol/100 g), 4: the high group: 200–300 mg/100 g (1400–2050 µmol/100 g), 5: the very high group: more than 300 mg/100 g (more than 2050 µmol/100 g). The dried food that cannot be eaten without cooking is demonstrated with asterisk. ND: not detected.
Fish milt contained 90.8% of purine as adenine and guanine. Almost all of the fish roe, more than half of the shellfish and mollusks, and the processed fish also contained adenine and guanine as >60% of total purines.
3.8. Amount of Purines in Seasonings and SupplementsWithin the examined seasonings and supplements, several items contained high amounts of purines (Table 8). Powdered umami broth includes inosine 5′-monophosphate (IMP), so its purine content was very high at 684.8 mg/100 g of purines. However, only small quantities are used during cooking so its classification is marked with an asterisk in Table 8. Most seasonings (12/17) also contained a high ratio of hypoxanthine (from 51.2% for matsutake soup to 96.2% for powdered umami broth).
| (mg/100 g) | ||||||||
|---|---|---|---|---|---|---|---|---|
| Foodstuffs | Part | Adenine | Guanine | Hypoxanthine | Xanthine | Total | Calculated as uric acid | Classified group # |
| Seasonings | ||||||||
| Barbecue sauce | 0.1 | 0.0 | 14.6 | 0.2 | 14.9 | 18.4 | 1 | |
| Frying powder | 10.6 | 21.8 | 31.9 | 4.4 | 68.7 | 81.8 | 2 | |
| Honey | 0.7 | 0.1 | 0.0 | 0.0 | 0.9 | 1.1 | 1 | |
| Mirin | 0.0 | 0.2 | 0.5 | 0.5 | 1.2 | 1.4 | 1 | |
| Miso | Red miso | 3.6 | 18.0 | 36.5 | 5.4 | 63.5 | 75.6 | 2 |
| Miso | White miso | 0.0 | 16.4 | 29.3 | 3.0 | 48.8 | 57.8 | 1 |
| Nampla | 0.0 | 0.8 | 82.0 | 10.3 | 93.1 | 113.6 | 2 | |
| Oyster sauce | 12.9 | 23.1 | 87.1 | 11.3 | 134.4 | 161.8 | 3 | |
| Powder soup | Consomme | 18.3 | 82.9 | 72.8 | 5.8 | 179.8 | 211.3 | 3* |
| Powder soup | Potage | 8.1 | 6.6 | 21.1 | 1.8 | 37.6 | 45.5 | 1* |
| Powder soup | Clam chowder | 5.6 | 12.5 | 28.4 | 0.6 | 47.1 | 56.6 | 1* |
| Powder soup | Chinese soup | 15.4 | 17.3 | 141.1 | 12.2 | 185.9 | 226.1 | 3* |
| Powder soup | Matsutake | 5.7 | 112.8 | 113.7 | 1.2 | 233.4 | 274.4 | 4* |
| Powdered Umami broth | 6.8 | 19.5 | 657.0 | 1.5 | 684.8 | 843.3 | 5* | |
| Rice bran | 36.1 | 57.2 | 6.0 | 0.9 | 100.2 | 116.9 | 3 | |
| Soy sauce | Dark color | 0.0 | 2.5 | 33.7 | 9.0 | 45.2 | 54.3 | 1 |
| Soy sauce | Light color | 0.7 | 5.0 | 28.5 | 21.0 | 55.3 | 64.9 | 2 |
| Supplement | ||||||||
| Beer yeast | 1646.0 | 1203.9 | 100.1 | 45.7 | 2995.7 | 3561.5 | 5 | |
| Beer yeast product | 601.4 | 539.0 | 44.4 | 21.4 | 1206.2 | 1426.4 | 5 | |
| Chitin, Chitosan | 0.3 | 0.3 | 0.0 | 0.0 | 0.6 | 0.7 | 1 | |
| Chlorella | 1528.0 | 1612.0 | 42.7 | 0.0 | 3182.7 | 3747.3 | 5 | |
| Chondroitin and Beer yeast | 54.5 | 60.2 | 65.0 | 6.3 | 186.1 | 222.1 | 3 | |
| DNA/RNA | 12706.9 | 8247.7 | 452.1 | 86.9 | 21493.6 | 25640.8 | 5 | |
| Glucosamine | 7.9 | 1.3 | 2.6 | 0.0 | 11.8 | 14.4 | 1 | |
| Nucleic acid juice | 2.8 | 4.3 | 0.1 | 1.1 | 8.3 | 9.6 | 1 | |
| Polysaccharide | 6.7 | 15.1 | 26.8 | 9.5 | 58.1 | 68.7 | 2 | |
| Royal jelly | 322.2 | 50.9 | 25.1 | 5.3 | 403.4 | 494.3 | 5 | |
| Scales and collagen | 0.4 | 1.2 | 1.3 | 0.0 | 2.9 | 3.4 | 1 | |
| Soy isoflavone | 1.9 | 4.9 | 0.0 | 0.0 | 6.9 | 7.9 | 1 | |
| Spirulina | 515.8 | 536.2 | 20.9 | 3.9 | 1076.8 | 1268.5 | 5 | |
| Vegetable drink powder from Kale | 12.9 | 27.3 | 0.0 | 0.0 | 40.2 | 46.4 | 1 | |
| Vegetable drink powder from Barley | 30.7 | 57.1 | 0.0 | 0.7 | 88.5 | 102.5 | 2 | |
#: Classification according to purine content; 1: the very low group: less than 50 mg/100 g (less than 350 µmol/100 g), 2: the low group: 50–100 mg/100 g (350–700 µmol/100 g), 3: the moderate group: 100–200 mg/100 g (700–1400 µmol/100 g), 4: the high group: 200–300 mg/100 g (1400–2050 µmol/100 g), 5: the very high group: more than 300 mg/100 g (more than 2050 µmol/100 g). The dried food that cannot be eaten without cooking is demonstrated with asterisk. ND: not detected.
Several supplements, especially DNA/RNA, beer yeast, and chlorella, contained very large amounts of purine at 21493.6, 2995.7, and 3182.7 mg/100 g, respectively. Patients with gout or hyperuricemia should therefore avoid taking these supplements. More than half of the supplements contained adenine and guanine as >60% of total purines
3.9. The Ratio of the Four Purine Bases in Various FoodstuffsWhen the ratio of the four purine bases was compared, two types of foodstuffs were shown to contain mainly adenine and guanine or mainly hypoxanthine.
All cereals, beans, soybean products, seaweeds, dairy products, mushrooms, and vegetables contained >60% of their total purines as adenine and guanine (Tables 1–3). Liver, fish milt, most fish roe, and more than half of the shellfish and mollusks also contained mainly adenine and guanine (Table 4–7). In these foods, the ratio of adenine and that of guanine to the total amount of purine was almost the same.
On the other hand, most of animal and fish meats contained hypoxanthine as >50% of total purines (Tables 4, 5). Metallic colored fish contained considerable amounts of guanine (Table 5).
In Japan, lifestyle interventions for patients with hyperuricemia/gout are shown in the Guidelines for the Management of Hyperuricemia and Gout.13) The major points of lifestyle interventions are nutritional therapy, restriction of alcohol consumption and recommendations for physical training. Nutritional therapy suggests an appropriate intake of energy and water and a reduced intake of dietary purines (less than 400 mg/d) and fructose. Education and proper guidance are also thought to play a crucial role in improving the clinical course of the disease with or without drug therapy in the United States.4,5,36,37)
In the Japanese guidelines, food is categorized according to the purine amount (very large, large, small, very small). Patient with gout or hyperuricemia are advised to avoid overeating the foods that contain a very large or large amount of purine (Table 9). These foods contain >200 mg/100 g of purines.
| Very large amount of purine (more than 300 mg/100 g) | Chicken liver, Half-dried sardine, Milt (striped pigfish), Monkfish steamed liver, Several supplements |
| Large amount of purine (200–300 mg/100 g) | Pork liver, Beef liver, Bonito, Sardine, Okiami (Krill), Oriental shrimp, Half-dried Jack mackerel, Half-dried Pacific saury |
In several epidemiological studies, the consumption of meat and fish was strongly correlated with elevated uric acid serum concentrations and the risk of gout.6,8–12) In the present review, many meats and fishes contained >100 mg/100 g of purine. We found that most meat and fish contained hypoxanthine at a high ratio relative to the total amount of purines (>50%). From our recent study that examined the composition of purines in some foodstuffs such as beef, beef contained a high amount of IMP, inosine, and hypoxanthine.38) Because IMP and inosine are hydrolyzed to hypoxanthine in our purine analytical method, the amount of hypoxanthine reflects the sum of these purine compounds.
The effect of purines on the serum concentration of uric acid has been shown to differ between purines. Hypoxanthine, IMP, adenine, adenosine 5′-monophosphate, and guanosine 5′-monophosphate were found to increase the serum concentration of uric acid in normal and hyperuricemic subjects and those with gout.39) The effect of hypoxanthine seemed stronger than other purines.40) Considering the different effect on serum uric acid level, such foods that contain not only a large amount of total purines but also a high ratio of hypoxanthine can therefore be considered as the greatest dietary risk factor for developing gout. Heavy intake of these foodstuffs should be avoided.
Interestingly, guanine has not been reported to change serum level or urinary excretion of uric acid.39,40) Some of the examined fish, especially fish with a metallic coloration, contained a considerable amount of guanine. Metallic fish also contained an abundance of unsaturated fatty acid. Epidemiological studies have reported that consumption of these oily fish decreases the risk of cardiovascular disease (CVD).41) Oily fish are allowed for decreasing the risk of CVD in gouty patients with cardiovascular comorbidities.5) Therefore, moderate intake of metallic oily fish can be recommended in nutritional therapy for gout and hyperuricemia, because such a diet does not seem to substantially elevate serum uric acid level and can be expected to decrease the risk of CVD.
On the other hand, vegetables, mushrooms, and cereals contain small amounts of purines, which are mainly adenine and guanine. In these foods, the ratio of adenine and that of guanine to total purine are almost the same, so purine is considered to be mainly present as nucleic acid (e.g. DNA or RNA). Several vegetables contain >50 mg/100 g purine bodies, and are known as purine-rich vegetables. However, they are not reported to increase the risk of gout.10) This is likely to be because their purine content is three to four times less than that of meat. In addition, they contain mainly adenine and guanine in nucleic acids, and guanine does not tend to elevate serum concentrations of uric acid.
Thus, foods containing small amounts of total purine and those containing mainly adenine and guanine are considered to be beneficial for hyperuricemic patients and those with gout. These include eggs, dairy food, cereals, beans, vegetables, mushrooms, and soybean products. Eggs and dairy products contain almost zero purine. In particular, dairy products are recommended dietary foods for patients with gout. Milk proteins such as casein also reduce uric acid serum concentrations by increasing the excretion of uric acid.2,42) A population-based case-control study showed that calcium was inversely associated with plasma urate concentration.9) The risk of gout has been shown to be low in individuals who consume plenty of dairy products.10) Indeed, U.S. and British guidelines for gout recommend the consumption of these foods.14–16)
Most seasonings, such as Japanese miso, soy sauce, and umami broth, contain hypoxanthine at a ratio of more than half the total amount of purines (Table 8). This is because they include an umami component derived from IMP. However, as only a small amount of seasoning is used during cooking, their overeating will not occur in a normal diet.
Although we report total purine and purine bases of 270 foodstuffs in the present review, there are many other foodstuffs remaining that have not been categorized in terms of their purine content. We will continue to determine the purine content of various foods.
Two important points should be taken into consideration regarding nutritional therapy for gout or hyperuricemia with particular respect for the restriction of dietary purines. The first is the amount of total purines in the food and the second is what types of purine bases are included.
The consumption of foods that contain >200 mg/100 g of purines, especially with a high ratio of hypoxanthine, is considered to be a high risk for hyperuricemia. This group includes animal meats, fish meats, and some shrimps. Epidemiological studies have shown that a high intake of such foods is related to the elevation of serum uric acid concentrations and thus is correlated with the risk of gout. Because liver and milt also contains a high amount of purines, heavy consumption of these foods is not recommended even if the purines are mainly adenine and guanine. However, moderate consumption of metallic fish that contain a considerable amount of guanine is recommended not only for the management of gout and hyperuricemia but also for decreasing cardiovascular disease risk. High intake of low-purine foodstuffs, such as dairy products, cereals, beans, vegetables, mushrooms, and soybean products, is strongly recommended.
In conclusion, we have reported the content of total purines and each purine base in various foodstuffs with the aim of facilitating nutritional therapy for hyperuricemia and gout. A relatively small number of foods contain large amounts of purines. Purine-rich food should be eaten in moderation. Good dietary habits with a good balance of nutrients are recommended.
This work was supported by a Grant from the Gout Foundation of Japan.