Regular Articles
Anticancer Effects of γ-Tocotrienol Are Associated with a Suppression in Aerobic Glycolysis
2015 Volume 38 Issue 9 Pages 1352-1360
Details
2015 Volume 38 Issue 9 Pages 1352-1360
Aerobic glycolysis is an established hallmark of cancer. Neoplastic cells display increased glucose consumption and a corresponding increase in lactate production compared to the normal cells. Aerobic glycolysis is regulated by the phosphatidylinositol-3-kinase (PI3K)/Akt/ mammalian target of rapamycin (mTOR) signaling pathway, as well as by oncogenic transcription factors such as c-Myc and hypoxia inducible factor 1α (HIF-1α). γ-Tocotrienol is a natural isoform within the vitamin E family of compounds that displays potent antiproliferative and apoptotic activity against a wide range of cancer cell types at treatment doses that have little or no effect on normal cell viability. Studies were conducted to determine the effects of γ-tocotrienol on aerobic glycolysis in mouse +SA and human MCF-7 breast cancer cells. Treatment with γ-tocotrienol resulted in a dose-responsive inhibition of both +SA and MCF-7 mammary tumor cell growth, and induced a relatively large reduction in glucose utilization, intracellular ATP production and extracellular lactate excretion. These effects were also associated with a large decrease in enzyme expression levels involved in regulating aerobic glycolysis, including hexokinase-II, phosphofructokinase, pyruvate kinase M2, and lactate dehydrogenase A. γ-Tocotrienol treatment was also associated with a corresponding reduction in the levels of phosphorylated (active) Akt, phosphorylated (active) mTOR, and c-Myc, but not HIF-1α or glucose transporter 1 (GLUT-1). In summary, these findings demonstrate that the antiproliferative effects of γ-tocotrienol are mediated, at least in the part, by the concurrent inhibition of Akt/mTOR signaling, c-Myc expression and aerobic glycolysis.
Normal differentiated nonproliferating cells metabolize glucose for fuel using glycolysis and oxidative phosphorylation. However, during hypoxic conditions glycolysis and oxidative phosphorylation becomes uncoupled and pyruvate is converted to lactate by anaerobic glycolysis.1,2) In contrast, cancer cells often metabolize glucose to lactate independently of oxygen availability using a process call aerobic glycolysis or the “Warburg effect,” and this characteristic is considered to be a hallmark of neoplastic transformation.2–5) Although, aerobic glycolysis is less efficient than oxidative phosphorylation and requires the conversion of large quantities of glucose to lactate for the production of ATP, it provides intermediate precursors for the biosynthesis of macromolecules that are essential for cancer cell proliferation.1,2)
Various growth factors have been shown to regulate metabolic pathways in both normal and cancerous cells.1) Studies have shown that activation of the phosphatidylinositol-3-kinase (PI3K)/Akt/mammalian target of rapamycin (mTOR) pathway promotes aerobic glycolysis and increases the expression of genes responsible for de novo fatty acid synthesis.1) The downstream target for Akt, mTOR plays an important role in the regulation of cell metabolism in response to changes in nutrient availability and acts to integrates metabolic signals and cell proliferation by modulating the activation the hypoxia inducible factor-1α (HIF-1α) and c-Myc,1,6) transcription factors that are also characteristically elevated in many types of cancers.7,8)
During conditions of adequate oxygen availability HIF-1α is degraded by ubiquitination.6,8) However, during hypoxic conditions HIF-1α is stabilized and acts to promote aerobic glycolysis by inducing expression of glucose transporters and key glycolytic enzymes. HIF-1α also enhances the expression of lactate dehydrogenase A (LDHA), which acts to prevent pyruvate entry into the tricarboxylic acid cycle (TCA) and promote the production of lactate.1) In contrast, c-Myc regulates glucose metabolism by increasing the expression of the same glycolytic enzymes as HIF-1α, but does so during normal, non-hypoxic conditions.7) Specifically, c-Myc promotes LDHA activity and contributes to aerobic glycolysis by positively regulating glucose transporter 1 (GLUT-1), hexokinase II (HK-II) and phosphofructokinase (PFK).7,9) However, it is now well established that c-Myc and HIF-1α act in collaboration to promote aerobic glycolysis in many types of cancer cells.10)
γ-Tocotrienol is a member of the vitamin E family of compounds that displays potent anticancer effects at treatment doses that have little or no effect on normal cell viability.11–16) Previous studies have shown that γ-tocotrienol significantly decreases growth factor receptor mediated activation of the PI3K/Akt/mTOR pathway.14,17,18) Recently, it has also been shown that exposure to tocotrienols decreases c-Myc protein levels,18–20) and block compensatory increases in HIF-1α during hypoxic conditions in cancer cells.21,22) In addition, combined treatment of γ-tocotrienol with PPARγ antagonists was found to suppression of the production of adipogenic factors that are involved in the metabolic reprogramming of mammary cancer cells.23) Taken together, these findings suggests that γ-tocotrienol may have an effect in modulating aerobic glycolysis in mammary cancer cells. Therefore, studies were conducted to determine the effects of γ-tocotrienol on glucose metabolism and the molecular mechanisms involved in mediating these effects on aerobic glycolysis in the highly malignant mouse +SA mammary tumor and human MCF-7 breast cancer cell lines.
All reagents were purchased from Sigma-Aldrich (St. Louis, MO, U.S.A.), unless otherwise stated. Purified γ-tocotrienol (>98% purity) was generously provided by First Tech International Ltd. (Hong Kong). Antibodies for PI3K, Akt, phospho-Akt (p-Akt), phospho-mTOR (p-mTOR), HK-II, LDHA, PFK, and pyruvate kinase muscle isozyme 2 (PKM2) were purchased from Cell Signaling Technology (Beverly, MA, U.S.A.). Antibodies specific for c-Myc (9E10), HIF-1α and monocarboxylate transporter-1 (MCT-1) were purchased from Santa Cruz Biotechnology, Inc. (Dallas, TX, U.S.A.). Antibodies for GLUT-1, and α-tubulin were purchased from GeneTex, Inc. (Irvine, CA, U.S.A.). Goat anti-rabbit and goat anti-mouse secondary antibodies were purchased from PerkinElmer, Inc., Biosciences (Boston, MA, U.S.A.).
Mouse +SA mammary tumor cells are highly malignant, estrogen independent, and display anchorage-independent growth when cultured in soft agarose gels.24–26) Briefly, +SA cells were maintained in serum-free defined control media consisting of Dulbecco’s modified Eagle’s medium (DMEM/F12) supplemented with 5 mg/mL bovine serum albumin (BSA), 10 µg/mL transferrin, 100 U/mL soybean trypsin inhibitor, 100 U/mL penicillin, 0.1 mg/mL streptomycin, 10 ng/mL EGF, and 10 µg/mL insulin. The estrogen-receptor positive human MCF-7 breast carcinoma cell line was purchased from American Type Culture Collection (ATC C, Manassas, VA, U.S.A.). MCF-7 breast cancer cells were cultured in modified DMEM/F12 supplemented with 10% fetal bovine serum, 100 U/mL penicillin, 0.1 mg/mL streptomycin, and 10 µg/mL insulin. All cells were incubated at 37°C in an environment of 95% air and 5% CO2 in humidified incubator. For subculturing, cells were rinsed twice with sterile Ca2+- and Mg2+-free phosphate-buffered saline (PBS) and incubated in 0.05% trypsin containing 0.025% ethylenediaminetetraacetic acid (EDTA) in PBS for 5 min at 37°C. The released cells were centrifuged, resuspended in serum containing media, and counted using a hemocytometer.
The stock solution of γ-tocotrienol was prepared by dissolving a known amount of γ-tocotrienol in 100 µL of absolute ethanol and then suspending this solution in sterile 10% BSA solution followed by gentle shaking at 37°C overnight as described previously.11) This stock solution was used to prepare various concentrations of the treatment media. Ethanol was added to all treatment groups in a given experiment such that the final concentration of ethanol was always maintained below 0.1%.
For growth studies, (+SA and MCF-7) cells were initially plated at a density of 5×10³ cells/well in 96-well culture plates (6 wells/group) and returned to incubator and allowed to attach overnight. The next day, cells were divided into different treatment groups and then given fresh media containing various doses of γ-tocotrienol. Fresh media was supplied to cells in every alternate day during 96 h treatment period. Afterwards, viable cell number was determined using the 3-(4,5-dimethylthiazol-2yl)-2,5-diphenyltetrazolium bromide (MTT) colorimetric assay, as described previously.21,27) Briefly, media was replaced in all treatment groups with fresh control media containing 0.5 mg⁄mL MTT. After a 3 h incubation period, medium was removed, MTT crystals were dissolved in dimethyl sulfoxide (DMSO) (100 µL/well), and optical density of each sample was measured at 570 nm on a microplate reader (SpectraCount, Packard BioScience Company, Meriden, CT, U.S.A.) zeroed against a blank prepared from cell-free medium. Numbers of cells/well were calculated against a standard curve prepared by plating known cell densities, as determined by hemocytometer, in triplicate at the beginning of each experiment.
For the measurement of intracellular ATP levels, (+SA and MCF-7) cells were initially plated at a density of 5×10³ cells/well in 96-well culture plates (6 wells/group) and allowed to attach overnight. The next day, cells were divided into different treatment groups and then given fresh media containing various doses of γ-tocotrienol. Cells in all groups were fed fresh treatment media every other day for a 96 h treatment period. Afterwards, intracellular ATP levels were determined using the CellTitre-Glo luminescence assay Promega Corporation (Madison, WI, U.S.A.) according to the manufacturer’s instructions.
For the measurement of glucose consumption from culture media, (+SA and MCF-7) cells were plated at a density of 1×10⁵ cells in 6-well culture plate and allowed to attach overnight. The following day, cells were divided into different treatment groups (3 wells/group), culture media was removed, washed with sterile PBS, cells were treated with 0–8 µM γ-tocotrienol and fresh media was fed every other day during the 4-d culture period and glucose concentration was measured as described previously.28) Briefly, culture media was removed from the culture plates and glucose concentrations (mg/dL) were measured using an ACCU-CHEK Active glucose meter (Roche Diagnostics, Indianapolis, IN, U.S.A.). Glucose concentrations were calculated by subtracting the glucose concentration in each treatment groups from the glucose concentration from the cell-free media blank.
For the measurement of extracellular lactate excreted into culture media, cells were plated at a density of 1×10⁵ cells in 6-well culture plate and allowed to attach overnight. The following day, cells were divided into different treatment groups (3 wells/group), culture media was removed, washed with sterile PBS, cells were treated with 0–8 µM γ-tocotrienol and fresh media was fed every other day during the 4-d culture period. Afterwards, lactate was measured using L-lactate Assay Kit (Cayman Chemical Co., Ann Arbor, MI, U.S.A.). Briefly, 500 µL media was collected from each control and treatment groups and the supernatants were neutralized with 25 µL of 5 M K2CO3 provided in the kit, then centrifuged for 5 min at 10000×g, and then diluted 1 : 2 v/v with assay buffer. Standard solutions and sample aliquots were transferred to 96-well plates, and mixed with 100 µL assay buffer, 20 µL cofactor mixture, and 20 µL fluorometric substrate. Reactions were then initiated by the addition of 40 µL enzyme mixture and then allowed to incubate for 20 min. Fluorescence was measured using excitation and emission wavelengths of 530 nm and 590 nm, respectively.
For Western blot analysis, +SA and MCF-7 cells, were plated at the density of 1×10⁶ cells, allowed to attach overnight. The following day, cells were washed with PBS and exposed to control or treatment media containing 0–8 µM γ-tocotrienol for a 4-d culture period. Afterwards, the cells were isolated with trypsin, washed in PBS, then whole cell lysates were prepared as described previously, in Laemmli buffer.29,30) Protein concentration in each sample was determined using Bio-Rad protein assay kit (Bio Rad, Hercules, CA, U.S.A.). Equal amounts of protein (30–50 µg/lane) from each sample were then subjected to electrophoresis through 7.5–20% sodium dodecyl sulfate (SDS)-polyacrylamide minigels. Proteins from minigels were transplotted at 30 V for 12–16 h at 4°C onto a single 8″×6.5″ polyvinylidene fluoride (PVDF) membrane (PerkinElmer, Inc., Life Sciences, Wellesley, MA, U.S.A.) in a Trans-Blot Cell (Bio-Rad) according to the methods of Towbin.31) These PVDF membranes were then blocked with 2% BSA in 10 mM Tris–HCl containing 50 mM NaCl and 0.1% Tween 20, pH 7.4 (TBST) then incubated with specific primary antibodies against PI3K, Akt, p-Akt, p-mTOR, c-Myc, HIF-1α, HK-II, PFK, PKM2, LDHA, GLUT-1, and MCT-1 diluted 1 : 1000 to 1 : 5000 in 2% BSA in TBST overnight at 4°C. Membranes were incubated in primary antibodies against α-tubulin, diluted 1 : 5000 in 2% BSA in TBST for 2 h at room temperature. Membranes were then washed 5 times in TBST and incubated with respective horseradish peroxide-conjugated secondary antibody diluted 1 : 5000 in 2% BSA in TBST for 1 h at room temperature followed by washing in TBST 5 times. Blots were then visualized by chemiluminescence according to the manufacturer’s instructions (Pierce, Rockford, IL, U.S.A.). Images of protein bands from all treatment groups within a given experiment were acquired using Syngene Imaging System (Frederick, MD, U.S.A.). Visualization of α-tubulin was used to ensure equal sample loading in each lane. All experiments were repeated at least 3 times and a representative Western blot image from each experiment are shown in the figures.
Differences between groups were analyzed by one-way ANOVA followed by Dunnett’s t-test. A difference of p<0.05 was considered statistically significant as compared to the vehicle-treated control group or as defined in the figure legends.
Treatment with 3–4 µM (+SA) or 6–8 µM (MCF-7) γ-tocotrienol for a 96 h culture period significantly inhibited mammary cancer cell growth in dose-dependent manner as compared with the cells in their corresponding vehicle-treated control group (Fig. 1).

Vertical bars indicate mean cell number±S.E.M. in each treatment group. * p<0.05 as compared to cells in their respective vehicle-treated control group.
Based on previously conducted dose– and time–response studies examining the relationship between effects of γ-tocotrienol on c-Myc expression and the growth of +SA and MCF-7 mammary tumor cells,18) a 96 h exposure period was selected for the present studies. Treatment with 3–4 µM (+SA) or 6–8 µM (MCF-7) γ-tocotrienol for a 96 h culture period significantly reduced mammary cancer cell glucose consumption in a dose-dependent manner as compared to their corresponding vehicle-treated control groups (Fig. 2A). This same treatment was also found to significantly inhibit intracellular ATP levels in a dose-dependent manner in both +SA and MCF-7 mammary cancer cells as compared to their corresponding vehicle-treated control groups (Fig. 2B). Treatment with 4 µM (+SA) or 8 µM (MCF-7) γ-tocotrienol for a 96 h culture period significantly reduced extracellular lactate levels as compared to their corresponding vehicle-treated control groups (Fig. 2C).

(A) Glucose was measured in a 200 µL sample obtained from each well using a standard glucometer. Vertical bars represent mean glucose consumption (mg/dL)±S.E.M. in each treatment group. (B) Intracellular ATP level was determined using the luminescence assay. Vertical bars indicate mean relative percentage of ATP in control group±S.E.M. in each treatment group. (C) Extracellular lactate was measured using the L-lactate assay kit. Vertical bars indicate mean relative percentage of lactate in control group±S.E.M. in each treatment group. * p<0.05 as compared to cells in their respective vehicle-treated control group.
Western blot analysis showed that following a 96 h culture period, treatment with 2–4 µM (+SA) or 4–8 µM (MCF-7) γ-tocotrienol induced a dose-responsive dependent decrease in intracellular levels of HK-II, PFK, PKM2 and LDHA in +SA (Fig. 3A) and MCF-7 (Fig. 3B) as compared to their respective vehicle-treated control groups. Scanning densitometric analysis of protein bands in each blot showed that treatment with 4 µM (+SA) and 8 µM (MCF-7) γ-tocotrienol induced a significant decrease in total HK-II, PFK, PKM2 and LDHA levels as compared to cells in their respective vehicle-treated control groups (Figs. 3A, B). Western blot analysis also showed that similar treatment with 2–4 µM (+SA) or 4–8 µM (MCF-7) γ-tocotrienol had no effect on GLUT-1, but induced a dose-dependent decrease in MCT-1 levels in +SA (Fig. 3C) and MCF-7 (Fig. 3D) mammary cancer cells as compared to their respective vehicle-treated control groups. Scanning densitometric analysis of protein bands in each blot showed that treatment with 4 µM (+SA) and 8 µM (MCF-7) γ-tocotrienol induced a significant decrease in GLUT-1 and MCT-1 levels as compared to cells in their respective vehicle-treated control groups (Figs. 3C, D).
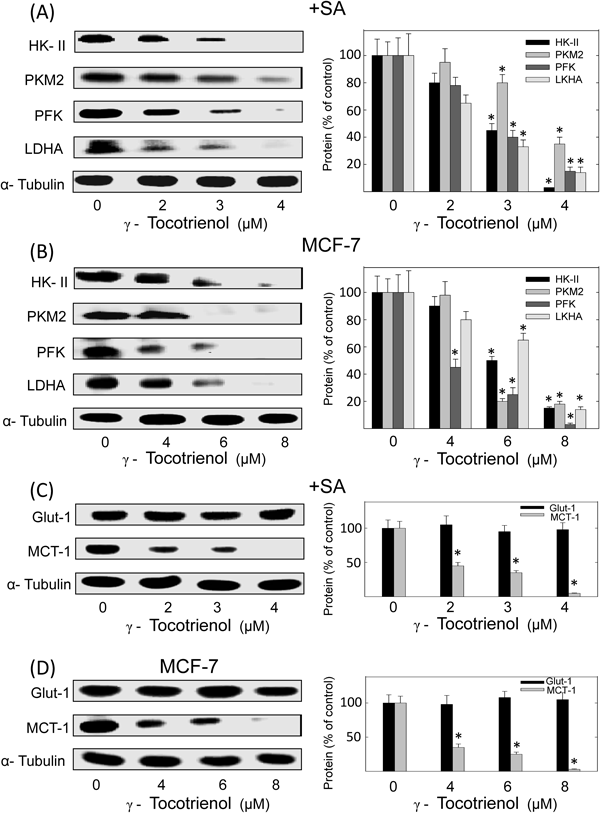
After experimentation, whole cell lysates were prepared for subsequent separation by polyacrylamide gel electrophoresis (50 µg/lane) followed by Western blot analysis for HK-II, PFK, PKM2, LDHA, GLUT-1 and MCT-1. The visualization of α-tubulin was used to ensure equal sample loading in each lane. All experiments were repeated at least 3 times. Scanning densitometric analysis was performed for each blot to visualize the relative levels of proteins. Integrated optical density of each band was normalized with their corresponding α-tubulin and control treatment bands and then shown in bar graphs. Vertical bars indicate the percentage change in protein levels in the various treatment groups±S.E.M. as compared with their respective vehicle-treated control group. * p<0.05 as compared to their respective vehicle-treated control group.
Western blot analysis showed that treatment with 2–4 µM (+SA) or 4–8 µM (MCF-7) of γ-tocotrienol induced a dose-dependent decrease in PI3K, phospho-Akt (active), phospho-mTOR (active) and c-Myc levels in +SA (Fig. 4A) and MCF-7 (Fig. 4B) mammary cancer cells as compared to their respective vehicle-treated control groups. However, HIF-1α protein expression was found to be nearly undetectable, and exposure to γ-tocotrienol had little or no effect on HIF-1α expression in either +SA or MCF-7 mammary cancer cells (Figs. 4A, B).

Whole cell lysates were prepared for subsequent separation by polyacrylamide gel electrophoresis (50 µg/lane) followed by Western blot analysis. The visualization of α-tubulin was used to ensure equal sample loading in each lane. All experiments were repeated at least 3 times. Scanning densitometric analysis was performed for each blot to visualize the relative levels of proteins. Integrated optical density of each band was normalized with their corresponding α-tubulin and control treatment bands and then shown in bar graphs. Vertical bars indicate the percentage change in protein levels in various treatment groups±S.E.M. as compared with their respective vehicle-treated control group. * p<0.05 as compared to their respective vehicle-treated control group.
Results in the present study demonstrate that the antiproliferative effects of γ-tocotrienol are associated with a suppression in aerobic glycolysis characterized by a significantly large reduction in glucose consumption, ATP production and corresponding decrease in lactate excretion in both mouse +SA and human MCF-7 mammary cancer cells. These γ-tocotrienol-induced effects were also found to be directly related to a decrease in the expression of key glycolytic enzymes including HK-II, PKM2, PFK and LDHA, a corresponding decrease in PI3K/Akt/mTOR and c-Myc expression, signaling factors that play a key role in modulating aerobic glycolysis in these mammary cancer cells.
Previous studies showed that mitochondria targeting synthetic analogs of α-tocopherol can directly inhibit glycolysis and reduce intracellular ATP levels in MCF-7 and MDA-MB-231 breast cancer cells.32) However, the molecular mechanism of action mediating the effects of these tocopherol analogs had not been determined. The present study confirms and extends these previous finding by demonstrating that γ-tocotrienol, a natural vitamin E isoform, significantly inhibits mitogenic/metabolic signaling pathways that are involve in regulating glucose metabolism, and ATP and lactate production by suppressing the activity of specific glycolytic enzymes in both mouse +SA and human MCF-7 mammary cancer cells.
It is well established that hexokinase catalyzes ATP-dependent conversion of glucose to glucose-6-phosphate and is the initial enzymatic step in glycolysis.33) There are 4 different hexokinase isomers (I–IV) that are expressed in the mammalian tissues, but HK-II expression is characteristically very high in cancer cells.34) Studies in HK-II conditional knockout mice showed that this enzyme is essential for tumor survival in Ras mutation-dependent lung cancer and ErbB2 mutation-dependent breast cancer.34) Furthermore, knockout of HK-II resulted in significant growth inhibition of these cancer cells in both in vivo and in vitro experimental models.34) The present study shows that the anticancer effects of γ-tocotrienol are directly related with a corresponding decrease in HK-II levels and reduction in glucose metabolism.
PFK catalyzes the conversion of fructose-6-phosphate to fructose 1,6-bisphosphate and is the rate limiting steps of glycolysis. Akt has also been shown to positively regulate PFK activity.35) Results show that γ-tocotrienol treatment induces a relatively large reduction in phosphorylated (activated) Akt levels and this effect was directly associated with a corresponding reduction in PFK levels in both +SA and MCF-7 mammary cancer cells. The final rate limiting step in glycolysis is the conversion of phosphoenol pyruvate to pyruvate and is catalyzed by the enzyme pyruvate kinase.2) There are 4 different isoforms of pyruvate kinase (muscle type 1, muscle type 2, liver; and red blood cell) that are expressed in mammalian tissues.36) Studies have shown that the cancer cells selectively overexpress pyruvate kinase muscle type 2, an isoform that is predominately expressed during embryogenesis, whereas normal differentiated nonproliferating cells primarily express pyruvate kinase muscle type 1.37) The PKM2 and PKM1 isoforms appear to be mutually exclusive splice variants from the same gene called PKM, and studies have shown that the preferential expression of PKM2 in cancer cells is mediated through a c-Myc-dependent mechanism.38,39) Furthermore, PKM2 can induce elevations in c-Myc expression through a positive feedback mechanism, resulting in a large increase in LDHA levels and activity, and is responsible for the amplification of aerobic glycolysis in cancer cells.40) Reports have also identified mTOR as a central activator of aerobic glycolysis in non-hypoxic conditions by stimulating c-Myc-mediated PKM2 gene splicing, whereas treatments that inhibit mTOR activity were found to cause a suppression in PKM2 expression.41) Recent studies have also shown that the antiproliferative effects of γ-tocotrienol on +SA and MCF-7 mammary tumor cells is associated with a dose- and time-dependent reduction in c-Myc protein and mRNA expression, and Akt/mTOR activity.18) The present study extends these previous findings and demonstrates that γ-tocotrienol-induced reductions c-Myc expression and Akt/mTOR activity is associated with a corresponding decrease in PKM2 protein levels. Presently, it has not yet been determined if γ-tocotrienol act directly or indirectly by suppressing Akt/mTOR signaling to reduce c-Myc expression. Nevertheless, these findings suggest that γ-tocotrienol attenuates c-Myc-dependent preferential splicing of PKM2 and consequently lead to suppression of aerobic glycolysis. However, additional experiments are required to confirm this hypothesis.
In the final step of glycolysis, LDHA catalyzes the conversion of pyruvate to lactate. LDHA expression has also been shown to be enhanced by oncogenic c-Myc activity.7,42) Previous studies have demonstrated that cancer cells produce more lactate and display higher levels of LDHA than normal cells, and treatments that silence LDHA expression and/or activity, significantly inhibit of breast cancer cell proliferation.43) Lactate generated during glycolysis is excreted out of cells by monocarboxylate transporters and oncogenic c-Myc activity increases MCT-1 expression in several types of cancers.44,45) In addition, treatments that inhibit c-Myc activity induce a reduction in MCT-1 expression and a subsequent reduction in cancer cell aerobic glycolysis and proliferation.44,45) Results show that mammary cancer cells exposed to γ-tocotrienol treatment displayed a significant decrease in c-Myc, LDHA and MCT-1 levels and a corresponding reduction in lactate production. These findings strongly suggest that γ-tocotrienol-induced inhibition in c-Myc expression plays an important role in mediating γ-tocotrienol action in suppressing aerobic glycolysis and cancer cell proliferation. In summary, these findings suggest that γ-tocotrienol-induced suppression of aerobic glycolysis in +SA mouse mammary and MCF-7 human breast cancer cells is associated with suppression of key regulatory enzymes (HK-II, PFK, PKM2 and LDHA) and signaling proteins (p-Akt, p-mTOR and c-Myc) involved in the regulation of glycolysis. The intracellular mechanisms involved in mediating γ-tocotrienol effects in the suppression of aerobic glycolysis are summarized in Fig. 5.

This work was supported in part by Grants from First Tec International Ltd. (Hong Kong), the Malaysian Palm Oil Council (MPOC), the Louisiana Cancer Foundation and the Louisiana Campuses Research Initiative (LACRI).
The authors declare that they have no personal, financial or competing conflict of interest. First Tech International Ltd. provided a Grant that partially paid for the funding of these experiments and purified γ-tocotrienol that was used in these experiments.