Abstract
Background:
To assess whether global longitudinal strain (GLS) can discriminate high-risk patients with adverse outcome in paradoxical low-flow, low-gradient (LFLPG) severe aortic stenosis (AS).
Methods and Results:
We enrolled 204 patients with severe AS (indexed aortic valve area [iAVA] <0.6 cm2/m2) and preserved left ventricular ejection fraction (LVEF >50%). Patients were divided into 4 groups according to flow state (stroke volume index < or > 35 ml/m2) and mean pressure gradient (< or > 40 mmHg). LV GLS was measured by 2-dimensional speckle-tracking analysis. The primary endpoint consisted of major cardiovascular events, including aortic valve replacement. During a mean 399-day follow-up, 51 (25%) patients met the primary endpoint. Among the 98 LFLPG AS patients, GLS was significantly reduced in patients with any event (−15.6±4.5% vs. −19.4±3.6%, P=0.002). Using receiver-operating characteristic analysis, we classified LFLPG AS patients as impaired GLS (GLS ≥−17%, n=24) or preserved GLS (GLS <−17%, n=74). The impaired GLS group had smaller iAVA, higher LV mass index, higher E/E’, and lower overall 2-year event-free survival (57% vs. 97%; P<0.001) than the preserved GLS group.
Conclusions:
Longitudinal function was severely impaired in patients with LFLPG AS and they had poor prognosis. GLS could stratify the high-risk group for future adverse outcomes. Patients with paradoxical LFLPG AS comprised a mixed group with different LV mechanical properties associated with different prognoses. (Circ J 2014; 78: 2750–2759)
Paradoxical low-flow, low-gradient (LFLPG) severe aortic stenosis (AS) despite preserved (>50%) left ventricular ejection fraction (LVEF) is a relatively new entity that is characterized by a discordant grade of AS severity between the aortic valve area (AVA) and the transaortic mean pressure gradient (mPG).1–4
Several previous studies demonstrated that paradoxical LFLPG severe AS is associated with higher valvuloarterial impedance (Zva), smaller LV dimensions,1,3,5,6
and a higher degree of myocardial fibrosis7
compared with other types of AS. Although controversy still exists, the majority of published studies report that patients with paradoxical LFLPG severe AS have a worse prognosis if treated medically rather than surgically and conclude that such patients had a more advanced stage of AS.1,3,5,8
Recently, Clavel et al revealed that one-third of patients with LFLPG severe AS actually had pseudo-severe AS, using projected AVA,9
which raised a significant concern that paradoxical LFLPG severe AS might encompass a diverse clinical entity ranging from relatively benign to more advanced AS.
LV longitudinal function is closely coupled with future prognosis in various clinical scenarios.2,10,11
Two-dimensional (2D) speckle-tracking echocardiographic assessment of global longitudinal strain (GLS) is a relatively straightforward and reliable approach to evaluating LV longitudinal function.12
GLS is superior to other LV systolic function parameters in detecting myocardial dysfunction and damage, exercise tolerance, and outcomes in patients with AS.10,13
Although several recent reports demonstrated a reduction of GLS in paradoxical LFLPG severe AS, there is a paucity of data regarding the utility of GLS for the prediction of long-term adverse outcome in patients with paradoxical LFLPG severe AS.2,11
Accordingly, we aimed to examine the prognostic value of GLS in this cohort of patients.
Methods
From January 2008 to December 2012, we retrospectively enrolled 509 consecutive patients with severe AS (indexed AVA <0.6 cm2/m2) with preserved LVEF from 4 Japanese cardiovascular centers. Because equipment differences in the 2D strain value for the same subjects have been reported,14
we selected 204 patients who had undergone transthoracic echocardiography with a specific ultrasound machine (Vivid7 or E9, GE Healthcare, Horton, Norway). The study protocol was approved by the ethics committee in each hospital. Exclusion criteria included patients with LVEF <50% and/or more than mild concomitant aortic regurgitation, mitral stenosis, or mitral regurgitation. In addition, we excluded patients with a follow-up period <1 month, or patients who were scheduled for aortic valve replacement (AVR) within 1 month.
Demographic Data Collection
Baseline clinical characteristics were collected at the time of echocardiographic examination. The symptomatic status of all patients was reviewed from medical records and the prevalence of dyspnea (New York Heart Association functional class ≥II), heart failure, chest pain (Canadian Cardiovascular Society class ≥I), or syncope was assessed. Follow-up information was obtained regularly at outpatient clinic visits. Patients, physicians, and next of kin were contacted by telephone if patients had been subsequently treated in a different hospital.
Standard Echocardiographic Measurements
Comprehensive transthoracic echocardiography, including M-mode, 2D, and Doppler, was performed according to the American Society of Echocardiography (ASE) guidelines.15
Aortic valve jet velocity was recorded from multiple acoustic windows, including the apical, right parasternal, or suprasternal window, to yield the highest-velocity signal. LV end-diastolic and end-systolic volumes, stroke volume (SV), and LVEF were measured by the biplane Simpson’s method from the apical 4-chamber and 2-chamber views. Relative wall thickness was estimated as 2×(diastolic LV posterior wall thickness)/LV end-diastolic diameter. LV mass was calculated using Devereux’s formula. Maximum left atrial (LA) volume was measured by the biplane Simpson’s method and indexed to body surface area (BSA). Peak early and late diastolic velocities of the LV inflow (E and A velocity), deceleration time of the E velocity, and peak early diastolic velocity on the septal corner of the mitral annulus (E’) were measured in the apical 4-chamber view. Diastolic dysfunction grade was determined by E’, E/E’, E/A, deceleration time, and LA volume, in accordance with ASE guidelines.15
As a measure of global LV afterload, Zva was calculated as: (SAP+mPG)/SVI, where SAP is the systolic arterial pressure and SVI is the SV index.1
Systemic arterial compliance (SAC) was calculated using the following formula: SAC=SVI/PP, where PP is the brachial pulse pressure. Energy loss coefficient (ELCo) was determined as follows: AVA×AA/(AA–AVA), where AA is the cross-sectional area at the sinotubular junction.1
ELCo was indexed to BSA. AVA was calculated using the continuity equation. Because the use of this equation with the conventional Doppler method has a potential risk for overestimation of SV and AVA, because of upper septal hypertrophy,16
which is more common in the Japanese elderly, SV was determined by 2D echocardiography, and AVA was calculated as AVA=SV derived from the 2D biplane Simpson’s method/velocity time integral of peak AV velocities. AVA was indexed to BSA (iAVA).
AS Grading According to Flow and Pressure
Each patient was classified into 1 of 4 subsets of AS depending on flow status (normal flow [NF] vs. low flow [LF]) and pressure gradient (low PG [LPG] vs. high PG [HPG]), as reported previously.1
Specifically, LF was defined as a SVI <35 ml/m2, and LPG was defined as a mPG <40 mmHg. This classification resulted in the following 4 subgroups: LFLPG, LFHPG, NFLPG, and NFHPG.
2D Longitudinal Strain Analysis
The 2D apical 4-chamber, 2-chamber, and long-axis views were acquired at a high frame rate (53±4). Longitudinal strain measurements were performed using commercially available software (EchoPAC PC, 104.3.0, GE Healthcare). First, both the endocardial and epicardial borders were traced manually in the end-systolic frame. Subsequently, the software automatically performed speckle-tracking analysis throughout 1 cardiac cycle. The software also provided a tracking score. In segments with poor tracking, readjustments of the borders were performed until adequate tracking was achieved. If this was unattainable, the segment was excluded from the analysis. Peak global strain was defined as the peak negative strain value on the strain curve during the entire cardiac cycle. GLS was automatically determined by the software. Any view in which 2 or more segments could not be tracked was excluded from the analysis, and strains from the remaining apical views were averaged to calculate GLS. We also calculated the averaged value of longitudinal strain in the basal, middle, and apical levels of the LV myocardium. To avoid observer variability, all 2D strain analysis was performed by the same experienced observer (K. Sato).
Clinical Outcomes
The primary endpoint in this study was major adverse cardiovascular events (MACE), including cardiac death, AVR, and any cardiovascular event (heart failure requiring hospitalization, acute myocardial infarction (MI), ventricular tachyarrhythmia, or stroke). In addition, we examined another composite endpoint of cardiac death and any cardiovascular event without AVR, which was treated as censored data to avoid the influence of treatment strategy.
Observer Variabilities
To explore the effect of the intrinsic variability of repeated measurements on strain differences, we assessed intra- and interobserver variabilities on 20 randomly selected LV datasets. To test intraobserver variability, a single observer analyzed the same datasets on 2 different occasions separated by a 1-week interval. To test interobserver variability, a second observer analyzed the data without knowledge of the first observer’s measurements.
Statistical Analysis
Continuous data are expressed as mean±standard deviation. Categorical data are presented as an absolute number or percentage. Comparisons of the continuous variables between the 4 groups were performed by 1-way analysis of variance (ANOVA) with post-hoc Tukey tests when statistically significant. In the comparison of categorical variables, Chi-square test or Fisher’s exact test was performed as appropriate, and Fisher’s exact test with Bonferroni’s adjustment was performed as a post-hoc test. Comparisons of baseline data between groups were performed using the unpaired t-test or Chi-square test. Receiver-operating characteristic (ROC) curve analysis was used to identify the best cut-off values of GLS for the prediction of MACE. Kaplan-Meier analysis was used to estimate event-free survival, and the log-rank test was used to compare survival across the 2 groups. Observer variabilities were assessed using Bland-Altman statistics and intraclass correlation coefficient. A 2-sided P-value <0.05 was considered statistically significant. All statistical analyses were performed with JMP10.0 (SAS Institute Inc, Cary, NC, USA).
Results
Clinical Characteristics and Echocardiographic Parameters of Each Subgroup
The prevalence of patients in the LFHPG, LFLPG, NFHPG, and NFLPG subgroups was 39 (19.1%), 98 (48.0%), 36 (17.6%), and 31 (15.2%), respectively. Their clinical characteristics are shown in
Table 1. There were no significant differences in age, BSA, heart rate or systolic blood pressure among the subgroups. The prevalence of symptoms was highest in the LFHPG subgroup and lowest in the NFLPG subgroup. The LFLPG subgroup had a higher prevalence of coronary artery disease (CAD) compared with the LFHPG subgroup, and prevalence of previous MI or coronary artery bypass graft (CABG) surgery did not show significant difference among the 4 subgroups. The echocardiographic characteristics of the patients in each subgroup are shown in
Table 2. The LFLPG subgroup had the smallest LA chamber sizes and LV mass index. Regarding AS severity, iAVA and indexed ELCo (iELCo) were smallest in patients in the LFHPG subgroup followed by the NFHPG, LFLPG, and NFLPG subgroups. LV diastolic function was similarly impaired in all subgroups. Regarding LV afterload, patients in the LF subgroups (LFHPG and LFLPG) had higher Zva and lower SAC than the patients in the NF subgroups (NFHPG and NFLPG). GLS was lower in patients in the HPG subgroups (NFHPG and LFHPG) than in those in the LPG subgroups (NFLPG and LFLPG).
Table 1.
Clinical Characteristics of 4 Subgroups of Patients With AS
| |
NFHPG (n=36) |
LFHPG (n=39) |
NFLPG (n=31) |
LFLPG (n=98) |
P value |
| Clinical characteristics |
| Age (years) |
76.0±9.8 |
77.0±7.5 |
78.1±8.5 |
77.5±7.4 |
0.728 |
| Male (%) |
16 (44.4) |
6 (15.4) |
12 (38.7) |
38 (38.8) |
0.033 |
| BSA (m2) |
1.47±0.19 |
1.49±0.17 |
1.45±0.20 |
1.50±0.17 |
0.517 |
| HR (beats/min) |
70.4±19.7 |
67.3±11.3 |
75.2±19.4 |
69.8±16.4 |
0.276 |
| SBP (mmHg) |
141.8±23.8 |
137.2±18.4 |
142.3±36.3 |
144.3±22.7 |
0.518 |
| DBP (mmHg) |
69.2±17.1 |
70.5±14.4 |
73.8±12.6 |
76.0±11.9 |
0.039 |
| Symptoms |
| Any symptom (%) |
12 (33.3) |
22 (56.4) |
3 (9.7)††† |
25 (25.5)†† |
<0.001 |
| Chest pain (%) |
3 (8.3) |
7 (17.9) |
1 (3.2) |
2 (2.0)† |
0.007 |
| Syncope (%) |
0 (0.0) |
2 (5.1) |
0 (0.0) |
4 (4.1) |
0.515 |
| Dyspnea, heart failure (%) |
11 (30.6) |
18 (46.2) |
4 (12.9)† |
18 (18.4)† |
0.003 |
| Risk factors and concomitant diseases |
| Hypertension (%) |
24 (66.7) |
31 (79.5) |
22 (71.0) |
78 (79.6) |
0.325 |
| Diabetes (%) |
13 (36.1) |
12 (30.8) |
13 (41.9) |
37 (37.8) |
0.791 |
| Hypercholesterolemia (%) |
14 (38.9) |
22 (56.4) |
11 (35.5) |
42 (42.9) |
0.290 |
| CAD (%) |
7 (19.4) |
4 (10.2) |
9 (29.0) |
35 (35.7)† |
0.024 |
| PMI, CABG (%) |
1 (2.8) |
0 (0.0) |
2 (6.45) |
10 (10.2) |
0.121 |
| Cerebrovascular event (%) |
4 (11.1) |
6 (15.4) |
5 (16.1) |
19 (19.4) |
0.700 |
| Smoking (%) |
7 (19.4) |
1 (2.6) |
2 (6.5) |
13 (13.3) |
0.070 |
Values are mean±SD or n (%). †P<0.05, ††P<0.01, †††P<0.001 vs. LFHPG as determined by post-hoc Fisher’s exact test with Bonferroni’s adjustment of P=0.008.
AS, aortic stenosis; BSA, body surface area; CABG, coronary artery bypass graft surgery; CAD, coronary artery disease; DBP, diastolic blood pressure; HR, heart rate; LFHPG, low-flow, high-pressure gradient; LFLPG, low-flow, low-pressure gradient; NFHPG, normal-flow, high-pressure gradient; NFLPG, normal-flow, low-pressure gradient; PMI, previous myocardial infarction; SBP, systolic blood pressure.
Table 2.
Comparison of Doppler Echocardiographic Data in 4 Subgroups of Patients With LFLPG AS
| |
NFHPG (n=36) |
LFHPG (n=39) |
NFLPG (n=31) |
LFLPG (n=98) |
P value |
| LV geometry |
| LVEDV (ml) |
99.0±24.2 |
69.4±18.4*** |
91.8±15.0††† |
69.1±17.7***,‡‡‡ |
<0.001 |
| LVESV (ml) |
36.1±14.2 |
25.9±11.8*** |
33.9±10.1† |
27.5±9.9***,‡ |
<0.001 |
| LVEF (%) |
64.5±9.0 |
64.1±9.1 |
63.5±7.3 |
61.3±7.5 |
0.114 |
| LVSVI (ml/m2) |
42.8±7.4 |
29.0±4.7*** |
40.1±3.7††† |
27.8±5.1***,‡‡‡ |
<0.001 |
| LV mass index (g/m2) |
141.3±38.6 |
130.8±37.0 |
113.9±25.3** |
106.4±28.9***,††† |
<0.001 |
| RWT (%) |
53.1±10.5 |
57.4±10.7 |
46.5±8.3†††,* |
51.2±9.2†† |
<0.001 |
| AS severity |
| AVA (cm2) |
0.58±0.13 |
0.41±0.13*** |
0.75±0.12†††,*** |
0.61±0.15†††,‡‡‡ |
<0.001 |
| iAVA (cm2/m2) |
0.40±0.08 |
0.27±0.08*** |
0.52±0.05†††,*** |
0.41±0.10†††,‡‡‡ |
<0.001 |
| peak V (m/s) |
4.69±0.56 |
4.82±0.57 |
3.41±0.31†††,*** |
3.23±0.53†††,*** |
<0.001 |
| mPG (mmHg) |
54.7±14.4 |
57.2±13.9 |
26.6±5.3†††,*** |
24.2±8.0†††,*** |
<0.001 |
| iELCo (cm2) |
0.46±0.10 |
0.30±0.09*** |
0.63±0.08†††,*** |
0.48±0.13†††,‡‡‡ |
<0.001 |
| LV diastolic function |
| E/A |
0.73±0.35 |
0.70±0.35 |
0.81±0.35 |
0.79±0.40 |
0.540 |
| E/E’ |
22.6±11.8 |
21.4±10.3 |
19.5±10.4 |
19.4±11.7 |
0.467 |
| LAVI (ml/m2) |
56.2±18.0 |
49.9±17.9 |
48.5±19.2 |
41.9±18.0*** |
<0.001 |
| LV global afterload |
| SAC (ml·mmHg−1·m−2) |
0.66±0.30 |
0.45±0.12*** |
0.59±0.16† |
0.44±0.15***,‡‡‡ |
<0.001 |
| Zva (ml·mmHg−1·m−2) |
4.64±1.83 |
6.81±1.39*** |
4.27±0.96††† |
6.21±2.51***,‡‡‡ |
<0.001 |
| LV strain |
| GLS (%) |
−17.7±3.3 |
−17.1±3.9 |
−19.3±3.4 |
−19.0±3.9† |
0.019 |
| LS base |
−12.8±3.4 |
−12.9±3.8 |
−14.9±3.1 |
−14.4±3.5 |
0.019 |
| LS mid |
−17.5±3.0 |
−16.9±4.0 |
−19.2±3.0† |
−18.8±3.8† |
0.013 |
| LS apex |
−25.0±4.9 |
−23.3±4.8 |
−24.2±6.6 |
−24.7±6.2 |
0.577 |
| GCS (%) |
−18.3±3.6 |
−18.3±4.6 |
−21.0±4.5 |
−19.5±4.2 |
0.041 |
Values are mean±SD or n (%). *P<0.05, **P<0.01, ***P<0.001 vs. NFHPG, †P<0.05, ††P<0.01, †††P<0.001 vs. LFHPG, ‡P<0.05, ‡‡P<0.01, ‡‡‡P<0.001 vs. NFLPG, as provided by ANOVA and post-hoc Tukey tests.
AVA, aortic valve area; iAVA, indexed AVA; GCS, global circumferential strain; GLS, global longitudinal strain; iElCo, indexed energy loss coefficient; LAVI, left atrial volume index; LS, longitudinal strain; LV, left ventricular; LVEDV, LV end-diastolic volume; LVESV, LV end-systolic volume; LVEF, LV ejection fraction; LVSVI, LV stroke volume index; mPG, transaortic mean pressure gradient; peak V, aortic valve peak jet velocity; RWT, relative wall thickness; SAC, systolic arterial compliance; Zva, valvuloarterial impedance. Other abbreviations as in Table 1.
During a mean of 399 days of follow-up (range: 33–1,162 days), 51 (25.0%) patients experienced MACE, and 40 (19.6%) patients underwent AVR. There were 7 (3.4%) cases of cardiac death and 18 (8.8%) patients had a cardiovascular event. Among the 98 patients with LFLPG AS, 11 (11.2%) developed MACE. The prevalence of AVR was significantly higher in the subgroup of patients with HPG (NFHPG, 33.3% vs. LFHPG, 48.7%) compared with the subgroup of patients with LPG (NFLPG, 0.0% vs. LFLPG, 9.2%).
Predictors of Outcomes in LFLPG Severe AS
The clinical and echocardiographic parameters of the LFLPG subgroup patients with and without MACE are shown in
Table 3. Compared with the LFLPG subgroup patients without MACE, LFLPG subgroup patients with MACE had a higher prevalence of comorbid CAD, higher LV mass index, higher E/E’ and larger maximal LA volume index. Regarding AS severity, LFLPG subgroup patients with MACE had higher peak jet velocity and higher mPG resulting in smaller iAVA and iELCo. GLS was significantly lower in LFLPG subgroup patients with MACE than in those without MACE. In the multivariate logistic regression analysis, GLS was found to be a significant predictor of outcome (P<0.001) after adjusting for age, sex, previous CAD, LVEF, and iAVA. The ROCs of GLS for the prediction of future MACE in each patient group are shown in
Figure 1, and the area under the curve, optimal cut-off points, and their diagnostic accuracy in each group are shown in
Table 4. GLS had significant prognostic power in patients with LFLPG and NFLPG severe AS. However, GLS had no prognostic power in the patients with HPG (NFHPG and LFHPG) severe AS.
Table 3.
Predictors of MACE in LFLPG AS Patients
| |
MACE |
P value |
Multivariate |
| Yes (n=11) |
No (n=87) |
P value |
OR (95% CI) |
| Clinical characteristics |
| Age (years) |
74.1±7.4 |
77.9±7.3 |
0.108 |
0.084 |
|
| Male (%) |
3 (27.3) |
35 (40.2) |
0.521 |
0.257 |
|
| BSA (m2) |
1.49±0.16 |
1.50±0.17 |
0.922 |
– |
|
| SBP (mmHg) |
149.4±21.1 |
143.7±22.9 |
0.438 |
– |
|
| DBP (mmHg) |
77.6±6.2 |
75.8±12.4 |
0.625 |
– |
|
| Symptom (%) |
4 (36.4) |
21 (24.1) |
0.464 |
– |
|
| Chest pain |
1 (9.1) |
1 (1.1) |
0.219 |
– |
|
| Syncope |
0 (0.0) |
4 (4.6) |
1.000 |
– |
|
| Dyspnea, heart failure |
3 (27.3) |
15 (17.2) |
0.423 |
– |
|
| CAD |
7 (63.6) |
28 (32.2) |
0.043 |
0.014 |
7.79 (1.48–63.4) |
| PMI, CABG |
3 (27.3) |
7 (8.0) |
0.086 |
– |
|
| Echocardiographic data |
| LVEDV (ml) |
66.0±21.3 |
69.5±17.3 |
0.540 |
– |
|
| LVESV (ml) |
24.6±12.1 |
27.9±9.7 |
0.297 |
– |
|
| LVEF (%) |
64.6±8.4 |
60.9±7.4 |
0.127 |
0.112 |
|
| LVSVI (ml/m2) |
27.6±5.4 |
27.8±5.1 |
0.905 |
– |
|
| LV mass index (g/m2) |
127.0±33.2 |
103.8±27.4 |
0.011 |
– |
|
| RWT (%) |
54.7±8.3 |
50.8±9.2 |
0.186 |
– |
|
| E/A |
0.83±0.39 |
0.78±0.41 |
0.704 |
– |
|
| E/E’ |
28.2±25.3 |
18.3±8.3 |
0.008 |
– |
|
| LAVI (ml/m2) |
53.9±23.0 |
40.3±16.8 |
0.018 |
– |
|
| AS severity |
| AVA (cm2) |
0.52±0.17 |
0.62±0.15 |
0.035 |
– |
|
| iAVA (mm2/m2) |
0.35±0.10 |
0.42±0.09 |
0.032 |
0.728 |
|
| peak V (m/s) |
3.63±0.55 |
3.18±0.51 |
0.008 |
– |
|
| mPG (mmHg) |
30.0±7.1 |
23.4±7.8 |
0.009 |
– |
|
| iELCo (cm2) |
0.39±0.14 |
0.49±0.13 |
0.018 |
– |
|
| LV global afterload |
| SAC (ml·mmHg−1·m−2) |
0.45±0.27 |
0.43±0.13 |
0.696 |
– |
|
| Zva (ml·mmHg−1·m−2) |
6.9±2.7 |
6.1±2.5 |
0.322 |
– |
|
| LV strain |
| GLS (%) |
−15.6±4.5 |
−19.4±3.6 |
0.002 |
<0.001 |
1.45 (1.16–1.91) |
| LS base |
−13.2±4.7 |
−14.5±3.4 |
0.286 |
– |
|
| LS mid |
−16.3±5.0 |
−19.1±3.6 |
0.036 |
– |
|
| LS apex |
−20.2±6.5 |
−25.2±6.0 |
0.023 |
– |
|
| GCS (%) |
−17.1±4.9 |
−19.8±4.0 |
0.049 |
– |
|
Values are mean±SD or n (%). Multivariate analysis included age, sex, CAD, LVEF, iAVA, and GLS.
CI, confidence interval; MACE, major adverse cardiac events; OR, odds ratio. Other abbreviations as in Tables 1,2.
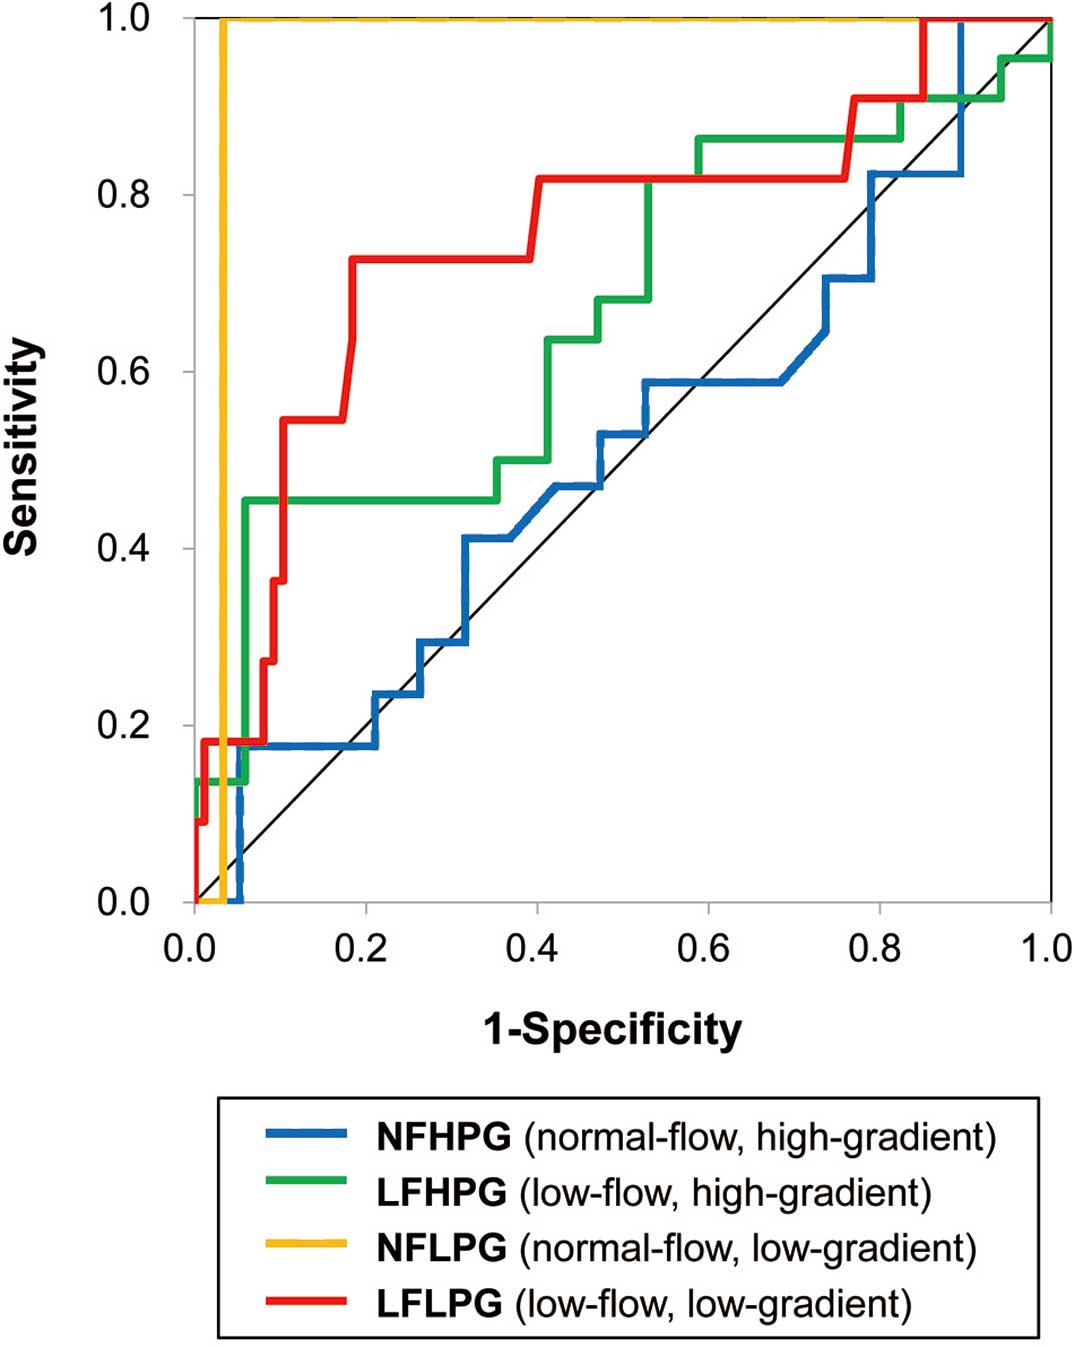
Table 4.
Receiver-Operator Characteristic Curve Analysis of GLS for Predicting MACE in 4 Subgroups of Patients With AS
| |
AUC |
Sensitivity |
Specificity |
Cut-off value |
| NFHPG |
0.51 |
|
|
−13.4 |
| LFHPG |
0.66 |
|
|
−19.7 |
| NFLPG |
0.97 |
1.00 |
0.97 |
−12.0 |
| LFLPG |
0.75 |
0.73 |
0.82 |
−17.0 |
AUC, area under the curve. Other abbreviations as in Tables 1,2.
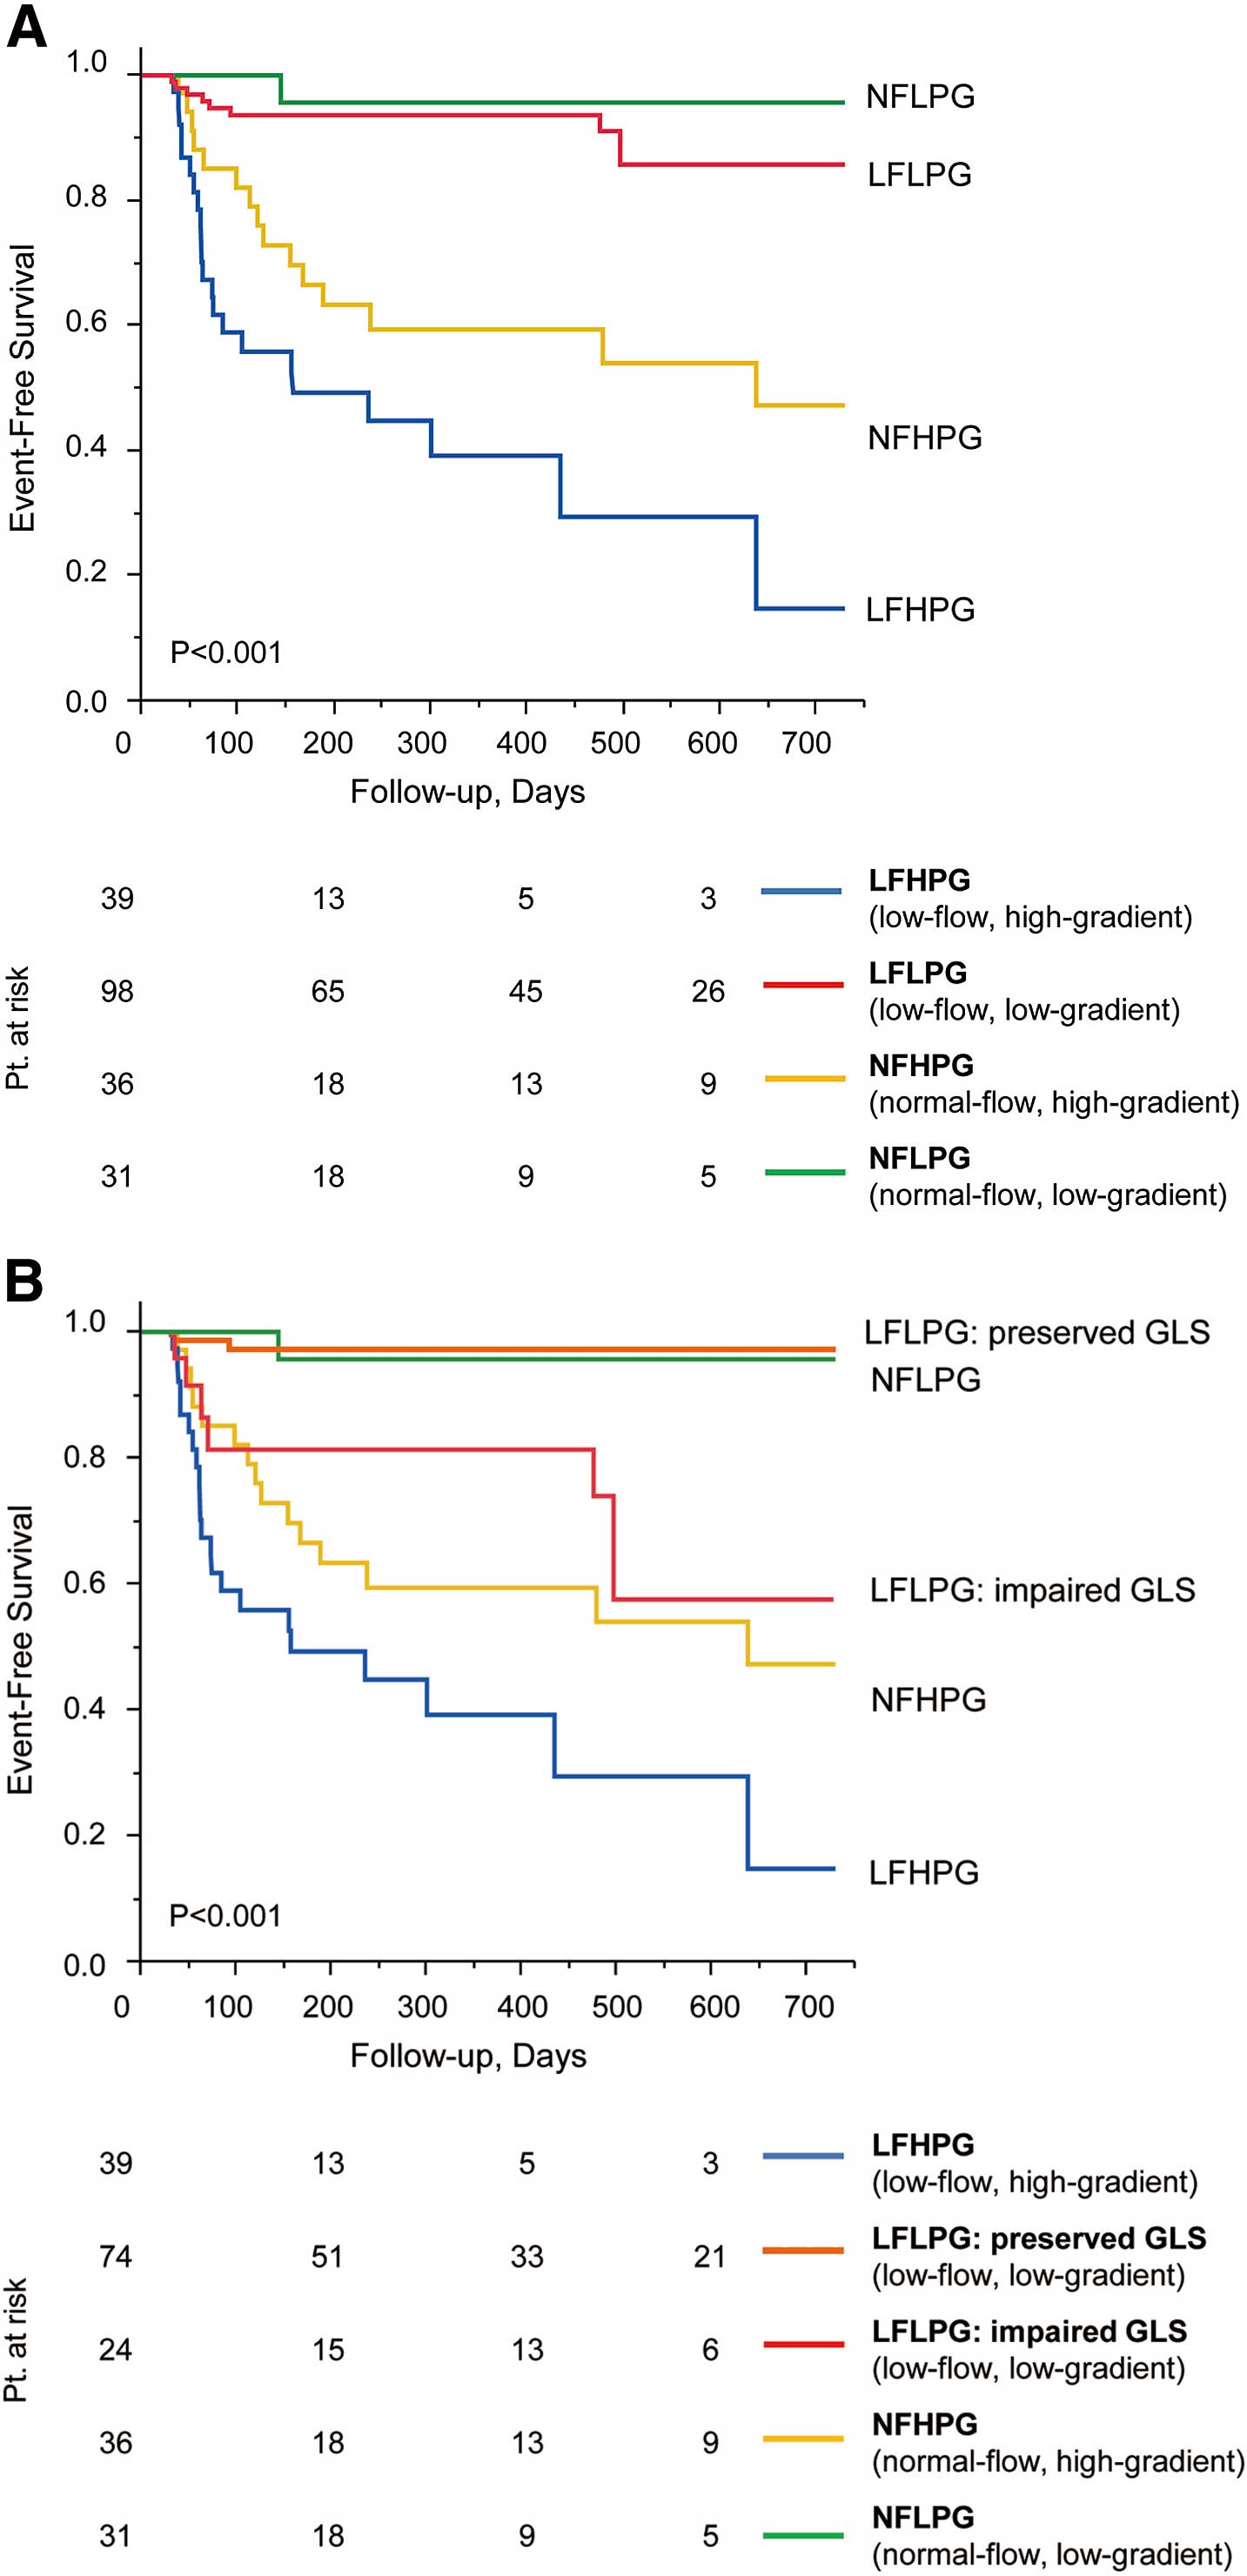
Based on the optimal cut-off value of GLS (≥−17%), LFLPG patients were classified into 1 of 2 groups (impaired GLS group, GLS ≥−17%, and preserved GLS group, GLS <−17%). Log-rank analysis showed patients with impaired GLS had significant worse MACE-free survival (P<0.001). MACE-free survival rates at 2-year follow-up were as follows: impaired GLS, 57.5% and preserved GLS, 97.2%. The clinical and echocardiographic parameters of the 2 groups are shown in
Table 5. Compared with the LFLPG subgroup with preserved GLS, the LFLPG subgroup with impaired GLS had larger LV mass index, higher relative wall thickness, larger maxima LA volume index, and higher E/E’.
Table 5.
Characteristics of the Patients With LFLPG AS and Impaired or Preserved GLS
| |
LFLPG |
P value |
| Preserved GLS (n=74) |
Impaired GLS (n=24) |
| Clinical characteristics |
| Age (years) |
77.6±7.4 |
77.2±7.6 |
0.813 |
| Male (%) |
28 (37.8) |
10 (41.7) |
0.738 |
| BSA (m2) |
1.50±0.17 |
1.49±0.15 |
0.860 |
| HR (beats/min) |
68.9±16.4 |
72.5±16.6 |
0.354 |
| SBP (mmHg) |
143.1±23.3 |
148.4±20.6 |
0.329 |
| DBP (mmHg) |
75.1±11.3 |
78.6±13.3 |
0.224 |
| Symptom (%) |
20 (27.0) |
5 (20.8) |
0.545 |
| CAD (%) |
28 (37.8) |
7 (29.2) |
0.519 |
| LV geometry |
| LVEDV (ml) |
70.0±16.4 |
66.6±21.3 |
0.417 |
| LVESV (ml) |
27.6±9.3 |
27.3±12.0 |
0.910 |
| LVEF (%) |
61.5±7.4 |
60.7±8.1 |
0.652 |
| LVSVI (ml/m2) |
28.3±4.8 |
26.2±5.7 |
0.083 |
| LV mass index (g/m2) |
101.7±27.5 |
120.9±28.7 |
0.004 |
| RWT (%) |
49.7±8.0 |
56.0±10.9 |
0.003 |
| AS severity |
| iAVA (cm2/m2) |
0.42±0.09 |
0.38±0.12 |
0.064 |
| peak V (m/s) |
3.18±0.52 |
3.38±0.55 |
0.114 |
| mPG (mmHg) |
23.4±7.9 |
26.5±7.9 |
0.094 |
| iELCo (cm2) |
0.50±0.12 |
0.44±0.16 |
0.053 |
| LV diastolic function |
| E/A |
0.80±0.40 |
0.76±0.42 |
0.688 |
| E/E’ |
17.5±7.6 |
25.1±18.6 |
0.005 |
| LAVI (ml/m2) |
39.6±16.6 |
48.7±20.6 |
0.032 |
| LV global afterload |
| SAC (ml·mmHg−1·m−2) |
0.45±0.13 |
0.41±0.20 |
0.283 |
| Zva (ml·mmHg−1·m−2) |
5.99±2.48 |
6.89±2.55 |
0.130 |
| LV strain |
| GLS (%) |
−20.6±2.5 |
−13.8±2.5 |
<0.001 |
| LS base |
−15.4±2.8 |
−10.9±3.5 |
<0.001 |
| LS mid |
−20.3±2.7 |
−13.9±2.8 |
<0.001 |
| LS apex |
−26.9±4.5 |
−17.2±5.1 |
<0.001 |
| GCS (%) |
−20.0±4.3 |
−18.0±3.8 |
0.061 |
Values are mean±SD or n (%). Abbreviations as in Tables 1–3.
MACE-free survival among the 4 subgroups is shown in
Figure 2A. MACE-free survival was highest in the subgroup of patients with NFLPG followed by those with LFLPG severe AS. MACE-free survival rates at 2-year follow-up were as follows: NFLPG, 95.7%; LFLPG, 85.7%; NFHPG, 47.2%; and LFHPG, 14.7%. However, after dividing the LFLPG patients into the impaired GLS and preserved GLS groups, those patients with LFLPG and impaired GLS showed poor MACE-free survival rates similar to those of the NFHPG patients, and their survival was significantly worse compared with that of the NFLPG and LFLPG patients with preserved GLS (Figure 2B).
In the subanalysis of the clinical outcome, which was a composite endpoint of cardiac death and cardiovascular event without AVR, GLS was also a significant predictor after adjusting for the influence of age, and iAVA (hazard ratio [HR] 1.61; 95% CI, 1.10–3.05; P=0.011). The impaired GLS group showed significantly worse 2-year event-free survival (impaired GLS, 76.3% and preserved GLS, 100%; P=0.003;
Figure 3A). Comparison of the 4 groups divided by mPG and LVSVI revealed that LFLPG severe AS patients had the second-best 2-year event-free survival rate after NFLPG severe AS patients, and LFLPG severe AS patients had a significantly better prognosis compared with LFHPG severe AS patients (P=0.003). The survival rate of each group was as follows: LFHPG 39.0%, LFLPG 93.4%, NFHPG 83.7%, NFLPG 95.7% (Figure 3B). After subdividing the LFLPG severe AS patients into impaired GLS and preserved GLS groups, the impaired GLS group had the second-worst prognosis (2-year event-free survival 76.3%) after LFHPG severe AS, and the preserved GLS group showed a significantly better prognosis compared with LFHPG (P<0.001), NFHPG (P=0.002), and impaired GLS patients (Figure 3C).

Inter- and intraobserver variability of GLS as assessed by ICC were 0.91 and 0.97, respectively (bias=0.20, agreement limits: −2.15 to 2.56 and bias=0.01, agreement limits: −1.38 to 0.72).
Discussion
The main finding of this study was that GLS has significant prognostic power for future adverse outcome in patients with paradoxical LFLPG severe AS. Our results also suggest that paradoxical LFLPG severe AS is not a single but rather a diverse entity, and GLS could discriminate between patients with poor and benign outcomes.
Diversity of LFLPG Severe AS
The present study showed that the prognosis of patients with LFLPG severe AS was second-best to that of patients in the NFLPG subgroups, the results of which are in contrast to those of previous studies.17,18
Previous reports revealed that patients with LFLPG severe AS had a significantly higher Zva than that of NF patients, decreased longitudinal strain,2,3,17
and significantly poorer overall or event-free survival compared with other groups. Lancelloti et al also showed worst event-free survival in asymptomatic patients with LFLPG severe AS.17
Clavel et al found the event-free survival of paradoxical LFLPG severe AS to be lower than that of patients with moderate AS and they also showed that paradoxical LFLPG severe AS patients had reduced overall event-free survival compared with HPG severe AS patients.18
In the present study, patients with LFLPG severe AS had a higher Zva, smaller LV SV and higher relative wall thickness, which is in agreement with the findings of previous reports. However, these LFLPG patients had higher longitudinal strain values and second-best prognosis, which is inconsistent with a previous study.2
Nevertheless, we clearly demonstrated that longitudinal dysfunction plays a key role in identifying high-risk patients with LFLPG severe AS for future cardiovascular events. Specifically, patients with decreased longitudinal function (GLS ≥−17%) had a higher prevalence of LV concentric hypertrophy and a more advanced stage of diastolic dysfunction than those with preserved longitudinal function, and their prognosis was similar to that of the subgroup of patients with HPG (NFHPG and LFHPG). These findings are in agreement with the typical characteristics of LFLPG severe AS patients seen in Western countries.3,5
Thus, impairment of GLS is an important characteristic of high-risk patients with LFLPG severe AS.
“Pseudo-Severe AS” in LFLPG Severe AS With Preserved LVEF
In contrast to LFLPG severe AS patients with poor prognosis, we defined another type of patient with preserved GLS as having a good prognosis, which accounted for 76% of the LFLPG severe AS group. The better prognosis in the overall group of patients with LFLPG severe AS in our study population may be partly related to those with preserved GLS. One possible pathophysiology in these patients with better prognosis could be “pseudo-severe AS”. In general, pseudo-severe AS is characterized by coexistence of LV dysfunction because of intrinsic myocardial disease and mild to moderate AS. In these cases, the aortic valve is unable to open maximally, even though the valve is only mildly calcified, because of severely reduced LV SV.19
On the other hand, the pathophysiology of pseudo-severe AS in the setting of LFLPG severe AS with normal LVEF has not been determined. Clavel et al reported a validation study of dobutamine stress echocardiography for LFLPG severe AS with preserved LVEF, and revealed that approximately 30% of LFLPG severe AS patients had pseudo-severe AS, and therefore a good prognosis, though the authors did not clarify the characteristics or entities of pseudo-severe AS.9
Complicating conditions may contribute to the clinical relevance of pseudo-severe AS in LFLPG severe AS with normal LVEF; reduced SV with small LV size, measurement errors in estimating LV SV or AVA, conditions during echocardiographic examinations, or inconsistencies in the definition of severe AS in current guidelines.20,21
In the present study, there was no difference between LFLPG severe AS with preserved GLS and impaired GLS in the prevalence of comorbid CAD or prior MI and CABG, which may affect intrinsic myocardial function. Those LFLPG severe AS patients with better prognosis, who were thought to have pseudo-severe AS in our study population, had significantly preserved GLS. These results suggest that the low-flow condition of these patients was not related to LV myocardial dysfunction. In the setting of normal LVEF, pseudo-severe AS might be present if small LV volume results in a reduction in LV SV. Because this type of pseudo-severe AS may differ from the pseudo-severe AS with poor LV function and may have a better prognosis than true severe AS, our result suggests that GLS could be a reliable and more convenient way of differentiating the true severe AS from pseudo-severe paradoxical LFLPG severe AS.
In future, dobutamine stress echocardiography, alone or in combination with computed tomography or cardiac magnetic resonance, should be performed to reveal the characteristics of such patients, and calculation of projected AVA during graded doses of dobutamine infusion may be useful to distinguish true severe AS from pseudo-severe AS irrespective of LV function.9,19,22
Longitudinal Dysfunction in LFLPG Severe AS
LV GLS is reported to be an independent predictor of cardiac events in patients with asymptomatic moderate to severe AS.10
Lee et al demonstrated a close correlation between GLS and well-established prognostic parameters and suggested the prognostic value of GLS in paradoxical low-flow AS.11
As far as we know, the present study is the first to show that GLS is the strongest parameter for predicting MACE in LFLPG severe AS patients. LV hypertrophy and myocardial fibrosis are thought to be the potential cause of decreased longitudinal function.7
Recently, Herrmann et al reported that LPG severe AS with both preserved and decreased LVEF had a higher degree of biopsy-proven interstitial fibrosis and higher prevalence of myocardial delayed enhancement by cardiac magnetic resonance imaging compared with HPG severe AS.7
Regional myocardial perfusion is decreased and systolic wall stress is increased in severe AS with LV hypertrophy.23
Both abnormalities develop predominantly in the subendocardial layers, leading to interstitial fibrosis and subsequent replacement of myocardium by fibrosis during disease progression.24,25
Because subendocardial myocardial fibers are oriented longitudinally, subendocardial dysfunction predominantly develops as an impairment in LV longitudinal shortening.26
Weidemann et al demonstrated that cardiac fibrosis correlated closely with longitudinal systolic function but not LVEF in severe AS patients.25
In the present study, patients with LFLPG severe AS with impaired GLS showed more advanced concentric hypertrophy, which was characterized by increased both LV mass index and relative wall thickness, and a more advanced stage of diastolic dysfunction, which was characterized by increased LA volume index and higher E/E’, in contrast to patients with preserved GLS. These findings suggest that longitudinal dysfunction is a surrogate for advanced LV remodeling that is usually associated with subendocardial fibrosis in patients with LFLPG severe AS.
Study Limitations
First, this was a multicenter but retrospective and cross-sectional study. Thus, further prospective study is required to verify the accuracy of the GLS cut-off criterion to predict poor prognosis in a large number of patients with paradoxical LFLPG severe AS. Second, we calculated SV by the 2D volumetric method because the Doppler method can potentially overestimate SV during geometrical narrowing of the LV outflow tract caused by upper septal hypertrophy, which is frequently observed in the elderly.27
However, the 2D volumetric method is also subject to underestimation of SV because of foreshortening of the LV long axis, poor endocardial definition, and geometric assumptions,28
resulting in overestimation of AS severity and the prevalence of LFLPG severe AS. Third, we included AVR as a primary endpoint, and the decision to perform AVR might be influenced by the treating physician. The referral rate for AVR in LFLPG severe AS patients is usually much lower than for HPG patients, as they are erroneously perceived to have less severe AS because of the low gradient. However, we established the prognostic value of GLS in LFLPG severe AS patients, which means that the lower referral rate for AVR was not influenced by our results. Furthermore, we demonstrated that GLS was a significant prognostic factor especially in LFLPG severe AS patients even after excluding AVR as censored data. Finally, because a recent study revealed considerable inter-vendor variability in strain values,14
further study is required to verify the GLS cut-off value or its prognostic accuracy with other ultrasound vendors’ hardware or software.
Conclusions
Paradoxical LFLPG severe AS may include different clinical entities with a prognosis that varies from poor to benign. GLS assessed by 2D speckle-tracking echocardiography has the potential to predict high-risk LFLPG severe AS patients with poor prognosis.
References
- 1.
Hachicha Z, Dumesnil JG, Bogaty P, Pibarot P. Paradoxical low-flow, low-gradient severe aortic stenosis despite preserved ejection fraction is associated with higher afterload and reduced survival. Circulation 2007; 115: 2856–2864.
- 2.
Adda J, Mielot C, Giorgi R, Cransac F, Zirphile X, Donal E, et al. Low-flow, low-gradient severe aortic stenosis despite normal ejection fraction is associated with severe left ventricular dysfunction as assessed by speckle-tracking echocardiography: A multicenter study. Circ Cardiovasc Imaging 2012; 5: 27–35.
- 3.
Dumesnil JG, Pibarot P, Carabello B. Paradoxical low flow and/or low gradient severe aortic stenosis despite preserved left ventricular ejection fraction: Implications for diagnosis and treatment. Eur Heart J 2010; 31: 281–289.
- 4.
Minners J, Allgeier M, Gohlke-Baerwolf C, Kienzle RP, Neumann FJ, Jander N. Inconsistencies of echocardiographic criteria for the grading of aortic valve stenosis. Eur Heart J 2008; 29: 1043–1048.
- 5.
Pibarot P, Dumesnil JG. Low-flow, low-gradient aortic stenosis with normal and depressed left ventricular ejection fraction. J Am Coll Cardiol 2012; 60: 1845–1853.
- 6.
Lancellotti P, Magne J. Valvuloarterial impedance in aortic stenosis: Look at the load, but do not forget the flow. Eur J Echocardiogr 2011; 12: 354–357.
- 7.
Herrmann S, Störk S, Niemann M, Lange V, Strotmann JM, Frantz S, et al. Low-gradient aortic valve stenosis myocardial fibrosis and its influence on function and outcome. J Am Coll Cardiol 2011; 58: 402–412.
- 8.
Monin JL, Quere JP, Monchi M, Petit H, Baleynaud S, Chauvel C, et al. Low-gradient aortic stenosis: Operative risk stratification and predictors for long-term outcome: A multicenter study using dobutamine stress hemodynamics. Circulation 2003; 108: 319–324.
- 9.
Clavel MA, Ennezat PV, Maréchaux S, Dumesnil JG, Capoulade R, Hachicha Z, et al. Stress echocardiography to assess stenosis severity and predict outcome in patients with paradoxical low-flow, low-gradient aortic stenosis and preserved LVEF. JACC Cardiovasc Imaging 2013; 6: 175–183.
- 10.
Lancellotti P, Donal E, Magne J, Moonen M, O’Connor K, Daubert JC, et al. Risk stratification in asymptomatic moderate to severe aortic stenosis: The importance of the valvular, arterial and ventricular interplay. Heart 2010; 96: 1364–1371.
- 11.
Lee SP, Kim YJ, Kim JH, Park K, Kim KH, Kim HK, et al. Deterioration of myocardial function in paradoxical low-flow severe aortic stenosis: Two-dimensional strain analysis. J Am Soc Echocardiogr 2011; 24: 976–983.
- 12.
Cho GY, Marwick TH, Kim HS, Kim MK, Hong KS, Oh DJ. Global 2-dimensional strain as anew prognosticator in patients with heart failure. J Am Coll Cardiol 2009; 54: 618–624.
- 13.
Yamawaki K, Tanaka H, Matsumoto K, Hiraishi M, Miyoshi T, Kaneko A, et al. Impact of left ventricular afterload on longitudinal dyssynchrony in patients with severe aortic stenosis and preserved ejection fraction. Circ J 2012; 76: 744–751.
- 14.
Takigiku K, Takeuchi M, Izumi C, Yuda S, Sakata K, Ohte N, et al. Normal range of left ventricular 2-dimensional strain: Japanese Ultrasound Speckle Tracking of the Left Ventricle (JUSTICE) study. Circ J 2012; 76: 2623–2632.
- 15.
Lang RM, Bierig M, Devereux RB, Flachskampf FA, Foster E, Pellikka PA, et al. Recommendations for chamber quantification: A report from the American Society of Echocardiography’s Guidelines and Standards Committee and the Chamber Quantification Writing Group, developed in conjunction with the European Association of Echocardiography, a branch of the European Society of Cardiology. J Am Soc Echocardiogr 2005; 18: 1440–1463.
- 16.
Poh KK, Levine RA, Solis J, Flaherty M, Kang YJ, Guerrero JL, et al. Assessing aortic valve area in aortic stenosis by continuity equation: A novel approach using real-time three-dimensional echocardiography. Eur Heart J 2008; 29: 2526–2535.
- 17.
Lancellotti P, Magne J, Donal E, Davin L, O’Connor K, Rosca M, et al. Clinical outcome in asymptomatic severe aortic stenosis: Insights from the new proposed aortic stenosis grading classification. J Am Coll Cardiol 2012; 59: 235–243.
- 18.
Clavel MA, Dumesnil JG, Capoulade R, Mathieu P, Sénéchal M, Pibarot P. Outcome of patients with aortic stenosis, small valve area, and low-flow, low-gradient despite preserved left ventricular ejection fraction. J Am Coll Cardiol 2012; 60: 1259–1267.
- 19.
Fougères E, Tribouilloy C, Monchi M, Petit-Eisenmann H, Baleynaud S, Pasquet A, et al. Outcomes of pseudo-severe aortic stenosis under conservative treatment. Eur Heart J 2012; 33: 2426–2433.
- 20.
Zoghbi WA. Low-gradient “severe” aortic stenosis with normal systolic function. Circulation 2011; 123: 838–840.
- 21.
Tandon A, Grayburn PA. Imaging of low-gradient severe aortic stenosis. J Am Coll Cardiol Imaging 2013; 6: 184–195.
- 22.
Blais C, Burwash IG, Mundigler G, Dumesnil JG, Loho N, Rader F, et al. Projected valve area at normal flow rate improves the assessment of stenosis severity in patients with low-flow, low-gradient aortic stenosis: The multicenter TOPAS (Truly or Pseudo-Severe Aortic Stenosis) study. Circulation 2006; 113: 711–721.
- 23.
Rajappan K, Rimoldi OE, Dutka DP, Ariff B, Pennell DJ, Sheridan DJ, et al. Mechanisms of coronary microcirculatory dysfunction in patients with aortic stenosis and angiographically normal coronary arteries. Circulation 2002; 105: 470–476.
- 24.
Heymans S, Schroen B, Vermeersch P, Milting H, Gao F, Kassner A, et al. Increased cardiac expression of tissue inhibitor of metalloproteinase-1 and tissue inhibitor of metalloproteinase-2 is related to cardiac fibrosis and dysfunction in the chronic pressure-overloaded human heart. Circulation 2005; 112: 1136–1144.
- 25.
Weidemann F, Herrmann S, Störk S, Niemann M, Frantz S, Lange V, et al. Impact of myocardial fibrosis in patients with symptomatic severe aortic stenosis. Circulation 2009; 120: 577–584.
- 26.
Pibarot P, Dumesnil JG. Improving assessment of aortic stenosis. J Am Coll Cardiol 2012; 60: 169–180.
- 27.
Diaz T, Pencina MJ, Benjamin EJ, Araqam J, Fuller DL, Pencina KM, et al. Prevalence, clinical correlates, and prognosis of discrete upper septal thickening on echocardiography: The Framingham Heart Study. Echocardiography 2009; 26: 247–253.
- 28.
Dorosz JL, Lazotte DC, Weitzenkamp DA, Allen LA, Salcedo EE. Performance of 3-dimensional echocardiography in measuring left ventricular volumes and ejection fraction: A systematic review and meta-analysis. J Am Coll Cardiol 2012; 59: 1799–1808.
