Abstract
Background:
The effect of adiposity on response to cardiac resynchronization therapy (CRT) and long-term outcome in patients undergoing CRT has not been previously reported. This study assessed the impact of baseline body mass index (BMI) on cardiac reverse remodeling and prognosis following CRT.
Methods and Results:
A total of 247 CRT patients were included and divided into 4 groups according to baseline BMI. During 6-month follow-up, overweight and obese patients (BMI, 24–28 kg/m2, ≥28 kg/m2, respectively) were inclined to have better clinical and echocardiographic improvements (P<0.05) as well as higher response rate (P<0.001) than underweight and normal weight patients (BMI, <18.5 kg/m2, 18.5–24 kg/m2, respectively). During long-term follow-up, overweight and obese patients had lower all-cause mortality (P=0.015) and combined endpoint of death or HF hospitalizations (P=0.001) than underweight and normal weight patients. Compared with normal weight patients, underweight patients had a 2.29-fold increase in risk of combined endpoint events whereas overweight and obese patients had a reduction in the risk of death (66% and 58%, respectively) and combined endpoint events (52% and 38%, respectively).
Conclusions:
Patients with obesity and overweight derived more benefit from CRT. Higher BMI was independently associated with better clinical outcome in CRT patients. (Circ J 2014; 78: 2899–2907)
Randomized trials have demonstrated that cardiac resynchronization therapy (CRT) improves cardiac pumping efficiency, reverses myocardial remodeling, and reduces heart failure (HF) hospitalization and mortality in advanced HF patients with New York Heart Association (NYHA) class III–IV and evidence of dyssynchrony presenting with a wide QRS complex >120 ms.1–3
Despite the beneficial results of CRT as seen on clinical and echocardiographic improvements as well as clinical outcome, approximately 20–30% of patients treated with CRT do not derive any obvious benefit.4
Furthermore, there was no conclusive evidence to directly explain the reason why strictly selected patients do not respond to CRT. Obesity, quantified by body mass index (BMI), has been considered to be associated with a proportionally increased risk of HF, whereas patients with chronic HF paradoxically have favorable prognosis with increasing BMI, termed the “obesity paradox”.5,6
Given that obesity is increasing in epidemic proportions in patients with newly diagnosed HF, one might expect a growing number of such patients being referred for CRT implantation, therefore assessment of the impact of obesity on response to CRT is critical. Currently, however, there are no published data on whether obesity influences clinical outcome among patients undergoing CRT. We hypothesized that an obesity paradox, as observed in patients with HF, may possibly also appear among CRT candidates wherein obese patients with CRT experience favorable cardiac reverse remodeling and subsequent better clinical outcome as compared to their non-obese counterparts. On these grounds, the present study was designed to evaluate the impact of baseline obesity on the response to CRT as well as prognosis among advanced HF patients receiving CRT implantation.
Methods
Subjects
The study included 247 consecutive chronic HF patients who underwent CRT or CRT-defibrillation (CRT-D) implantation at Fuwai Hospital between January 1999 and December 2013. All subjects met the following inclusion criteria: NYHA class III or IV despite optimal medical therapy, left ventricular (LV) ejection fraction (LVEF) ≤35%, QRS width ≥120 ms and LV end-diastolic diameter (LVEDD) ≥55 mm.1,2
All of the patients signed informed consent forms, and the study complied with the Declaration of Helsinki and was approved by the Research Ethics Board of Fuwai Hospital.
Definitions and Data Collection
BMI was calculated as weight/(height×height) and expressed in kg/m2, height and weight data were recorded at the baseline visit. Patients were classified as underweight (<18.5 kg/m2), normal weight (18.5 to <24 kg/m2), overweight (24–28 kg/m2), and obese (≥28 kg/m2), according to Chinese obesity working group definitions.7
In addition, CRT patients enrolled in the present study had received instructions to intentionally lose weight via dietary restrictions and increased exercise, and the weight trend was calculated as weight at 6-month follow-up minus weight at the initial evaluation. Patients were classified as responders to CRT in terms of improvement in NYHA class by ≥1 combined with an absolute increase ≥5% in LVEF at 6-month follow-up.8
Patients who died, underwent heart transplantation or who were hospitalized for HF within 6 months were regarded as non-responders. Primary endpoint events were defined as all-cause mortality (due to HF, sudden cardiac death, or non-cardiac cause), cardiac transplantation, and hospitalization for decompensated HF. Data including demographics, echocardiographic parameters, laboratory values, and medication at initial evaluation were retrospectively obtained from the electronic medical record. Long-term follow-up after device implantation was performed via chart review, device interrogation or telephone interview.
Echocardiography
Echocardiography was done at baseline for all patients, and at 6 months for 219 patients (88.7%). Echocardiographic parameters including left atrium diameter (LAD) and LVEDD were measured using a commercially available system (iE33; Philips Medical Systems) equipped with a 3.5-MHz transducer according to the recommendations of the American Society of Echocardiography.9
LVEF was calculated using the modified biplane Simpson’s rule from apical imaging planes. The severity of mitral regurgitation (MR) was assessed semiquantitatively according to regurgitant area and orifice width using the color-flow Doppler images at the parasternal long-axis.
CRT Implantation
The LV lead was inserted transvenously via the subclavian route. A coronary sinus venogram was obtained using a balloon catheter, and the LV pacing lead was inserted through the coronary sinus with the help of an 8-F or 9-F guiding catheter and positioned as far as possible in the venous system, preferably in the lateral or posterolateral vein. The atrial and right ventricular (RV) leads were placed regularly at the right atrial appendage and the RV apex. All leads were connected to a dual-chamber biventricular implantable cardiac device. The decision to use a CRT device with defibrillator function (CRT-D) was based on primary or secondary prevention for episodes of sustained ventricular tachycardia or inducible ventricular arrhythmia. The atrioventricular interval was optimized using Ritter’s method with transthoracic echocardiography. The final LV lead position was categorized as basal, mid-ventricular, or apical using postero-anterior projection and anterior, posterior, or lateral using the lateral chest radiographs obtained the day after CRT implantation. On baseline evaluation, the conduction time from the RV-to-LV pacing site was measured as the time interval between spontaneous peak R waves of the same QRS complex, recorded through the RV and LV electrograms. Percent biventricular pacing was calculated as the percent of ventricular beats paced and then collected using pacing and sensing histograms via device interrogation at 6-month follow-up.
Statistical Analysis
Continuous data are presented as mean±SD, and dichotomous data are expressed as number (percentage). Comparison of continuous variables between 4 different BMI categories was performed with 1-way analysis of variance (ANOVA) with Bonferroni post-hoc testing. Chi-squared test or Fisher’s exact test were used to compare dichotomous data. Survival was evaluated using the Kaplan-Meier method, and log-rank test was utilized to compare the survival curves. The annual event rate was calculated as the number of adverse clinical events divided by the average follow-up years. Univariate binary logistic regression analysis was utilized to evaluate the relationship between baseline characteristics and response to CRT. All variables that had a statistically significant effect at the 0.05 level were considered for multivariate binary logistic regression analysis. Univariate analysis and multivariate regression using Cox proportional hazards model were carried out for all-cause mortality and the combined endpoint of all-cause mortality or HF hospitalization. Covariates included for adjustment in multivariate models were age, gender, ischemic cardiomyopathy, diabetes mellitus, hypertension, hypercholesterolemia, pulmonary arterial hypertension (PAH), left bundle branch block (LBBB), LVEF, MR severity, serum blood urea nitrogen and creatinine, and baseline use of β-blocker, angiotensin-converting enzyme inhibitor and angiotensin receptor blocker (ACEI/ARB) and statin. BMI was used as continuous and categorical variables in the models respectively. All analysis was done using SPSS for Windows, version 16.0 (SPSS, Chicago, IL, USA). Two-sided P<0.05 was considered statistically significant.
Results
Baseline Characteristics
A total of 247 consecutive patients were included. Of those, 166 (67.2%) were male. The average age was 59.2±10.7 years. Patients had severely depressed cardiac function with a mean LVEF of 28±7%. All the patients had an average BMI of 24.4±3.9 kg/m2, ranging from 13.7 to 39.4 kg/m2, who were further divided into 4 groups according to BMI on admission. Comparison of baseline demographic and clinical characteristics in HF patients treated withy CRT according to admission BMI is detailed in
Table 1. Relative to underweight and normal weight patients (BMI <18.5 kg/m2
and 18.5–24 kg/m2, respectively), patients with overweight and obesity (BMI 24–28 kg/m2
and ≥28 kg/m2, respectively) were more likely to be male, have higher BSA and more LBBB, and experience earlier presentation of HF-related symptoms. Obesity-related illness (eg, diabetes mellitus, systemic hypertension, and hypercholesterolemia) and the baseline use of ACEI/ARB, β-blocker and statin were more prevalent in overweight and obese patients. In addition, patients who were overweight and obese had higher systolic and diastolic blood pressure as well as hemoglobin. The prevalence of PAH, and plasma N-terminal pro-brain natriuretic peptide (NT-proBNP) concentration and grade of MR severity, however, were higher in underweight and normal weight patients.
Table 1.
Baseline Subject Characteristics vs. Admission BMI
| |
Overall |
Underweight
(BMI <18.5 kg/m2) |
Normal weight
(18.5≤BMI<24.0 kg/m2) |
Overweight
(24.0≤BMI<28.0 kg/m2) |
Obese (BMI
≥28.0 kg/m2) |
P-value |
| n |
247 |
24 |
98 |
88 |
37 |
|
| Demographics |
| Age at implantation (years) |
59.2±10.7 |
62.0±11.9 |
59.7±10.5 |
58.8±10.8 |
57.1±10.2 |
0.333 |
| Male |
166 (67.2) |
13 (54.2) |
56 (57.1) |
70 (79.5) |
27 (73.0) |
0.004 |
| History of HF (years) |
5.2±4.7 |
7.5±6.0 |
5.9±5.8 |
4.5±3.2 |
3.3±2.2 |
0.001 |
| SBP (mmHg) |
113.8±16.8 |
109.8±20.2 |
113.1±17.8 |
112.7±13.4 |
120.9±18.0 |
0.036 |
| DBP (mmHg) |
70.8±10.7 |
66.1±13.7 |
71.0±10.3 |
70.4±8.5 |
74.4±12.8 |
0.027 |
| BMI (kg/m2) |
24.4±3.9 |
17.8±1.3 |
22.2±1.2 |
25.9±1.2 |
30.9±2.1 |
<0.001 |
| BSA (m2) |
1.78±0.20 |
1.53±0.14 |
1.67±0.14 |
1.86±0.13 |
2.00±0.16 |
<0.001 |
| NYHA class |
3.2±0.4 |
3.3±0.5 |
3.2±0.4 |
3.2±0.4 |
3.1±0.3 |
0.232 |
| LBBB |
200 (81.0) |
18 (75.0) |
83 (84.7) |
65 (73.9) |
35 (94.6) |
0.024 |
| QRS duration (ms) |
158±20 |
159±19 |
159±20 |
156±20 |
157±19 |
0.654 |
| Comorbidities |
| Ischemic cardiomyopathy |
60 (24.3) |
3 (12.5) |
19 (19.4) |
26 (29.5) |
12 (32.4) |
0.124 |
| Hypertension |
85 (34.4) |
3 (12.5) |
32 (32.7) |
30 (34.1) |
20 (54.1) |
0.009 |
| Hypercholesterolemia |
86 (34.8) |
5 (20.8) |
31 (31.6) |
29 (33.0) |
21 (56.8) |
0.014 |
| Diabetes mellitus |
65 (26.3) |
4 (16.7) |
26 (26.5) |
18 (20.5) |
17 (45.9) |
0.017 |
| Atrial fibrillation |
19 (7.7) |
1 (4.2) |
6 (6.1) |
11 (12.5) |
1 (2.7) |
0.241 |
| PAH |
59 (23.9) |
9 (37.5) |
29 (29.6) |
14 (15.9) |
7 (18.9) |
0.049 |
| Echocardiography |
| LVEF (%) |
28±7 |
26±6 |
28±7 |
28±7 |
28±7 |
0.403 |
| LAD (mm) |
44±7 |
41±9 |
44±8 |
45±7 |
45±7 |
0.127 |
| LVEDD (mm) |
71±9 |
72±7 |
70±10 |
72±9 |
72±10 |
0.384 |
| MR grade |
2.4±0.9 |
3.0±0.7 |
2.4±1.0 |
2.4±0.8 |
2.1±1.2 |
0.004 |
| LV lead position on chest X-ray |
| Short-axis view |
| Lateral |
129 (52.2) |
13 (54.2) |
46 (46.9) |
51 (58.0) |
19 (51.4) |
0.512 |
| Posterior |
97 (39.3) |
7 (29.2) |
43 (43.9) |
32 (36.4) |
15 (40.5) |
0.525 |
| Anterior |
21 (8.5) |
4 (16.7) |
9 (9.2) |
5 (5.7) |
3 (8.1) |
0.388 |
| Long-axis view |
| Basal |
53 (21.5) |
7 (29.2) |
31 (31.6) |
13 (14.8) |
2 (5.4) |
0.002 |
| Mid-ventricular |
185 (74.9) |
14 (58.3) |
66 (67.3) |
72 (81.8) |
33 (89.2) |
0.005 |
| Apical |
9 (3.6) |
3 (12.5) |
1 (1.0) |
3 (3.4) |
2 (5.4) |
0.054 |
| RV-to-LV interval (ms) |
85.3±37.5 |
85.0±38.8 |
80.2±36.2 |
89.2±38.4 |
89.5±38.1 |
0.361 |
| Biventricular pacing during follow-up (%) |
98.3±1.5 |
98.0±1.5 |
98.0±1.7 |
98.6±1.2 |
98.5±1.3 |
0.024 |
| Weight trend during follow-up (kg) |
−1.5±2.6 |
1.9±2.0 |
−1.5±1.9 |
−2.0±2.3 |
−2.3±3.8 |
<0.001 |
| Laboratory results |
| Serum creatinine (mg/dl) |
1.1±0.5 |
1.1±0.4 |
1.1±0.5 |
1.2±0.5 |
1.1±0.3 |
0.736 |
| BUN (mmol/L) |
8.6±3.8 |
8.8±3.5 |
9.3±4.5 |
8.1±3.2 |
8.0±2.8 |
0.113 |
| eGFR (ml·min–1·1.73 m–2) |
73.5±25.7 |
72.3±26.5 |
72.3±28.6 |
73.9±24.2 |
76.3±21.1 |
0.866 |
| Hemoglobin (g/L) |
135.7±14.3 |
128.6±11.1 |
134.2±14.4 |
137.3±14.3 |
140.5±14.3 |
0.011 |
| NT-proBNP (pmol/L) |
2,128.8±1,717.9 |
2,880.8±1,760.0 |
2,421.3±1,813.0 |
1,915.5±1,699.9 |
1,439.5±1,096.9 |
0.003 |
| hsCRP (mg/L) |
4.2±4.5 |
4.4±4.8 |
3.7±4.0 |
4.4±4.7 |
5.1±4.9 |
0.453 |
| Medication |
| ACEI or ARB |
175 (70.9) |
10 (41.7) |
67 (68.4) |
66 (75.0) |
32 (86.5) |
0.001 |
| β-blockers |
223 (90.3) |
16 (66.7) |
86 (87.8) |
85 (96.6) |
36 (97.3) |
<0.001 |
| Digoxin |
179 (72.5) |
18 (75.0) |
65 (66.3) |
70 (79.5) |
26 (70.3) |
0.236 |
| Amiodarone |
57 (23.1) |
6 (25.0) |
20 (20.4) |
23 (26.1) |
8 (21.6) |
0.814 |
| Statin |
87 (35.2) |
2 (8.3) |
28 (28.6) |
37 (42.0) |
20 (54.1) |
0.001 |
Data given as n (%) or mean±SD. ACEI, angiotensin-converting enzyme inhibitor; ARB, angiotensin receptor blocker; BMI, body mass index; BSA, body surface area; BUN, blood urea nitrogen; DBP, diastolic blood pressure; eGFR, estimated glomerular filtration rate; HF, heart failure; hsCRP, high-sensitivity C-reactive protein; LAD, left atrial diameter; LBBB, left bundle branch block; LV, left ventricular; LVEDD, left ventricular end-diastolic diameter; LVEF, left ventricular ejection fraction; MR, mitral regurgitation; NT-proBNP, N-terminal pro-brain natriuretic peptide; NYHA class, New York Heart Association functional class; PAH, pulmonary arterial hypertension; RV, right ventricle; SBP, systolic blood pressure.
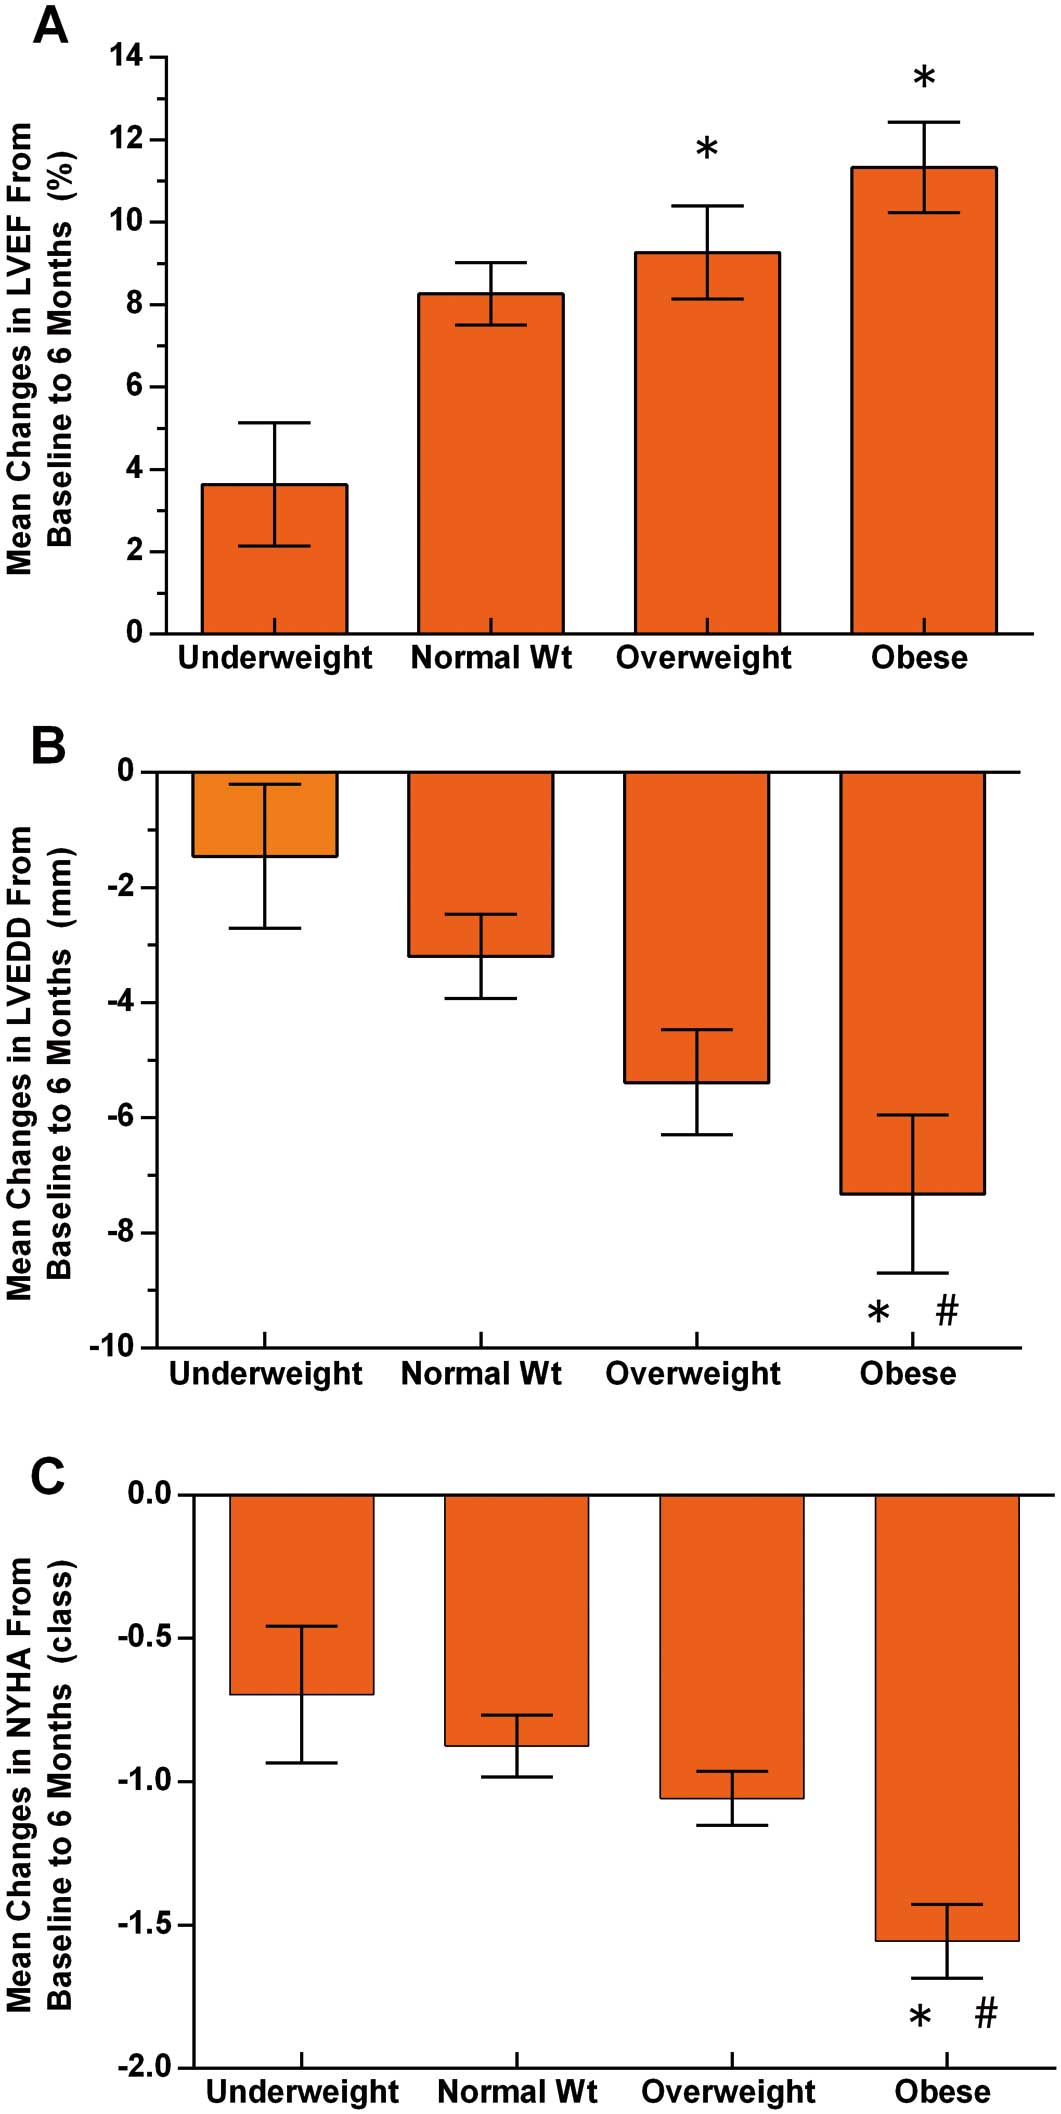
The relationship between BMI and LV reverse remodeling from baseline to 6 months is shown in
Figure 1. Compared to underweight and normal weight patients, the overweight and obese patients experienced more significant improvements, that is, reduction in LVEDD and NYHA class as well as increase in LVEF (overall P=0.007, P=0.002 and P=0.005, respectively). In addition, response rate in the 4 BMI categories was assessed (Figure 2). Significantly fewer patients in the underweight (33.3%) and normal weight (52.2%) group had echocardiographic and clinical response to CRT at 6-month follow-up as compared with the overweight (77.1%) and obese (82.9%) groups (overall P<0.001; P=0.002 for obese vs. normal weight; P=0.001 for overweight vs. normal weight; P<0.001 for obese vs. underweight; and P<0.001 for overweight vs. underweight). No difference in the rate of response to CRT, however, was observed between the underweight and normal weight (P=0.100) groups as well as the overweight and obese (P=0.485) groups.
Baseline parameters were evaluated on univariate and multivariate analysis in order to assess their ability to predict a positive response to CRT (Table 2). After adjusting for confounding factors including age, ischemic cardiomyopathy, QRS duration, LBBB, PAH, weight trend, percent biventricular pacing, RV-to-LV interval, LV lead in anterior vein and apical segment, baseline BMI was identified as an independent predictor of CRT response (odds ratio, 1.19; 95% confidence interval [CI]: 1.06–1.34, P=0.003).
Table 2.
Predictors of Response to CRT
| |
Univariate |
Multivariate |
| OR (95% CI) |
P value |
OR (95% CI) |
P value |
| Age |
0.97 (0.95–0.99) |
0.028 |
1.00 (0.96–1.03) |
0.875 |
| Male |
0.78 (0.44–1.38) |
0.395 |
– |
– |
| Ischemic cardiomyopathy |
0.45 (0.24–0.84) |
0.012 |
0.19 (0.08–0.47) |
<0.001 |
| QRS duration |
1.02 (1.00–1.03) |
0.010 |
1.04 (1.01–1.06) |
0.001 |
| LBBB |
3.24 (1.65–6.37) |
0.001 |
1.20 (0.44–3.31) |
0.718 |
| NYHA class |
0.61 (0.32–1.17) |
0.139 |
– |
– |
| LVEF |
0.98 (0.94–1.02) |
0.412 |
– |
– |
| PAH |
0.47 (0.25–0.86) |
0.015 |
0.50 (0.22–1.11) |
0.086 |
| Hypertension |
0.83 (0.48–1.45) |
0.509 |
– |
– |
| Diabetes mellitus |
0.86 (0.47–1.57) |
0.632 |
– |
– |
| BMI (per 1-kg/m2 increase) |
1.21 (1.11–1.31) |
<0.001 |
1.19 (1.06–1.34) |
0.003 |
| Weight trend (per 1-kg decrease) |
1.20 (1.08–1.33) |
0.001 |
1.26 (1.07–1.47) |
0.005 |
| Percent biventricular pacing (per 1% increase) |
1.67 (1.37–2.03) |
<0.001 |
1.55 (1.21–1.97) |
<0.001 |
| RV-to-LV interval (per 10-ms increase) |
1.02 (1.00–1.02) |
<0.001 |
1.03 (1.02–1.04) |
<0.001 |
| LV lead in lateral vein |
1.26 (0.74–2.15) |
0.400 |
– |
– |
| LV lead in posterior vein |
1.52 (0.87–2.67) |
0.139 |
– |
– |
| LV lead in anterior vein |
0.15 (0.05–0.42) |
<0.001 |
0.38 (0.07–2.09) |
0.266 |
| LV lead in basal segment |
1.13 (0.59–2.18) |
0.714 |
– |
– |
| LV lead in mid-ventricular segment |
1.29 (0.70–2.37) |
0.409 |
– |
– |
| LV lead in apical segment |
0.15 (0.03–0.74) |
0.020 |
0.19 (0.02–2.31) |
0.192 |
CRT, cardiac resynchronization therapy; OR, odds ratio. Other abbreviations as in Table 1.
Clinical outcome of patients with CRT according to BMI is listed in
Table 3. During a mean follow-up of 29.4±31.2 months, there were 33 deaths (13.4%), of which 25 were HF related, 5 were sudden deaths and 3 were due to non-cardiac cause. In addition, 4 patients (1.6%) underwent heart transplantation and 70 patients (28.3%) were hospitalized for worsening HF. A total of 75 patients (30.4%) experienced the combined endpoint of death or HF hospitalization. The annual all-cause mortality in underweight patients was approximately 11.7%, and declined stepwise to 7.6%, 3.4% and 2.0% in normal weight, overweight and obese patients, respectively (overall P=0.031). Moreover, the annual combined endpoint events of death or HF hospitalization was also highest in underweight patients (26.6%), intermediate in normal weight (16.1%), and lowest in overweight and obese patients (7.7% and 7.0%, respectively, overall P<0.001). On univariate analysis, event-free survival was highest among obese subjects, followed by overweight, normal weight and underweight patients both for all-cause mortality or the combined endpoint of death or HF hospitalization (Figure 3).

Table 3.
Clinical Outcome of CRT According to BMI
| |
Overall |
Underweight
(BMI <18.5 kg/m2) |
Normal weight
(18.5≤BMI<24.0 kg/m2) |
Overweight
(24.0≤BMI<28.0 kg/m2) |
Obese (BMI
≥28.0 kg/m2) |
P-value |
| n |
247 |
24 |
98 |
88 |
37 |
|
| All-cause mortality |
33 (13.4) |
7 (29.2) |
16 (16.3) |
8 (9.1) |
2 (5.4) |
0.031 |
| HF-related death |
25 (9.7) |
4 (16.7) |
11 (11.2) |
8 (9.1) |
2 (5.4) |
0.506 |
| SCD |
5 (2.0) |
1 (4.2) |
4 (4.1) |
0 (0.0) |
0 (0.0) |
0.133 |
| Non-cardiac cause |
3 (1.2) |
2 (8.3) |
1 (1.0) |
0 (0.0) |
0 (0.0) |
0.035 |
Combined endpoint
events |
75 (30.4) |
16 (66.7) |
34 (34.7) |
18 (20.5) |
7 (18.9) |
<0.001 |
HF-related
hospitalization |
70 (28.3) |
13 (54.2) |
29 (29.6) |
20 (22.7) |
8 (21.6) |
0.017 |
Heart
transplantation |
4 (1.6) |
0 (0.0) |
1 (1.0) |
1 (1.1) |
2 (5.4) |
0.350 |
Years of follow-up,
months |
29.4±31.2 |
30.1±35.0 |
25.9±27.0 |
31.9±33.3 |
32.3±33.8 |
0.554 |
Data given as n (%) or mean±SD. SCD, sudden cardiac death. Other abbreviations as in Tables 1,2.
On Cox regression modeling (Table 4), when treated as a continuous covariate, high BMI was associated with decreased all-cause mortality (hazard ratio [HR], 0.88 for every 1-kg/m2
increase in BMI; 95% CI: 0.80–0.97; P=0.009) in an unadjusted model, but also in a multivariate (adjusted for age, gender, comorbidities and medications) model (HR, 0.88; 95% CI: 0.77–0.99; P=0.040). Furthermore, BMI was also associated with the combined endpoint of death or HF hospitalization on both unadjusted (HR, 0.90; 95% CI: 0.84–0.95; P<0.001) and adjusted analysis (HR, 0.87; 95% CI: 0.80–0.94; P=0.001). When assessed as a category variable, after multivariate adjustment, underweight were identified as an independent predictor for the combined endpoint of death or HF hospitalization (HR, 2.29; 95% CI: 1.15–4.56; P=0.018) while overweight and obesity were associated with a lower risk of adverse clinical events and were not associated with a higher risk of all-cause mortality (HR, 0.34; 95% CI: 0.13–0.90; P=0.030; and HR, 0.42; 95% CI: 0.09–1.94; P=0.268, respectively) or combined endpoint events (HR, 0.48; 95% CI: 0.25–0.92; P=0.027 and HR, 0.62; 95% CI: 0.26–1.45; P=0.281, respectively) as compared to the normal weight category.
Table 4.
Predictors of Mortality and HF Hospitalization According to Admission BMI
| |
Univariate HR
(95% CI) |
P-value |
Multivariate HR
(95% CI) |
P-value |
| All-cause mortality |
| BMI category |
| Underweight (BMI <18.5 kg/m2) |
1.73 (0.71–4.22) |
0.227 |
1.86 (0.67–5.13) |
0.234 |
| Normal weight (18.5≤BMI<24.0 kg/m2) |
1.00 (reference) |
1.00 (reference) |
| Overweight (24.0≤BMI<28.0 kg/m2) |
0.47 (0.20–1.09) |
0.078 |
0.34 (0.13–0.90) |
0.030 |
| Obese (BMI ≥28.0 kg/m2) |
0.28 (0.07–1.24) |
0.093 |
0.42 (0.09–1.94) |
0.268 |
| BMI (continuous, per 1-kg/m2 increase) |
0.88 (0.80–0.97) |
0.009 |
0.88 (0.77–0.99) |
0.040 |
| All-cause mortality or HF hospitalization |
| BMI category |
| Underweight (BMI <18.5 kg/m2) |
1.88 (1.03–3.41) |
0.038 |
2.29 (1.15–4.56) |
0.018 |
| Normal weight (18.5≤BMI<24.0 kg/m2) |
1.00 (reference) |
1.00 (reference) |
| Overweight (24.0≤BMI<28.0 kg/m2) |
0.54 (0.30–0.96) |
0.034 |
0.48 (0.25–0.92) |
0.027 |
| Obese (BMI ≥28.0 kg/m2) |
0.55 (0.25–1.25) |
0.152 |
0.62 (0.26–1.45) |
0.281 |
| BMI (continuous, per 1-kg/m2 increase) |
0.90 (0.84–0.95) |
<0.001 |
0.87 (0.80–0.94) |
0.001 |
Multivariate Cox regression analysis adjusted for age, gender, ischemic cardiomyopathy, diabetes mellitus, hypertension, hypercholesterolemia, PAH, LBBB, LVEF, MR severity, serum BUN and creatinine, and baseline use of β-blockers, ACEI/ARB and statin. CI, confidence interval; HR, hazard ratio. Other abbreviations as in Table 1.
Discussion
The most important finding of the present study can be summarized as follows: overweight and obese HF patients had better LV reverse remodeling and a higher rate of response to CRT compared to underweight and normal weight patients. The positive correlation between baseline BMI and response to CRT was confirmed. When combined in a multivariate model, high BMI was a strong independent predictor of favorable clinical outcome in advanced HF patients after CRT implantation. Overweight and obese patients had better long-term prognosis after CRT as compared with underweight and normal weight, underscoring the “obesity paradox” in patients undergoing CRT. To the best of our knowledge, the present study is the first to report improved survival in CRT patients with increasing BMI in a relatively large Chinese CRT cohort.
As is known, BMI is a surrogate measure of body fat (BF), and is now most commonly used to estimate body composition and identify overweight and obese patients. In the current study, considering that the average BMI in China is much lower than that of the Western and US population, we used the native recommended classification rather than the criteria stratified by World Health Organization guidelines.10
After using 24 and 28 kg/m2
as the cut-offs, a total of 125 patients (50.6%) with HF were classified as overweight or obese in the present study. A significant association between BMI at baseline and cardiac reverse remodeling at 6 months of CRT was found. The normal weight and underweight patients had a limited degree of LV reverse remodeling in terms of changes in LVEDD, LVEF as well as NYHA after CRT, and also the proportion of responders was as low as 52% and 33% among these 2 groups, respectively. In contrast, overweight and obese patients had significantly more favorable LV reverse remodeling and were more likely respond to CRT (responders 77% and 83%, respectively). It is worth mentioning that no significant differences were observed either in the degree of LV reverse remodeling or the rate of response to CRT between overweight and obese as well as normal weight and underweight CRT patients. In addition, baseline BMI was an independent predictor of response to CRT on multivariate analysis. Consequently, considering these findings, BMI should be assessed among eligible candidates for CRT in order to improve the response to CRT.
On multivariate Cox analysis, after adjustment for confounding factors, underweight was significantly associated with higher risk of combined endpoint of death or HF readmission compared with normal weight, while overweight and obesity were not associated with an increased risk of adverse clinical events. As expected, the present finding that overweight or obesity was associated with substantially reserved cardiac function and subsequent improved survival compared to normal weight and underweight in advanced HF with CRT is consistent with the obesity paradox phenomenon.5,11
Perhaps the most important question raised by the present study is through which mechanism does adiposity affect the response to CRT and subsequent clinical outcome. Compared with underweight and normal weight CRT patients, the higher rate of response to CRT and subsequent favorable survival in overweight and obese patients may be attributed to the following 4 aspects. First, non-response factors. In the present study, underweight and normal weight patients had significantly more risk factors for non-response to CRT, such as non-LBBB, PAH and MR severity, than overweight and obese patients. The MADIT-CRT and CARE-HF trials confirmed that non-LBBB QRS pattern including right bundle-branch block or intraventricular conduction disturbances as well as more severe MR before CRT were associated with an increased risk of all-cause mortality or unplanned cardiovascular hospitalizations.12,13
In addition, elevated baseline pulmonary artery systolic pressure in patients who underwent CRT was also associated with worse LV remodeling, all-cause mortality and HF admission.14
Furthermore, overweight and obese individuals experienced significant weight loss compared with the underweight and normal weight patients in the present study. On multivariate analysis, weight loss was independently associated with a positive response to CRT and might predict improved clinical outcome. Second, HF clinical course. Overweight and obese patients in the present study were more likely to have a history of antecedent hypertension, hypercholesterolemia, diabetes mellitus and only a trend toward ischemic cardiomyopathy compared to the underweight and normal weight patients. Apart from excess body weight, the aforementioned concomitant comorbidity burden predisposed overweight and obese patients to increased symptoms and functional impairment, and consequently present at an early stage in their chronic HF course. Notably, the time from onset of HF signs to CRT implantation in the present study was shorter in overweight and obese patients compared with the underweight and normal weight patients. A recent retrospective study showed that clinical outcome, instead of LV reverse remodeling, was better in patients with early CRT implantation compared with those undergoing implantation later in their disease course.15
Third, optimized medication. In the present study, patients in the overweight and obese groups maintained significantly higher blood pressure (including systolic and diastolic blood pressures), and also had a more beneficial attenuated response to the rennin-angiotensin-aldosterone system than those in the underweight and normal weight groups.16
In the present study the overweight and obese individuals were more likely to tolerate higher doses and more optimized management of cardioprotective medications, such as β-blocker and ACEI/ARB, which have been shown to reduce mortality and morbidity in patients with chronic HF. And fourth, other proposed explanations. HF has been regarded as a hypercatabolic state. Obese subjects may benefit from the increased muscle mass and greater metabolic reserve in the form of fatty tissue, whereas non-obese patients may be relatively malnourished or even suffer from unintentional weight loss resulting in cardiac cachexia, known to be associated with an important increase in mortality and HF readmission.17
Other studies have shown that obese individuals have increased serum lipoproteins, neutralizing circulating bacterial endotoxins or cytokines, which may play an anti-inflammatory role in the process of their disease.18
In addition, low adiponectin and decreased catecholamine response associated with increased BMI are linked to improved HF survival.19,20
In addition, NT-proBNP is significantly increased in HF and also predicts mortality in patients with advanced HF. Overweight and obesity, however, were commonly associated with lower circulating NT-proBNP,21
which was also observed in the present study and may further serve as a possible protective mechanism in patients treated by CRT with elevated BMI. One important implication of the present study is that HF patients with NYHA class II and ACC/AHA stage C, might derive more benefit from early CRT therapy, and HF progression might be delayed.22
These interpretations are somewhat speculative and we did not have sufficient data to support these considerations.
Study Limitations
This was a retrospective, single-center, observational study with a relatively small patient cohort, which was therefore subject to a myriad of biases, particularly selection bias and statistical power limitations. Hence, results from the current data need to be confirmed in further large-scale clinical trials. Moreover, the present study was designed to use only BMI to indirectly estimate body composition and identify overweight and obese patients, and not to assess other BMIs such as waist circumference, skinfold estimates of percent BF, or bioelectrical impedance analysis of body composition, which are less frequently used but are relatively reliable alternate techniques to define obesity.23,24
Finally, further studies are needed to elucidate the underlying pathophysiologic mechanisms of the interaction between BMI and LV reverse remodeling as well as clinical prognosis in patients undergoing CRT.
Conclusions
Overweight and obesity were significantly associated with favorable cardiac reverse remodeling and better survival as well as improved HF-related readmission in advanced HF patients after CRT implantation. These observations underscore the principle of the obesity paradox, which has also been well verified in a relatively large CRT cohort. Together these findings indicate that BMI should be considered in routine pre-CRT implant assessment, and that normal weight, and especially underweight, patients should be closely monitored after CRT implantation.
Acknowledgments
The authors have no conflicts of interest to disclose.
References
- 1.
Cleland JG, Daubert JC, Erdmann E, Freemantle N, Gras D, Kappenberger L, et al. The effect of cardiac resynchronization on morbidity and mortality in heart failure. N Engl J Med 2005; 352: 1539–1549.
- 2.
Abraham WT, Fisher WG, Smith AL, Delurgio DB, Leon AR, Loh E, et al. Cardiac resynchronization in chronic heart failure. N Engl J Med 2002; 346: 1845–1853.
- 3.
JCS Joint Working Group. Guidelines for non-pharmacotherapy of cardiac arrhythmias (JCS 2011): Digest version. Circ J 2013; 77: 249–274.
- 4.
Bax JJ, Gorcsan JR. Echocardiography and noninvasive imaging in cardiac resynchronization therapy: Results of the PROSPECT (Predictors of Response to Cardiac Resynchronization Therapy) study in perspective. J Am Coll Cardiol 2009; 53: 1933–1943.
- 5.
Lavie CJ, Alpert MA, Arena R, Mehra MR, Milani RV, Ventura HO. Impact of obesity and the obesity paradox on prevalence and prognosis in heart failure. JACC Heart Fail 2013; 1: 93–102.
- 6.
Komukai K, Minai K, Arase S, Ogawa T, Nakane T, Nagoshi T, et al. Impact of body mass index on clinical outcome in patients hospitalized with congestive heart failure. Circ J 2012; 76: 145–151.
- 7.
Zhou BF. Predictive values of body mass index and waist circumference for risk factors of certain related diseases in Chinese adults: Study on optimal cut-off points of body mass index and waist circumference in Chinese adults. Biomed Environ Sci 2002; 15: 83–96.
- 8.
White JA, Yee R, Yuan X, Krahn A, Skanes A, Parker M, et al. Delayed enhancement magnetic resonance imaging predicts response to cardiac resynchronization therapy in patients with intraventricular dyssynchrony. J Am Coll Cardiol 2006; 48: 1953–1960.
- 9.
Schiller NB, Shah PM, Crawford M, DeMaria A, Devereux R, Feigenbaum H, et al. Recommendations for quantitation of the left ventricle by two-dimensional echocardiography: American Society of Echocardiography Committee on Standards, Subcommittee on Quantitation of Two-Dimensional Echocardiograms. J Am Soc Echocardiogr 1989; 2: 358–367.
- 10.
Obesity: Preventing and managing the global epidemic: Report of a WHO consultation. World Health Organ Tech Rep Ser 2000; 894: 1–253.
- 11.
Oreopoulos A, Padwal R, Kalantar-Zadeh K, Fonarow GC, Norris CM, McAlister FA. Body mass index and mortality in heart failure: A meta-analysis. Am Heart J 2008; 156: 13–22.
- 12.
Richardson M, Freemantle N, Calvert MJ, Cleland JG, Tavazzi L. Predictors and treatment response with cardiac resynchronization therapy in patients with heart failure characterized by dyssynchrony: A pre-defined analysis from the CARE-HF trial. Eur Heart J 2007; 28: 1827–1834.
- 13.
Zareba W, Klein H, Cygankiewicz I, Hall WJ, McNitt S, Brown M, et al. Effectiveness of Cardiac Resynchronization Therapy by QRS Morphology in the Multicenter Automatic Defibrillator Implantation Trial-Cardiac Resynchronization Therapy (MADIT-CRT). Circulation 2011; 123: 1061–1072.
- 14.
Shalaby A, Voigt A, El-Saed A, Saba S. Usefulness of pulmonary artery pressure by echocardiography to predict outcome in patients receiving cardiac resynchronization therapy heart failure. Am J Cardiol 2008; 101: 238–241.
- 15.
Verbrugge FH, Dupont M, Vercammen J, Jacobs L, Verhaert D, Vandervoort P, et al. Time from emerging heart failure symptoms to cardiac resynchronisation therapy: Impact on clinical response. Heart 2013; 99: 314–319.
- 16.
Lavie CJ, Milani RV, Ventura HO. Obesity and cardiovascular disease: Risk factor, paradox, and impact of weight loss. J Am Coll Cardiol 2009; 53: 1925–1932.
- 17.
Davos CH, Doehner W, Rauchhaus M, Cicoira M, Francis DP, Coats AJ, et al. Body mass and survival in patients with chronic heart failure without cachexia: The importance of obesity. J Card Fail 2003; 9: 29–35.
- 18.
Mohamed-Ali V, Goodrick S, Bulmer K, Holly JM, Yudkin JS, Coppack SW. Production of soluble tumor necrosis factor receptors by human subcutaneous adipose tissue in vivo. Am J Physiol 1999; 277: E971–E975.
- 19.
Kistorp C, Faber J, Galatius S, Gustafsson F, Frystyk J, Flyvbjerg A, et al. Plasma adiponectin, body mass index, and mortality in patients with chronic heart failure. Circulation 2005; 112: 1756–1762.
- 20.
Yin WH, Wei J, Huang WP, Chen JW, Young MS, Lin SJ. Prognostic value of circulating adipokine levels and expressions of adipokines in the myocardium of patients with chronic heart failure. Circ J 2012; 76: 2139–2147.
- 21.
Frankenstein L, Remppis A, Nelles M, Schaelling B, Schellberg D, Katus H, et al. Relation of N-terminal pro-brain natriuretic peptide levels and their prognostic power in chronic stable heart failure to obesity status. Eur Heart J 2008; 29: 2634–2640.
- 22.
McMurray JJ, Adamopoulos S, Anker SD, Auricchio A, Bohm M, Dickstein K, et al. ESC guidelines for the diagnosis and treatment of acute and chronic heart failure 2012: The Task Force for the Diagnosis and Treatment of Acute and Chronic Heart Failure 2012 of the European Society of Cardiology. Developed in collaboration with the Heart Failure Association (HFA) of the ESC. Eur J Heart Fail 2012; 14: 803–869.
- 23.
Janssen I, Katzmarzyk PT, Ross R. Waist circumference and not body mass index explains obesity-related health risk. Am J Clin Nutr 2004; 79: 379–384.
- 24.
Lavie CJ, Osman AF, Milani RV, Mehra MR. Body composition and prognosis in chronic systolic heart failure: The obesity paradox. Am J Cardiol 2003; 91: 891–894.

