Abstract
Background:
The aim of the present study was to assess the impact of pulmonary regurgitation (PR) and right ventricle (RV) volume on left ventricle (LV) longitudinal strain (LS) in patients with surgically repaired tetralogy of Fallot (r-TOF).
Methods and Results:
The study subjects were 32 adolescent asymptomatic r-TOF subjects and 30 adolescent healthy controls. Two-dimensional (2-D) and 3-dimensional (3-D) echocardiography were performed in all subjects using Vivid E9 (GE Healthcare). On 3-D analysis, LV and RV volumes were measured using 4D auto LVEF and TomTec RV analysis. PR fraction (PRF) was calculated by the volumetric method (PRF=[RV stroke volume–LV stroke volume]/RV stroke volume). LV-LS was assessed on 2-D speckle tracking echocardiography, and “free wall LS” represented the average of 3 lateral segments. Although RVEF and LVEF were not different between the 2 groups, free wall LS (–17.1±3.2%) was reduced significantly in the r-TOF group compared to the control (–20.5±4.9%, P=0.008), and correlated with the RV variables RVEDVI, RV/LV EDVI ratio and PRF. On multivariate stepwise linear regression analysis, RVEDVI was the only risk factor for the reduction of free wall LS (P=0.004).
Conclusions:
Free wall LS was significantly reduced despite preserved LVEF. The severity of LS reduction was correlated with RV dilation even in asymptomatic r-TOF patients. (Circ J 2014; 78: 1960–1966)
The prognosis of tetralogy of Fallot (TOF) has improved markedly in recent years thanks to advances in surgical techniques; the current 30-year survival rate is estimated to be >90%.1
Late survival is excellent in Japan,2
partially because the prevalence of serious arrhythmias is low in Japanese surgically repaired TOF (r-TOF) patients as compared with Western countries.3,4
The majority of patients, however, develop a variable degree of chronic pulmonary regurgitation (PR), which sometimes leads to right ventricular (RV) volume overload and dysfunction, with potential development of ventricular arrhythmias.5–8
Left ventricular (LV) ejection fraction (EF) is another potential risk factor for morbidity and mortality.9
Furthermore, recent studies have shown that reduced LV longitudinal strain (LV-LS), determined on 2-D speckle tracking strain measurements, is another serious risk factor for mortality.10
In this regard, the aforementioned technique is not angle dependent, and not affected by tethering effects. In subjects with r-TOF and impaired RV function, LV-LS is also associated with greater risk of cardiac death/life-threatening ventricular arrhythmias.11
In addition, assessment of LV and RV dysfunction indicated a close relationship between cardiac magnetic resonance imaging (cMRI) and speckle tracking, but only a few studies have assessed RV and LV function on 2-D and 3-D transthoracic echocardiography (TTE) in r-TOF subjects.12
The aim of this study was therefore to evaluate the impact of PR and RV remodeling on LV-LS using TTE in adolescent subjects.
Methods
Patients
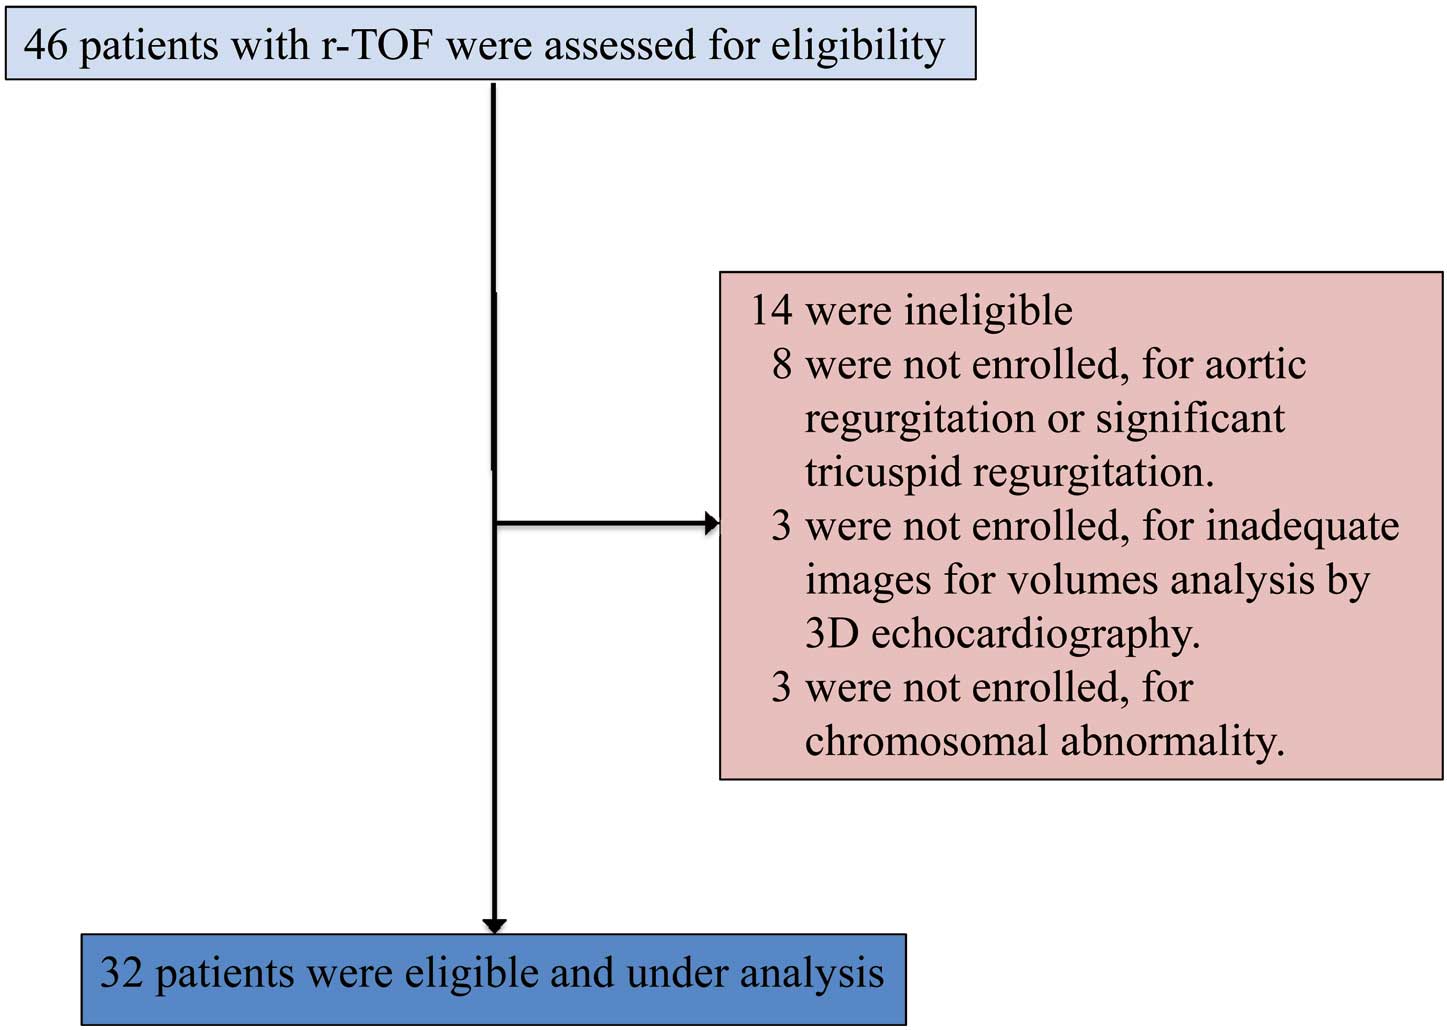
This single-center cross-sectional study included 46 asymptomatic Japanese r-TOF patients (r-TOF group) who were seen at the outpatient clinic of the University of Tsukuba, between November 2011 and June 2013. The following exclusion criteria were applied: (1) history of coronary artery disease; (2) history of persistent tachycardia; (3) history of medication for the cardiovascular system; (4) significant structural cardiac anomalies (excluding pulmonary valve abnormalities); (5) inadequate imaging for offline volume analysis; and (6) presence of chromosomal abnormality (Figure 1). All of the present patients were classified into New York Heart Association (NYHA) class 1. The study also included control subjects. Thirty healthy controls were recruited. These control subjects were followed at the outpatient clinic for non-specific chest pain and palpitations for which no organic causes were identifiable. All subjects underwent echocardiographic assessment and 12-lead electrocardiogram.
The study protocol was approved by Tsukuba University Institutional Review Board for human subjects and informed consent was obtained from the patient or guardian. We determined that at least 30 was needed in each group, because this is the minimum number to prove the statistical significance based on the Faul et al methods.13,14
TTE
Comprehensive echocardiography, including M-mode, Doppler, 2-D and 3-D echocardiography, was done in all subjects (GE Vivid E9; GE Healthcare, Tokyo, Japan). First, we recorded the peak flow velocity through the pulmonary valve, on continuous wave Doppler, to determine the severity of pulmonary stenosis (PS). Pressure gradient was calculated from the velocity using the simplified version of Bernoulli’s equation. Second, the LV long-axis function on M-mode echocardiography (MAPSE) was measured, as described in detail previously.11
Tissue Doppler echocardiography was then used to assess the lateral longitudinal myocardial velocity at the mitral annular level,15
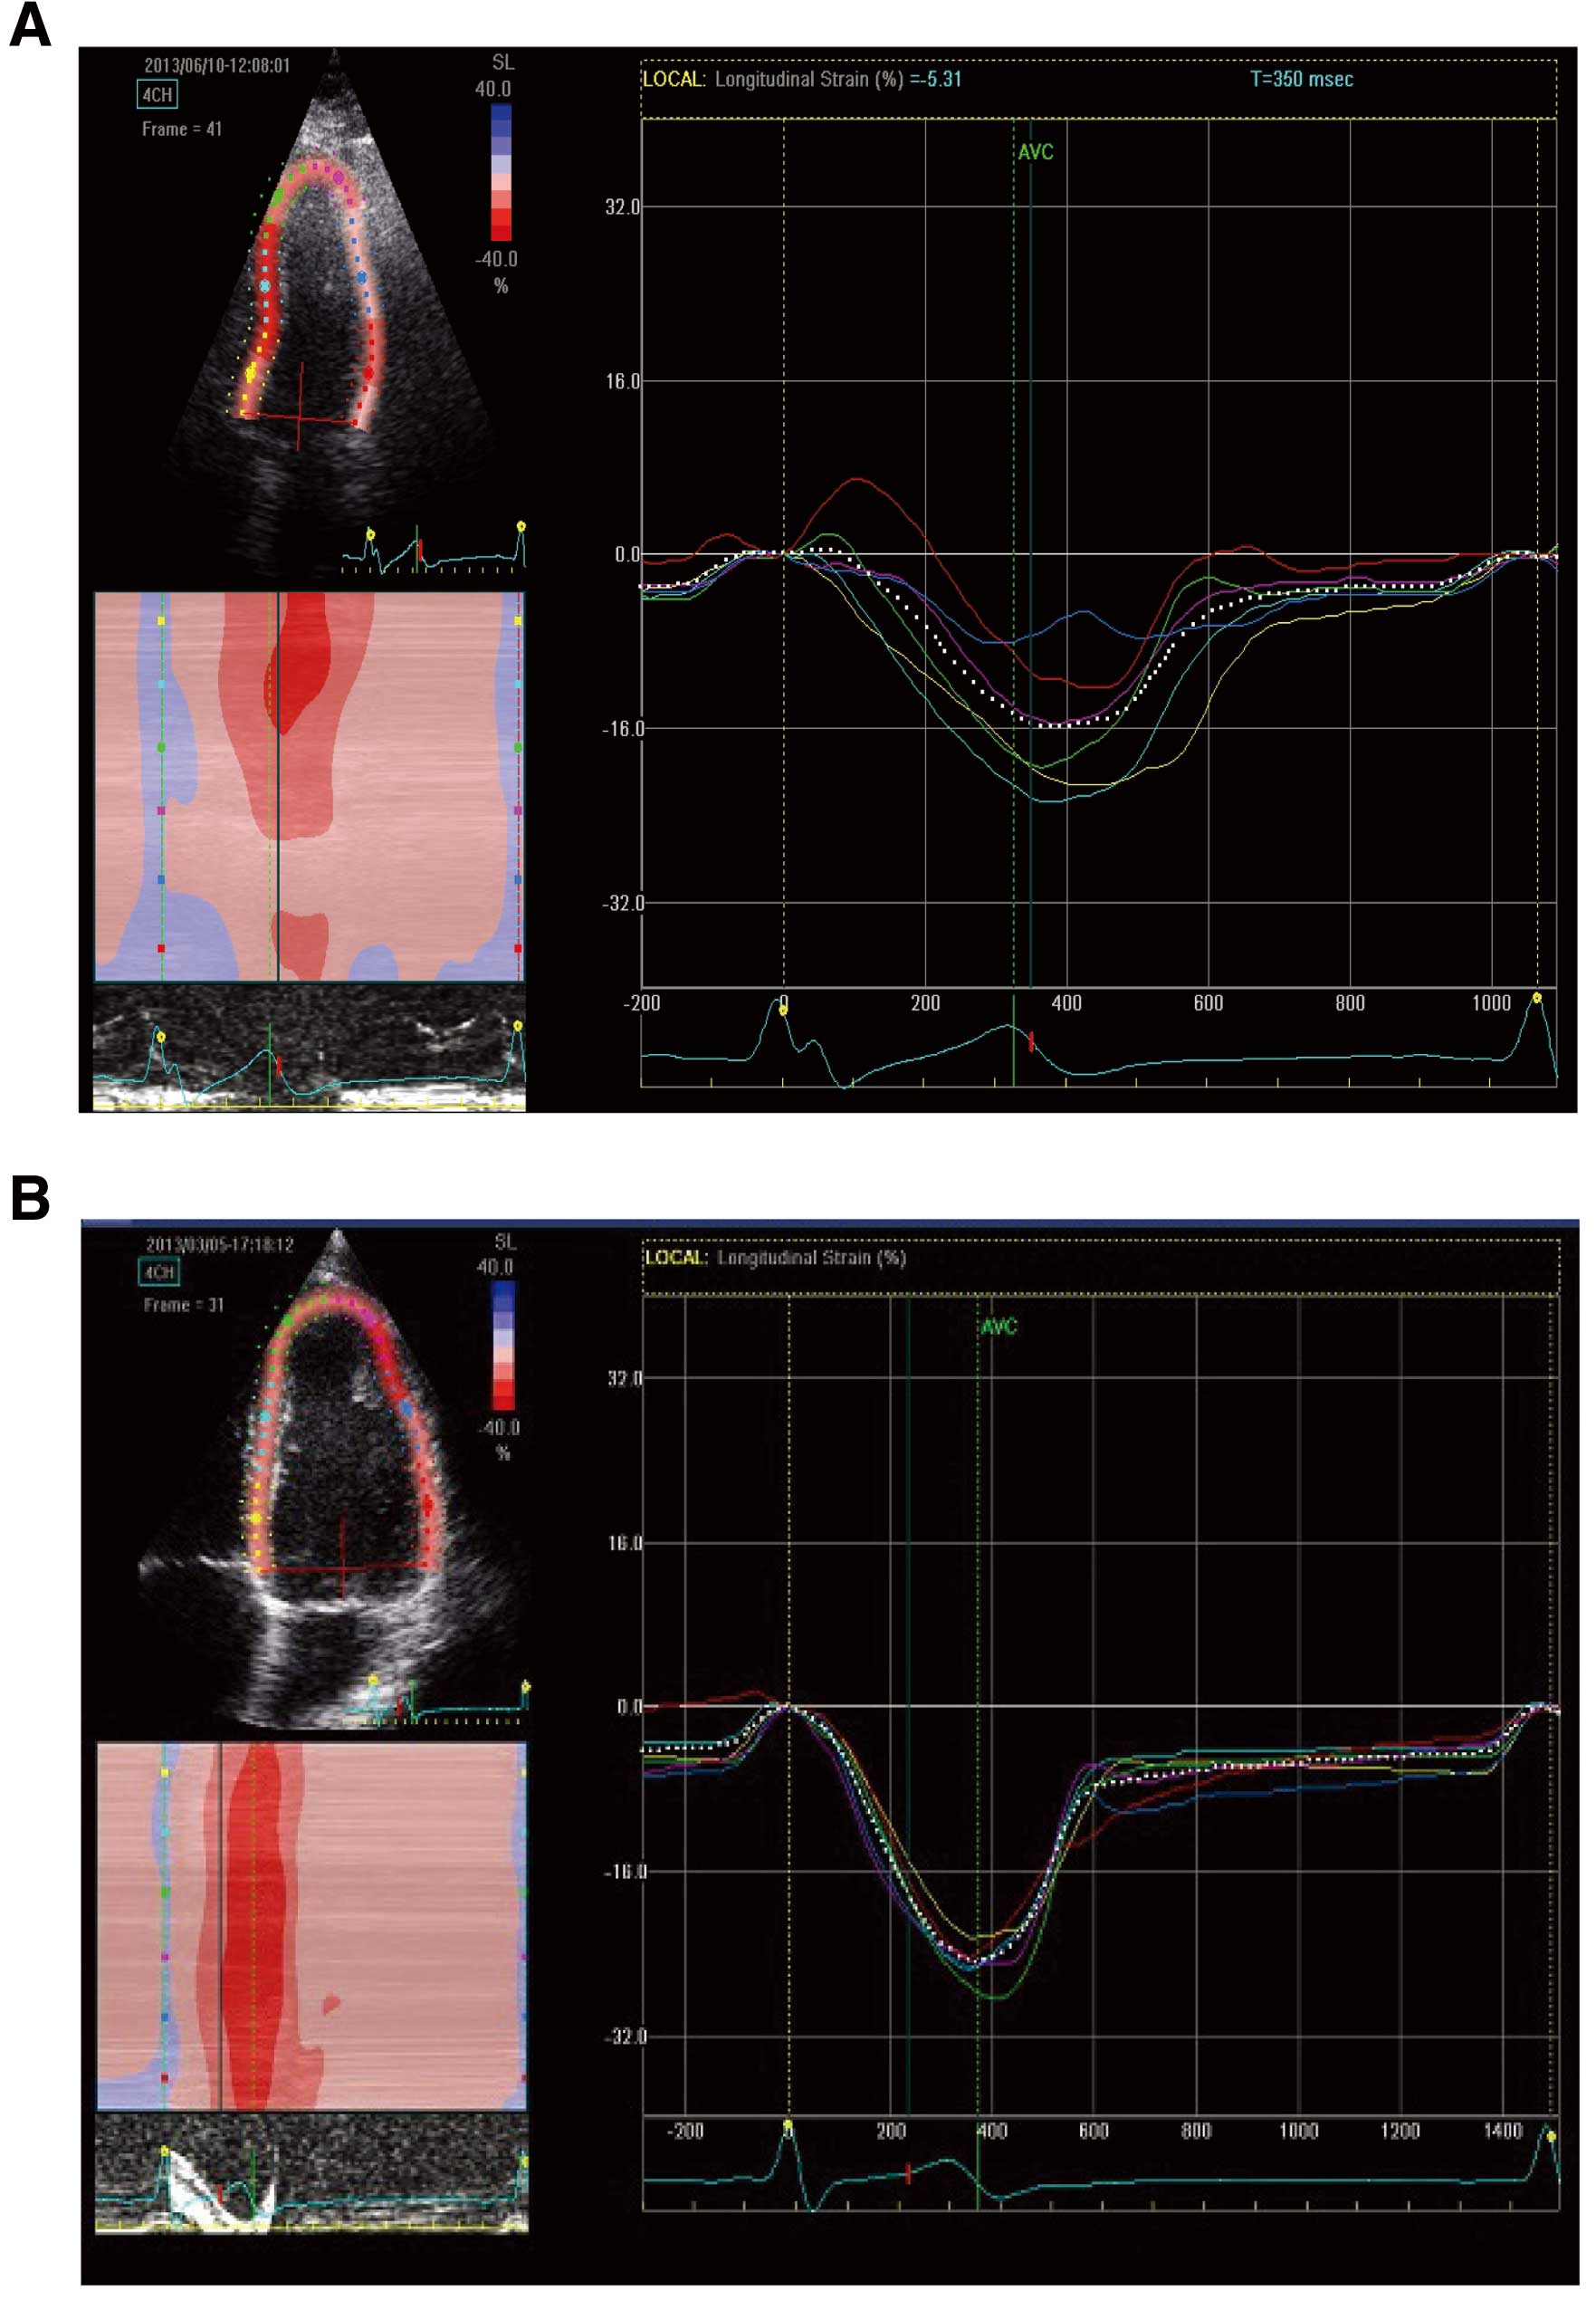
which is described as LV lateral S’. Each variable was measured in apical 4-chamber view. The cine loops for assessment of 2D LV-LS were also recorded in apical 4-chamber view by changing the transducer scan width to achieve a frame rate of at least 40/s. LV-LS was assessed on 2-D speckle tracking echocardiography (Echo Pac; GE Healthcare). The endocardial borders were traced in the end-systolic frame of the 2-D images, and speckles were tracked frame by frame throughout the LV wall during the cardiac cycle. The values were measured at 6 segments: base lateral; mid lateral; apical lateral; base septal; mid-septal; apical septal (Figure 2). In addition, we used the global longitudinal strain (GLS), which represented the average of all 6 segments; and free-wall LS as the average of the lateral 3 segments: apical lateral, mid-lateral, base lateral.
For the assessment of LV diastolic function, left atrial pressure was estimated using the algorithm recommended by the American Society of Echocardiography and European Society of Echocardiography,16
which is based on mitral inflow E- and A-wave peak velocities, early mitral annular velocities (e’), and left atrial area index. The left atrial area was measured from the apical 4-chamber view at end-diastolic phase, with manual tracing.
All 3-D echocardiographic images were acquired with a standard 4.0-MHz multi-plane transducer and ultrasound scanner adapted for 3-D image acquisition. 3-D LV and RV full-volume sweeps were acquired from apical views during end-expiratory breath-hold, when available. Especially for the RV, the probe was tilted interiorly in order to include the RV free wall and outflow in the same angle of view. The acquired images were stored in DICOM format and transferred to a separate workstation for offline data analysis. LV/RV volumes and function were analyzed using dedicated software. The 3-D data sets were analyzed as follows: each echocardiographic data set was opened with 4D auto LVEF (Echo Pac; GE) and TomTec RV. All images were viewed in sagittal, 4-chamber, and coronal views. The best possible views, containing a full-volume set, were chosen for the analysis. Each volume data set was imported into the application and manipulated by rotating, angulating, and slicing in any of the 3 displayed orthogonal planes. The software used an automated border detection algorithm with manual correction options. Measurements were made on the original full-volume echocardiographic images. The end-diastolic and end-systolic frames were chosen by visual inspection of the cine loops. The endocardial borders of the LV and RV were outlined at end-diastole and at end-systole at all levels. LV and RV trabeculations and LV papillary muscles were included within volume analysis, whereas the inter-ventricular septum was excluded from each volume assessment. At the end of the analysis, a final spatiotemporal reconstruction of the LV and RV model was created. Especially, 3-D construction images of the RV were also obtained in projections of the RV free wall, inter-ventricular septum, and outflow tract.
The software-derived functional parameters LV end-diastolic volume index (LVEDVI), LV end-systolic volume index, LV stroke volume index (LVSVI) and LVEF were measured using 4D auto LVEF. In the same way, RV end-diastolic volume index (RVEDVI), RV end-systolic volume index (RVESVI), RV stroke volume index (RVSVI) and RVEF were measured using TomTec RV analysis. Cardiac index was measured using the following formula: LVSVI×heart rate at the examination.
Calculation of PR Fraction (PRF)
The PRF was calculated using the following formula: (RVSVI–LVSVI)/RVSVI, as described previously.17
This method could not be applied to subjects with other structural heart diseases, because RVSVI and LVSVI are influenced by coexistent valvular disease or residual shunts. For this reason, we excluded from this study subjects with structural cardiac anomalies, apart from those with pulmonary valve disease.
Statistical Analysis
All data are presented as mean±SD. Comparisons between groups were made using Student’s t-test or non-parametric tests depending on data distribution. Similarly, associations among variables were explored using the Wilcoxon rank-sum test or Spearman rank correlation coefficient, as appropriate. RV variables and QRS duration with P<0.05 were entered into multivariate stepwise linear regression analysis to determine the risk factor for impairing LV free wall LS. Data were analyzed using SPSS ver. 21 (SPSS, Chicago, IL, USA). Two-tailed P<0.05 was considered statistically significant.
Results
Table 1
lists the subject characteristics. Age, gender, height, weight, body surface area and heart rate at rest were not different between the 2 groups. The age at surgery of the 32 r-TOF patients ranged from 0.5 to 7 years (2.6±1.5 years). Among them, 30 underwent surgical repair that included pulmonary transannular patch, while an external conduit was used in the remaining 2 patients. QRS duration was significantly longer in the r-TOF group (116±30.2 ms) than the control group (86.1±8.0 ms, P=0.001), but did not exceed 180 ms in any of the patients.
Table 1.
Baseline Subject Characteristics
| |
r-TOF (n=32) |
Control (n=30) |
P-value |
| Age (years) |
18.6±5.8 |
16.9±7.4 |
0.11† |
| M/F (n) |
16/16 |
16/14 |
0.81§ |
| Age at TOF repair (years) |
2.6±1.5 |
– |
– |
| Surgical procedure |
|
|
|
| Pulmonary transannular patch |
30 |
– |
– |
| External conduit repair |
2 |
– |
– |
| Height (cm) |
157±9.8 |
155±17.6 |
0.53‡ |
| Weight (kg) |
51.7±11.4 |
44.5±16.6 |
0.07‡ |
| Body surface area (m2) |
1.49±0.20 |
1.45±0.29 |
0.57‡ |
| Heart rate (beats/min) |
80.9±15.0 |
75.0±15.5 |
0.13‡ |
| QRS duration (ms) |
116±30.2 |
86.1±8.0 |
0.001† |
Data given as mean±SD. †Mann-Whitney U-test; ‡Student’s t-test; §χ2 test.
r-TOF, surgically repaired tetralogy of Fallot; TOF, tetralogy of Fallot.
Table 2
lists the results of 3D-TTE analysis of the RV and LV volumes, and the PS pressure gradient. RVEDVI, RVESVI, RVSVI and PS were significantly larger in the r-TOF group than in the control. In contrast, LVEDVI and LVSVI were significantly smaller in the r-TOF group than in the control. In addition, the PRF and RV/LV EDVI ratio were larger in the r-TOF group compared with the control. There was a positive correlation between PRF and RVEDVI (r=0.542, P<0.001), but cardiac index, RVEF and LVEF were not different between the 2 groups. In the control group, there was no significant difference between RVEDVI and LVEDVI, or between RVSVI and LVSVI (Table 2).
Table 2.
RV/LV Volumes and Function
| |
r-TOF (n=32) |
Control (n=30) |
P-value |
| RVEDVI (ml/m2) |
82.3±22.3 |
60.3±13.8 |
<0.001† |
| RVESVI (ml/m2) |
35.0±13.3 |
26.7±7.7 |
0.004‡ |
| RVSVI (ml/m2) |
47.3±11.9 |
34.3±8.0 |
<0.001† |
| RVEF (%) |
59.2±7.5 |
56.6±7.0 |
0.16‡ |
| LVEDVI (ml/m2) |
53.7±9.8 |
61.6±13.4 |
0.01‡ |
| LVESVI (ml/m2) |
23.3±5.1 |
26.8±6.3 |
0.21† |
| LVSVI (ml/m2) |
30.7±7.2 |
34.7±8.3 |
0.03† |
| LVEF (%) |
56.9±6.9 |
56.1±4.7 |
0.59‡ |
| Cardiac index (L·beats–1·min–1·m–2) |
2.25±0.99 |
2.44±0.71 |
0.31† |
| PRF |
0.33±0.17 |
–0.01±0.08 |
<0.001‡ |
| PS (mmHg) |
25.7±21.2 |
3.3±1.0 |
<0.001† |
| RV/LV EDVI ratio |
1.55±0.56 |
0.98±0.13 |
<0.001† |
Data given as mean±SD. †Mann-Whitney U-test; ‡Student’s t-test.
EF, ejection fraction; EDVI, end-diastolic volume index; ESVI, end-systolic volume index; LV, left ventricle; PRF, pulmonary regurgitation fraction; PS, pulmonary stenosis; r-TOF, surgically repaired tetralogy of Fallot; RV, right ventricle; SVI, stroke volume index.
Table 3
lists the results of 2D-TTE analysis of parameters of LV longitudinal function and diastolic function. LV free wall LS was significantly reduced in the r-TOF group than the control (Figure 3). In addition, each apical LS was reduced compared to mid- and base LS at both the lateral and septal side in the r-TOF group, unlike in the control group. In contrast, MAPSE and LV lateral S’ were not significantly different between the 2 groups. None of the parameters of LV diastolic function was significantly different between the 2 groups.
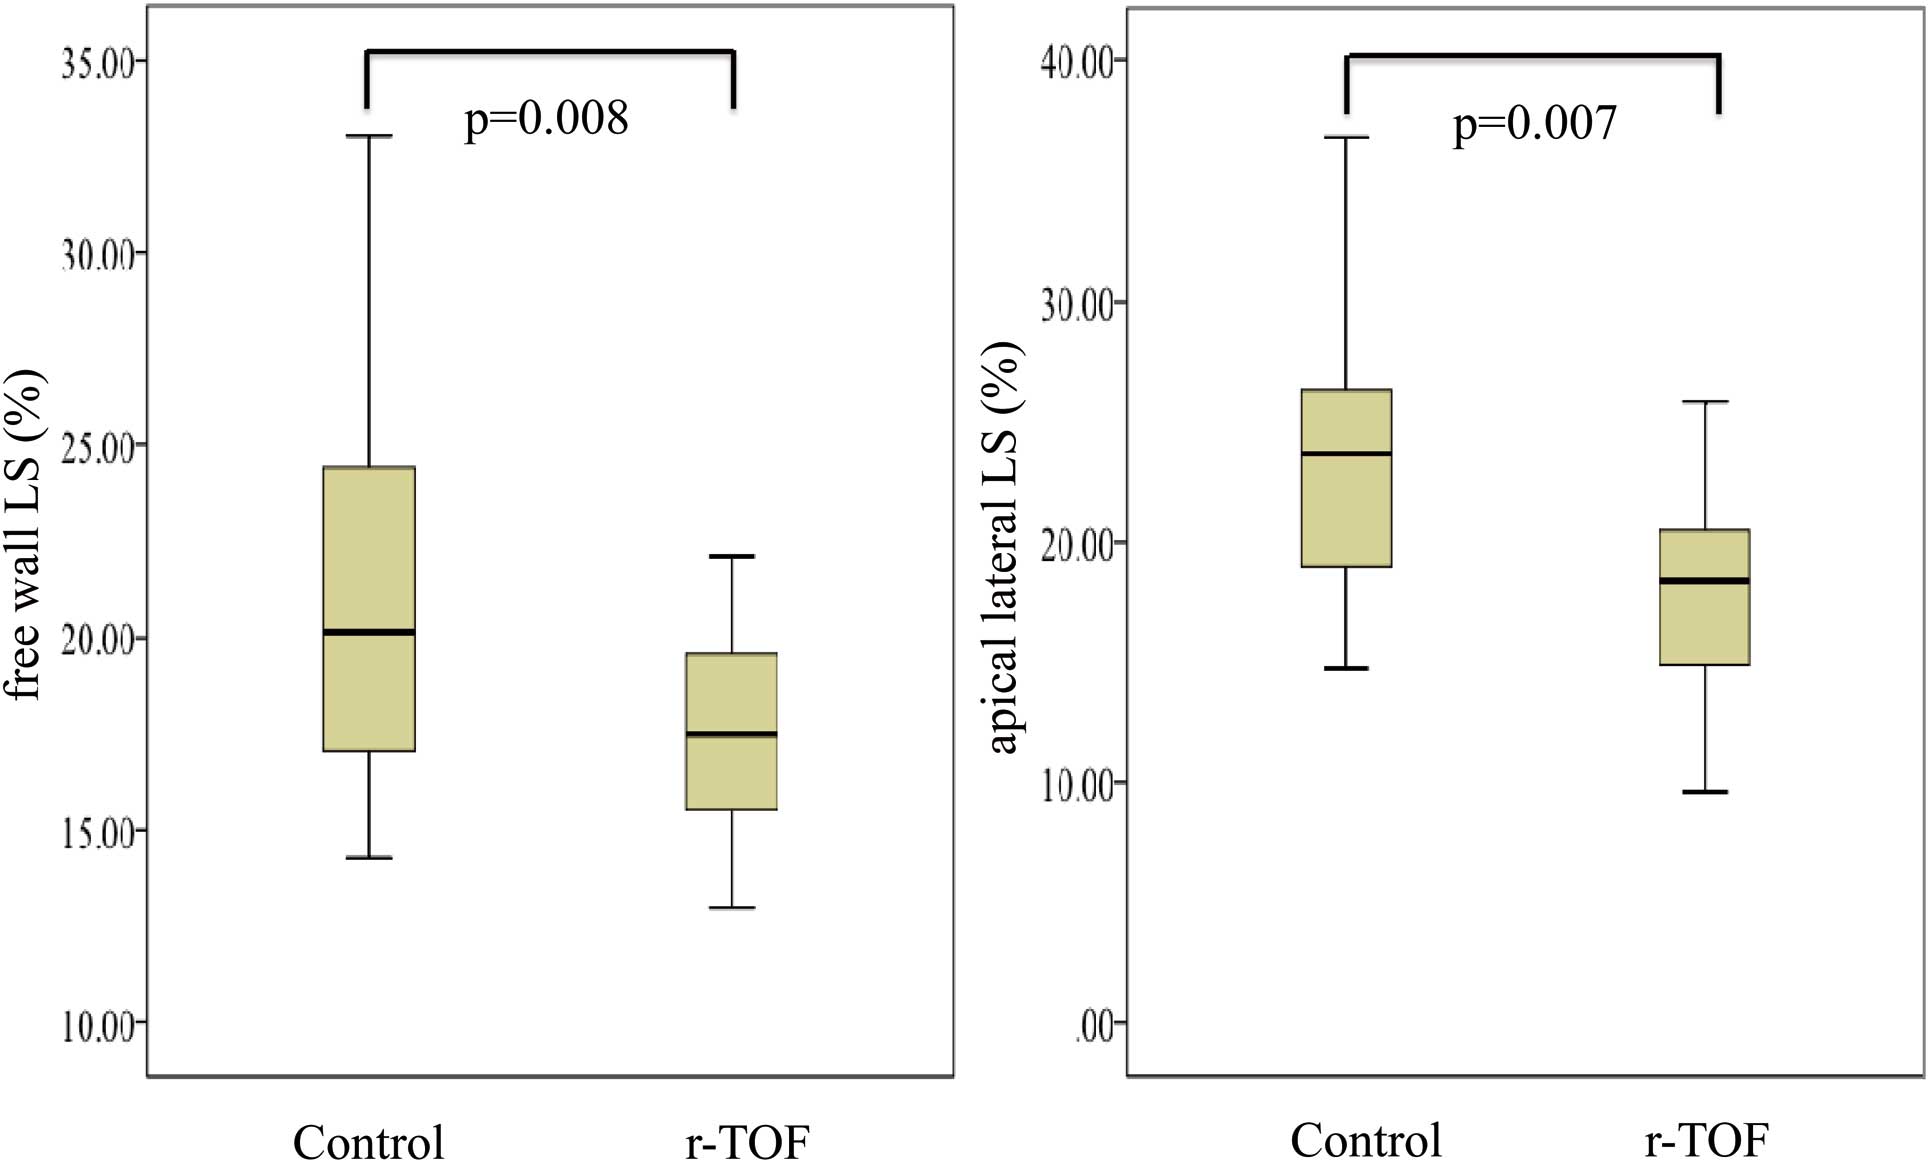
Table 3.
LV Longitudinal Strain and Diastolic Function
| |
r-TOF (n=32) |
Control (n=30) |
P-value |
| GLS (%) |
–17.7±2.9 |
–21.8±3.7 |
<0.001‡ |
| Free wall LS (%) |
–17.1±3.2 |
–20.5±4.9 |
0.008† |
| Base lateral LS (%) |
–14.6±4.4 |
–16.7±5.5 |
0.10‡ |
| Mid-lateral LS (%) |
–18.6±5.0 |
–21.9±6.0 |
0.03‡ |
| Apical lateral LS (%) |
–18.1±4.6 |
–21.6±10.4 |
0.007† |
| Base septal LS (%) |
–19.1±4.8 |
–21.2±5.1 |
0.16† |
| Mid-septal LS (%) |
–19.9±3.0 |
–23.3±3.0 |
<0.001† |
| Apical septal LS (%) |
–17.2±5.0 |
–25.7±5.0 |
<0.001† |
| MAPSE (mm) |
14.8±2.8 |
13.9±2.4 |
0.18‡ |
| LV lateral S’ velocity (cm/s) |
8.5±1.3 |
9.4±2.2 |
0.06‡ |
| E/A |
2.5±0.83 |
2.2±0.58 |
0.09‡ |
| E/e’ |
6.6±1.9 |
6.0±1.2 |
0.17‡ |
| LA area index (cm2/mm2) |
6.4±1.7 |
6.3±2.0 |
0.83† |
Data given as mean±SD. †Mann-Whitney U-test; ‡Student’s t-test.
See Table 2 for abbreviations. GLS, global longitudinal strain; LA, left atrium; LS, longitudinal strain; MAPSE, mitral annular plane systolic excursion.
Table 4
lists the correlations between RV-related factors and LV regional wall strain. LV free wall LS mildly correlated with the RV variables: RVEDVI, RV/LV EDVI ratio, PRF and PS.Table 5
presents the effect of RV variables and QRS duration on the reduction of LV free wall LS on multivariate stepwise linear regression analysis. RVEDVI was the only risk factor for impairment of LV free wall LS.
Table 4.
RV-Related Factors and LV Regional Wall Strain
| |
RVEDVI |
RV/LV EDVI ratio |
PRF |
PS |
| r |
P-value |
r |
P-value |
r |
P-value |
r |
P-value |
| GLS (%) |
0.45 |
<0.001‡ |
0.46 |
<0.001‡ |
0.43 |
0.001‡ |
0.38 |
0.004‡ |
| Free wall LS (%) |
0.38 |
0.003‡ |
0.36 |
0.005‡ |
0.29 |
0.03‡ |
0.30 |
0.02‡ |
| Base lateral LS (%) |
0.22 |
0.10‡ |
0.18 |
0.17‡ |
0.04 |
0.76‡ |
0.23 |
0.10‡ |
| Mid-lateral LS (%) |
0.30 |
0.03‡ |
0.27 |
0.04‡ |
0.23 |
0.09‡ |
0.32 |
0.02‡ |
| Apical lateral LS (%) |
0.29 |
0.03‡ |
0.41 |
0.002‡ |
0.43 |
0.001‡ |
0.19 |
0.18‡ |
| Base septal LS (%) |
0.43 |
0.001‡ |
0.19 |
0.16‡ |
0.15 |
0.25‡ |
0.14 |
0.33‡ |
| Mid-septal LS (%) |
0.45 |
<0.001‡ |
0.41 |
0.001‡ |
0.31 |
0.02‡ |
0.33 |
0.02‡ |
| Apical septal LS (%) |
0.39 |
0.003‡ |
0.57 |
<0.001‡ |
0.58 |
<0.001‡ |
0.48 |
<0.001‡ |
‡Spearman correlation t-test. See Tables 2,3 for abbreviations.
Table 5.
Significant Risk Factors for Impairment of Free Wall LS
| |
Multivariate β |
P-value |
| RVEDVI (ml/m2) |
0.38 |
0.003 |
| RV/LV EDVI ratio |
|
NS |
| PRF |
|
NS |
| PS (mmHg) |
|
NS |
| QRS duration (ms) |
|
NS |
See Tables 2,3 for abbreviations.
Discussion
In the present study it was found that LV free wall LS was reduced in r-TOF subjects, despite the absence of cardiac failure signs. The severity of LS reduction was correlated with RV dilation. Previous studies showed that RV dilation correlated with impaired LV systolic performance,14
but no study has demonstrated the relation between RV volume and LV free wall LS using TTE.
RVEDVI/SVI and LVEDVI/SVI determined on 3D-TTE were almost the same in the control group. This result was consistent with the fact that RVEDVI and LVEDVI were equivalent.18
The assessment of RV volume and function on 3D-TTE, however, remains a challenge in congenital heart disease.19–21
Therefore, we applied 3D-TTE to both RV and LV volume analysis. A good correlation was found between the SVI of the LV and RV, and a reasonable RV/LV EDVI ratio in the control group (Table 2). As for the r-TOF group, the RV/LV EDVI ratio (1.55±0.56) in the present study was similar to those in previous reports.22
Zhang et al reported that the correlations between 3-D echocardiography and cMRI measurements were acceptable.23
In our next step, we will compare RV volume obtained on 3D-TTE with that on cMRI to validate the accuracy and reproducibility.
LV-LS is available from routine TTE assessment, and GLS has been confirmed previously to be reliable, independent of the observer experience.24
In addition, LV-LS and MAPSE were reported to be the most sensitive parameters for the prediction of mortality in adults with r-TOF.25
The major finding of the present study is that LV free wall LS assessed using this method was significantly reduced, and associated with RVEDVI in adolescents with r-TOF (Tables 3, 5). Especially, each apical LS at both the lateral and septal side was reduced compared to the mid- and base LS in the r-TOF group, unlike in the control group. In contrast, MAPSE, LV lateral S’ velocity and the parameters of diastolic function were not significantly different between the 2 groups, and correlated with RV variables. Therefore, this indicates that the reduction of LV-LS would be going on gradually from apical lesion, even if the r-TOF subjects had no heart failure signs. We should follow up not only RV variables, but also LV-LS over time.
The strain at the septal wall was significantly reduced rather than that at the lateral wall in the present study (Table 3). In previous reports, it was also found that LV-LS was reduced at both the septal wall and free wall. The former was more greatly reduced than the latter, similar to the present study.26
As for RV, the RV free wall as well as the septal wall were impaired in the r-TOF subjects.27
RV remodeling due to PR, the patch used in the radical operation, and abnormal muscle fiber architecture could affect RV strain in the subjects with r-TOF.26
Additionally, impairment of LV free wall LS might be induced by hypoxemia.28
The present study, however, did not investigate the mechanisms of impaired LV dysfunction in r-TOF subjects. Previous studies have suggested that myocardial ischemia due to hypoxemia before corrective surgery might be related to LV dysfunction.28
In the present study, all the r-TOF subjects were <30 years of age, without a history of coronary events, hypertension or diabetes based on the medical records. Alternatively, other studies have suggested that myocardial fibers are shared by the 2 ventricles and that the adverse impact of septal shift was responsible for LV dysfunction, although one cannot also rule out a simple geometrical interaction between the 2 ventricles in the limited space of pericardial sac and through septal shift.29
In the present study, LVEDVI and LVSVI were significantly reduced in r-TOF, although cardiac index was preserved. To clarify the mechanism of LV dysfunction, we should take into account the impact of septal shift, radial strain (RS) and circumferential strain (CS). We must assess, however, the interaction among septal shift, LV-RS and LV-CS before assessing LV function, because the through-plane phenomenon at the short axis would cause incorrect measurement of LV-RS and CS.30
The present study focused on the impact of RV volume on LV free wall LS. Other factors, however, such as age and duration of cyanosis, were not associated with LV free wall LS in the present study. These factors could influence survival. Therefore, we need take a long-term view of the relationship between RV volume and free wall LS. Further studies are needed to identify the mechanisms of reduced LV function based on RV variables throughout the whole life of r-TOF patients.
Study Limitations
The present study had 3 major limitations. First, we did not use the gold standard method for validation of volume analysis, such as cMRI. Second, not all images obtained on 3D-TTE were appropriate for analysis. Ingenuity is needed in order to record clear 3-D echocardiography images, especially for RV analysis (eg, changes in body position, a wide angle of view and breath-holding). In the present study, we excluded 3 r-TOF patients and 2 control subjects from analysis due to poor imaging. Third, we did not apply the volumetric method for calculation of PRF in r-TOF subjects with other structural anomalies in addition to PR. In r-TOF, significant tricuspid regurgitation or aortic regurgitation could affect the outcome. We should take into account these coexisting lesions for more effective analysis of prognosis, and compare PRF obtained on 3D-TTE with that on cMRI to validate the accuracy.
Conclusions
Using 2-D and 3-D TTE, the presence of reduced LV free wall LS in asymptomatic r-TOF subjects with well-preserved LVEF was demonstrated. Longitudinal LV myocardial dysfunction will develop in association with RV remodeling.
Disclosures
The authors declare no conflict of interest.
References
- 1.
Murphy JG, Gersh BJ, Mair DD, Fuster V, McGoon MD, Ilstrup DM, et al.
Long-term outcome in patients undergoing surgical repair of tetralogy of Fallot.
N Engl J Med
1993;
329:
593–599.
- 2.
Niwa K, Hamada H, Nakazawa M, Terai M, Tateno S, Sugimoto S, et al.
Mortality and risk factors for late deaths in tetralogy of Fallot: The Japanese Nationwide Multicentric Survey.
Cardiol Young
2002;
12:
453–460.
- 3.
Miyazaki A, Sakaguchi H, Ohuchi H, Matsuoka M, Komori A, Yamamoto T, et al.
Efficacy of hemodynamic-based management of tachyarrhythmia after repair of tetralogy of Fallot.
Circ J
2012;
76:
2855–2862.
- 4.
Nakazawa M, Shinohara T, Sasaki A, Echigo S, Kado H, Niwa K, et al.
Arrhythmias late after repair of tetralogy of Fallot: A Japanese Multicenter Study.
Circ J
2004;
68:
126–130.
- 5.
Davlouros PA, Kilner PJ, Hornung TS, Li W, Francis JM, Moon JC, et al.
Right ventricular function in adults with repaired tetralogy of Fallot assessed with cardiovascular magnetic resonance imaging: Detrimental role of right ventricular outflow aneurysms or akinesia and adverse right-to-left ventricular interaction.
J Am Coll Cardiol
2002;
40:
2044–2052.
- 6.
Gatzoulis MA, Balaji S, Webber SA, Siu SC, Hokanson JS, Poile C, et al.
Risk factors for arrhythmia and sudden cardiac death late after repair of tetralogy of Fallot: A multicentre study.
Lancet
2000;
356:
975–981.
- 7.
Mizuno A, Niwa K, Matsuo K, Kawada M, Miyazaki A, Mori Y, et al.
Survey of reoperation indications in tetralogy of Fallot in Japan.
Circ J
2013;
77:
2942–2947.
- 8.
Kim JH, Kim HK, Lee SP, Kim YJ, Cho GY, Kim KH, et al.
Right ventricular reverse remodeling, but not subjective clinical amelioration, predicts long-term outcome after surgery for isolated severe tricuspid regurgitation.
Circ J
2014;
78:
385–392.
- 9.
Quiñones MA, Greenberg BH, Kopelen HA, Koilpillai C, Limacher MC, Shindler DM, et al.
Echocardiographic predictors of clinical outcome in patients with left ventricular dysfunction enrolled in the SOLVD registry and trials: Significance of left ventricular hypertrophy
J Am Coll Cardiol
2000;
35:
1237–1244.
- 10.
Stanton T, Leano R, Marwick TH.
Prediction of all-cause mortality from global longitudinal speckle strain: Comparison with ejection fraction and wall motion scoring.
Circ Cardiovasc Imaging
2009;
2:
356–364.
- 11.
Diller GP, Kempny A, Liodakis E, Kaleschke G, Kerckhoff G, Bunck ACh, et al.
Left ventricular longitudinal function predicts life-threatening ventricular arrhythmia and death in adults with repaired tetralogy of Fallot.
Circulation
2012;
125:
2440–2446.
- 12.
Inaba T, Yao A, Nakao T, Hatano M, Maki H, Imamura T, et al.
Volumetric and functional assessment of ventricles in pulmonary hypertension on 3-dimensional echocardiography.
Circ J
2013;
77:
198–206.
- 13.
Faul F, Erdfelder E, Lang AG, Buchner A.
G*Power 3: A flexible statistical power analysis program for the social, behavioral, and biomedical sciences.
Behav Res Methods
2007;
39:
175–191.
- 14.
Faul F1, Erdfelder E, Buchner A, Lang AG.
Statistical power analyses using G*Power 3.1: Tests for correlation and regression analyses.
Behav Res Methods
2009;
41:
1149–1160.
- 15.
Miyatake K, Yamagishi M, Tanaka N, Uematsu M, Yamazaki N, Mine Y, et al.
New method for evaluating left ventricular wall motion by color-coded tissue Doppler imaging: In vitro and in vivo studies.
J Am Coll Cardiol
1995;
25:
717–724.
- 16.
Nagueh SF, Appleton CP, Gillebert TC, Marino PN, Oh JK, Smiseth OA, et al.
Recommendations for the evaluation of left ventricular diastolic function by echocardiography.
Eur J Echocardiogr
2009;
10:
165–193.
- 17.
Valverde I, Parish V, Tzifa A, Head C, Sarikouch S, Greil G, et al.
Cardiovascular MR dobutamine stress in adult tetralogy of Fallot: Disparity between CMR volumetry and flow for cardiovascular function.
J Magn Reson Imaging
2011;
33:
1341–1350.
- 18.
Brookes C, Ravn H, White P, Moeldrup U, Oldershaw P, Redington A.
Acute right ventricular dilatation in response to ischemia significantly impairs left ventricular systolic performance.
Circulation
1999;
100:
761–767.
- 19.
Chang SA, Choe YH, Jang SY, Kim SM, Lee SC, Oh JK.
Assessment of left and right ventricular parameters in healthy Korean volunteers using cardiac magnetic resonance imaging: Change in ventricular volume and function based on age, gender and body surface area.
Int J Cardiovasc Imaging
2012;
28:
141–147.
- 20.
Soliman OI, Krenning BJ, Geleijnse ML, Nemes A, Bosch JG, van Geuns RJ, et al.
Quantification of left ventricular volumes and function in patients with cardiomyopathies by real-time three-dimensional echocardiography: A head-to-head comparison between two different semiautomated endocardial border detection algorithms.
J Am Soc Echocardiogr
2007;
20:
1042–1049.
- 21.
Hibberd MG, Chuang ML, Beaudin RA, Riley MF, Mooney MG, Fearnside JT, et al.
Accuracy of three-dimensional echocardiography with unrestricted selection of imaging planes for measurement of left ventricular volumes and ejection fraction.
Am Heart J
2000;
140:
469–475.
- 22.
Spiewak M, Małek ŁA, Petryka J, Mazurkiewicz Ł, Werys K, Biernacka EK, et al.
Repaired tetralogy of Fallot: Ratio of right ventricular volume to left ventricular volume as a marker of right ventricular dilation.
Radiology
2012;
265:
78–86.
- 23.
Zhang QB, Sun JP, Gao RF, Lee APW, Feng YL, Liu XR, et al.
Feasibility of single-beat full-volume capture real-time three-dimensional echocardiography for quantification of right ventricular volume: Validation by cardiac magnetic resonance imaging.
Int J Cardiol
2013;
168:
3991–3995.
- 24.
Kjaergaard J, Petersen CL, Kjaer A, Schaadt BK, Oh JK, Hassager C.
Evaluation of right ventricular volume and function by 2D and 3D echocardiography compared to MRI.
Eur J Echocardiogr
2006;
7:
430–438.
- 25.
Stanton T, Leano R, Marwick TH.
Prediction of all-cause mortality from global longitudinal speckle strain: Comparison with ejection fraction and wall motion scoring.
Circ Cardiovasc Imaging
2009;
2:
356–364.
- 26.
Kowalik E, Kowalik M, Rozanski J, Kusmierczyk M, Hoffman P.
The impact of pulmonary regurgitation on right ventricular regional myocardial function: An echocardiographic study in adults after total repair of tetralogy of Fallot.
J Am Soc Echocardiogr
2011;
24:
1199–1204.
- 27.
Takayasu H, Takahashi K, Takigiku K, Yasukochi S, Furukawa T, Akimoto K, et al.
Left ventricular torsion and strain in patients with repaired tetralogy of Fallot assessed by speckle tracking imaging.
Echocardiography
2011;
28:
720–729.
- 28.
Hausdorf G, Hinrichs C, Nienaber CA, Schark C, Keck EW.
Left ventricular contractile state after surgical correction of tetralogy of Fallot: Risk factors for late left ventricular dysfunction.
Pediatr Cardiol
1990;
11:
61–68.
- 29.
Weyman AE, Wann S, Feigenbaum H, Dillon JC.
Mechanism of abnormal septal motion in patients with right ventricular volume overload: A cross-sectional echocardiographic study.
Circulation
1976;
54:
179–186.
- 30.
Codreanu I, Pegg TJ, Selvanayagam JB, Robson MD, Rider OJ, Dasanu CA, et al.
Details of left ventricular remodeling and the mechanism of paradoxical ventricular septal motion after coronary artery bypass graft surgery.
J Invasive Cardiol
2011;
23:
276–282.

