Abstract
Background:
We evaluated the hemodynamic status of patent ductus arteriosus (PDA) by measuring vena contracta width (VCW) and effective shunt orifice area (ESOA) using proximal isovelocity surface area (PISA) on color Doppler imaging.
Methods and Results:
Study subjects were 21 patients with PDA (mean age, 3.6 years). We measured VCW (mm/m2) and ESOA (cm2) by the PISA method using echocardiography. Color images were obtained from parasternal long-axis views. VCW (mm/m2) was measured at the narrowest region of PDA flow. ESOA by PISA (PDA-ESOA) was defined on color Doppler flow imaging as a hemispheric area of laminar flow with aliased velocities [PDA-ESOA (cm2)=2π[PDA radius (cm)]^2×aligning velocity (cm/s)/PDA peak velocity (cm/s)]. Upon examining the relationships with catheterization parameters by univariate analysis, VCW correlated with diastolic blood pressure (DBP), % left ventricular end-diastolic volume (%LVEDV), pulmonary blood flow index, pulmonary blood flow/systemic blood flow ratio (Qp/Qs), left-right (LR) shunt ratio, left atrial to aortic root ratio (LA/AO), chest-thoracic ratio and N-terminal pro-brain natriuretic peptide (NTproBNP); and PDA-ESOA correlated with DBP, Qp/Qs, average pulmonary artery pressure, pulmonary/systemic pressure ratio, %LVEDV, LR shunt ratio, LA/AO and NTproBNP. When stepwise multiple linear regression analysis was performed with the correlations that were significant on univariate analysis, significant correlations with Qp/Qs were noted (VCW; R2=0.836, β=0.914, P<0.001, PDA-ESOA; R2=0.621, β=0.788, P<0.001).
Conclusions:
Measurement of VCW and PDA-ESOA by the PISA method can noninvasively evaluate the hemodynamic status of PDA. (Circ J 2014; 78: 2302–2308)
The clinical history of patients with a patent ductus arteriosus (PDA) varies from those who present with congestive heart failure (CHF) or PDA-dependent congenital heart disease (CHD)1
in infancy to those who are completely asymptomatic. The clinical status is dictated largely by the size of the left-to-right shunt, which depends on anatomical and physiological factors. Color Doppler imaging is a very sensitive modality for detecting the presence of a PDA and is frequently used to qualitatively estimate the degree of shunting. PDA closure is recommended for patients with a significant left-to-right shunt who are symptomatic, have evidence of left-sided volume overload, or have reversible pulmonary arterial hypertension (PAH).2
The indication for surgical closure of a PDA is still determined by cardiac catheterization findings in many institutions. Quantification of shunt volume is the major goal of the hemodynamic evaluation of patients with PDA. However, there have been few reports of a straightforward and noninvasive echocardiographic method of quantifying flow across a PDA that correlates well with the cardiac catheterization findings.
American Society of Echocardiography guideline recommendations for the evaluation of mitral regurgitation (MR) severity include assessment of color flow Doppler regurgitant jet area and quantification of MR by vena contracta (VC) width (VCW) and by effective regurgitant orifice area (EROA) using proximal isovelocity surface area (PISA).3,4
Echocardiographic research laboratories have demonstrated that VC and PISA are accurate for MR assessment and have good interobserver agreement.5–7
Recommendation for MR evaluation stresses the importance of VC width and EROA by PISA measurement. This method has been described in detail for the determination of transvalvular and shunt flows, as well as for the calculation of valvular orifice size; in addition, PISA is imaged not only in patients with valvular regurgitation but also in patients with shunts from CHDs, especially ventricular septal defects.8–13
Our goal was to evaluate direct calculation of the hemodynamic status of PDA by measuring VC and effective shunt orifice area (ESOA) by PISA on color Doppler imaging.
Methods
Study Population
Study subjects were patients with PDA diagnosed at the hospital attached to Hamamatsu University School of Medicine between May 2008 and December 2013. We retrospectively reviewed all patients with PDA. Because this study was retrospective, the results require validation using prospective evaluation in a small cohort of patients. Excluded were patients with other congenital diseases. The study protocol was approved by the Ethics Committee of Hamamatsu University School of Medicine. The study was conducted according to the principles of the Declaration of Helsinki.
Echocardiographic Evaluation
For data acquisition, a Philips HD11 or iE33 equipped (Philips Medizin Systeme GmbH, Tokyo, Japan) with S8-3, X5-1, and X7-2 Sector Transducers was used. Echocardiography measurements were performed in the resting state. All 21 patients underwent routine echocardiographic evaluation including cross-sectional, M-mode, continuous wave Doppler imaging, Doppler color flow mapping, and spectral Doppler studies with simultaneous ECG monitoring. We measured the left ventricular ejection fraction (LVEF%) and left atrial to aortic root ratio (LA/AO) by M-mode echocardiography. In all cases, the presence of no other congenital heart disease was confirmed before examination. Patients unable to cooperate were sedated according to local practice.
PDA Evaluation
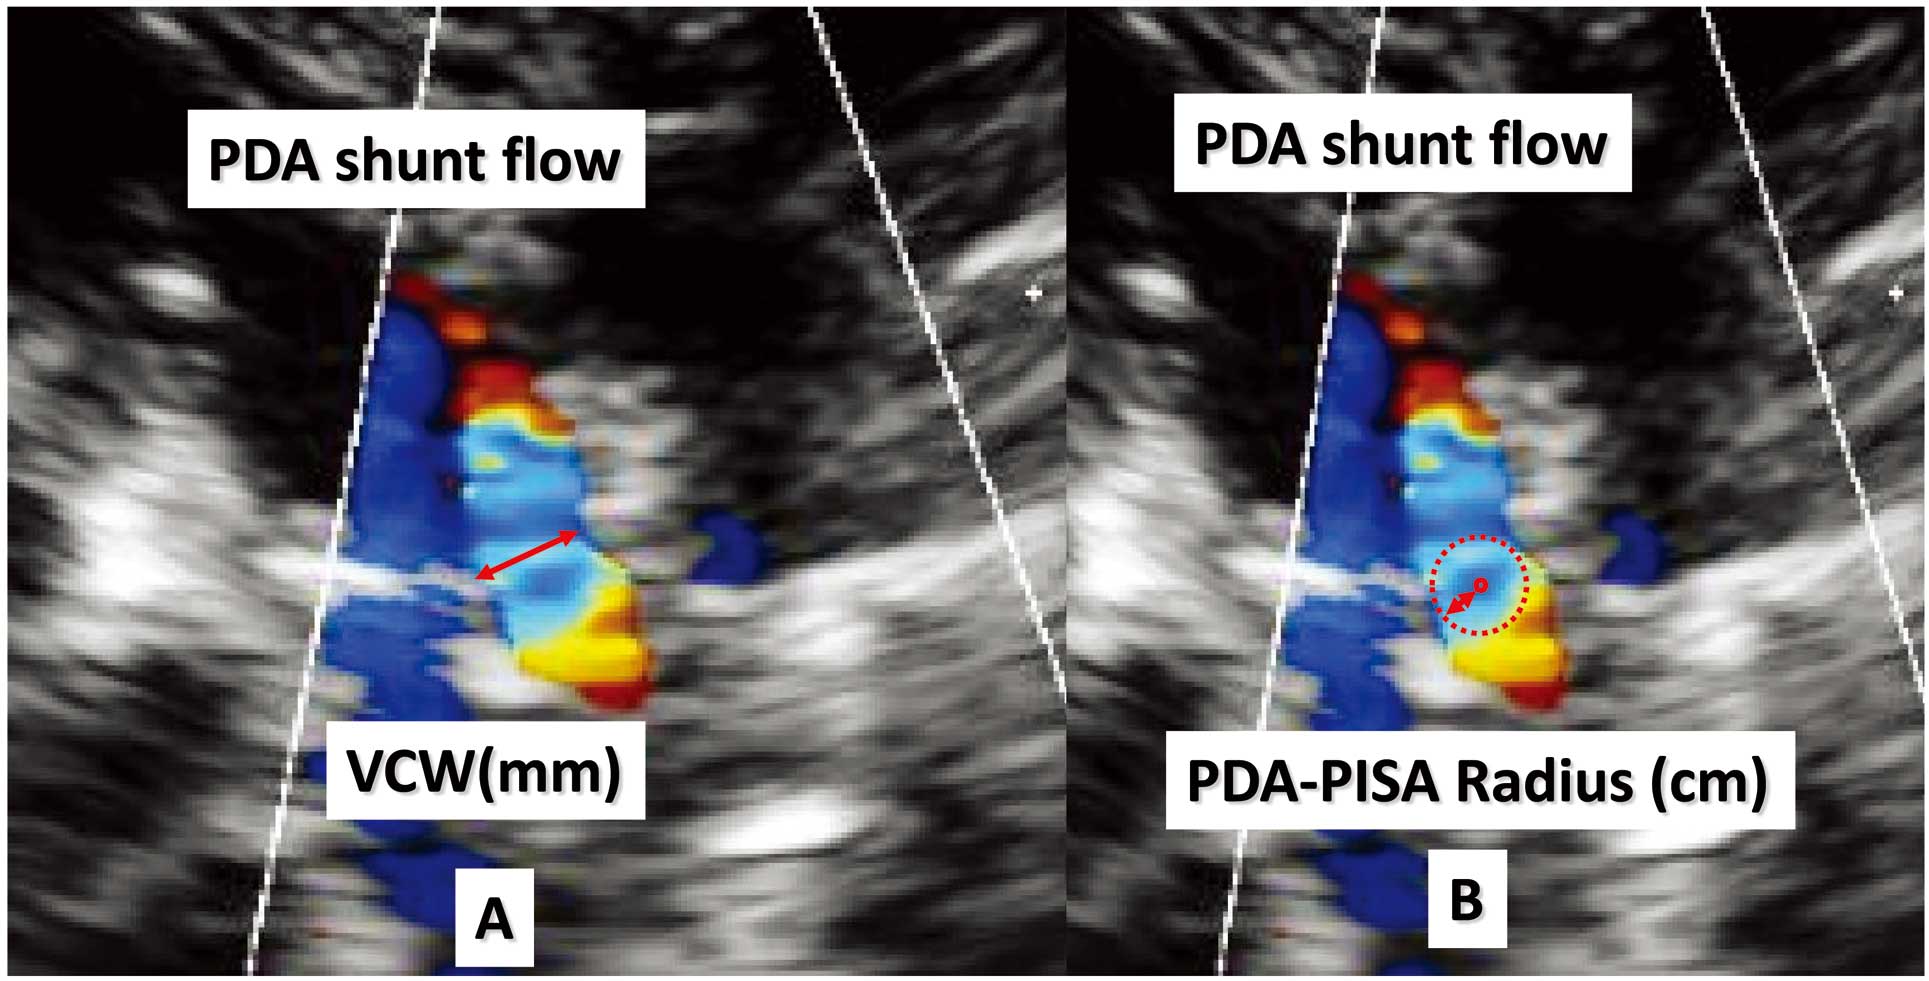
Color Doppler images of the PDA were best obtained from parasternal long-axis views in each patient. The color sector size was approximately 30°, the filter was kept at the minimum setting, and the gain level was kept just below that which produced static noise in the color signal. The flow convergence region was defined on Doppler color flow mapping as a region of laminar flow with aliased velocities entering the orifice. The images of the flow convergence region selected had well-characterized, non-turbulent flow acceleration, including one or more aliases in the pulmonary artery for flow going toward the transducer through the PDA. Aliasing velocity in this study with color Doppler imaging ranged from 38.5 to 77.0 cm/s. The color gain level was kept just below the point where static noise was visible in the color signal. The frame memory function, which allows frame-by-frame analysis, and the zoom function were used to obtain a high-quality image. VCW per body surface area (VCW, mm/m2) was measured at the narrowest region of the PDA flow just near the flow convergence (Figure 1A).14
The ESOA of the PDA (PDA-ESOA) by PISA was defined on color Doppler flow imaging as a hemispheric area of laminar flow with aliased velocities. The radius of the hemispheric PISA, from the border of the first color convergence to the center of the PDA, was measured manually. Measurements of VCW and the radius were made in the early phase of systole that corresponded with the PDA maximum peak velocity phase to the limited extent that was possible. The PISA radius was measured as the distance from the aliasing line to the PDA long-axis views (Figure 1B). The PISA method was used to calculate the shunt volume as follows:
PDA-ESOA (cm2)=2π[PDA radius (cm)]^2×aligning velocity (cm/s)/PDA peak velocity (cm/s)
The best-quality 3–4 images were chosen for each study subject. Stored digital scans were analyzed by a reader (S.I. and T.I.) blinded to the subject’s details.
Cardiac Catheterization and Other Parameters
Cardiac catheterization was performed 2 days after the echocardiographic examination: 9 patients underwent general anesthesia and 12 underwent local anesthesia. Sampling was typically performed during insertion of the catheter under fluoroscopic guidance to insure that samples were drawn from the proper sites. Blood samples were taken from the superior vena cava, inferior vena cava, right and main pulmonary arteries, and systemic artery. Cardiac catheterization parameters included systolic blood pressure (mmHg), average blood pressure (mmHg), diastolic blood pressure (DBP, mmHg), % left ventricular end-diastolic volume of normal ratio (%LVEDV), LVEF (%), average pulmonary artery pressure (Av.-PAP, mmHg), systolic pulmonary artery pressure/systolic artery pressure ratio (Pp/Pa), pulmonary blood flow index (QpI, L·min–1·m–2), systemic blood flow index (L·min–1·m–2), pulmonary blood flow/systemic blood flow ratio (Qp/Qs), left-right shunt ratio (LR shunt, %), pulmonary artery resistance (Rp, Wood units×m2), systemic artery resistance (Rs, Wood units×m2), and Rp/Rs (Rp/Rs ratio). Cardiac catheterization parameters were calculated by Fick’s rule based on estimated oxygen consumption.15
Biplane cineangiographic left ventriculography was performed under stable hemodynamic conditions, and left ventricular volume was calculated by the area-length method and corrected using the regression equation derived by Dodge et al.16
Serum concentration of N-terminal pro-brain natriuretic peptide (NTproBNP) was measured on an Elecsys 2010 analyzer with a chemiluminescent immunoassay kit (Roche Diagnostics; Mannheim, Germany). Further details are available elsewhere.17
NTproBNP concentration could not be determined in 4 cases. Chest X-ray was performed 2 days before cardiac catheterization, and chest-thoracic ratio (CTR) was calculated.
Reproducibility of Measurements
To test intra- and interobserver variability, VCW and PDA-ESOA were measured in 10 randomly selected patients by 2 independent observers, and by 1 observer on 2 different occasions.
Statistical Analysis
Results are expressed as mean, median and range. Spearman rank correlation was used to evaluate the relationship between echocardiographic parameters and cardiac catheterization parameters, CTR, and NTproBNP; those found to be significant on univariate analysis were subjected to multivariate analysis using stepwise logistic regression. Two-sided comparisons between groups were made using the Mann-Whitney U test. Testing of intra-observer reliability was performed using intraclass correlation coefficient (ICC). Intra-observer variability was assessed by 1-way analysis of variance (ANOVA), while interobserver reliability was assessed by 2-way ANOVA. For all statistical analyses, P<0.05 was considered significant. SPSS Statistics 21 software (SPSS Inc, Chicago, IL, USA) was used for statistical analyses.
Results
The clinical and echocardiographic characteristics of the 21 study patients are summarized in
Table 1. There were 7 male and 14 female patients. Their mean age was 3.6 years (median, 3.6 years; range, 1 month to 11 years old); 5 infants had been administered diuretic drugs and no patient was treated with inotropic drugs. In total, 10 patients underwent coil embolization therapy for PDA, 8 underwent surgical ligation for PDA after cardiac catheterization, 2 asymptomatic patients with low weight (6.7 kg and 8.9 kg) underwent observation only, and 1 patient had natural closure of PDA at age 4 years and 10 months (all cases diagnosed by echocardiography). The patients undergoing surgical ligation were either symptomatic PDA (eg, tachypnea, poor feeding, poor weight gain) or there had been difficulty in performing coil embolization therapy because of the type of PDA. For the cases of coil embolization, patients were asymptomatic and indicated by body size, weight >15 kg and the type of PDA. We carefully considered the treatment options for patients with asymptomatic PDA. Coil embolization therapy was performed only after obtaining written informed consent from the parent or legal guardian of the patient. Catheterization findings are shown in
Table 2.
Table 1.
Characteristics of the Patients With Patent Ductus Arteriosus (n=21)
| |
Mean |
Median |
Min |
Max |
| Sex (M/F) |
7/14 |
|
|
|
| Age (years) |
3.6 |
3.6 |
0.1 |
11.8 |
| Height (cm) |
89.4 |
90.5 |
50.8 |
140.0 |
| Weight (kg) |
13.3 |
13.1 |
3.4 |
30.0 |
| BSA (m2) |
0.56 |
0.56 |
0.21 |
1.07 |
| Echocardiography parameters (n=21) |
| VCW (mm/m2) |
3.9 |
2.1 |
0.9 |
13.6 |
| Radius of PISA (cm) |
0.16 |
0.12 |
0.06 |
0.44 |
| Aliasing velocity (cm/s) |
57.7 |
60.0 |
38.5 |
77.0 |
| PDA-Vp (cm/s) |
429.1 |
442.0 |
297.0 |
541.0 |
| PDA-ESOA (cm2) |
0.033 |
0.011 |
0.002 |
0.213 |
| LVEF (%) |
74.8 |
75.9 |
64.2 |
85.9 |
| LA/AO |
1.25 |
1.20 |
1.01 |
1.59 |
BSA, body surface area; ESOA, effective shunt orifice area; LA/AO, left atrial to aortic root ratio; LVEF, left ventricular ejection fraction; PDA, patent ductus arteriosus; PISA, proximal isovelocity surface area; VCW, vena contracta width; Vp, systolic peak velocity.
Table 2.
Cardiac Catheterization Findings in the Present Study (n=21)
| |
Mean |
Median |
Min |
Max |
| SBP (mmHg) |
85 |
85 |
60 |
115 |
| Av.-BP (mmHg) |
64 |
63 |
41 |
96 |
| DBP (mmHg) |
45 |
46 |
26 |
75 |
| Av.-PAP (mmHg) |
21 |
20 |
13 |
51 |
| Pp/Pa |
0.37 |
0.28 |
0.19 |
1.00 |
| %LVEDV |
132.4 |
117.4 |
89.3 |
208.7 |
| LVEF (%) |
66.7 |
67.1 |
55.0 |
83.5 |
| QsI (L·min–1·m–1) |
4.51 |
4.47 |
2.16 |
7.11 |
| QpI (L·min–1·m–1) |
7.58 |
6.15 |
2.55 |
16.16 |
| Qp/Qs |
1.69 |
1.35 |
1.02 |
3.39 |
| LR shunt (%) |
31.0 |
25.9 |
2.40 |
70.5 |
| Rs (Wood units×m2) |
13.68 |
13.71 |
6.61 |
21.81 |
| Rp (Wood units×m2) |
1.86 |
1.45 |
0.87 |
5.63 |
| Rp/Rs |
0.14 |
0.12 |
0.05 |
0.33 |
| CTR |
52.2 |
52.0 |
41.0 |
61.0 |
| NTproBNP (n=17) |
1,251.8 |
119.0 |
25.0 |
7,564.0 |
Av.-BP, average blood pressure; Av.-PAP, average pulmonary artery pressure; CTR, chest thoracic ratio; DBP, diastolic blood pressure; %LVEDV, left ventricular end-diastolic volume of normal value; NTproBNP, N-terminal pro-brain natriuretic peptide; Pp/Pa, systolic pulmonary artery pressure/systolic artery pressure ratio; Qpl, pulmonary blood flow index; Qp/Qs, pulmonary blood flow/systemic blood flow ratio; QsI, systemic blood flow index; Rp, pulmonary artery resistance; Rs, systemic artery resistance; Rp/Rs, Rp/Rs ratio; SBP, systolic blood pressure.
From the univariate analysis, correlations of cardiac catheterization parameters and other characteristics with VCW or PDA-ESOA are shown in
Table 3. A negative correlation was observed between VCW and DBP. Positive correlations of VCW were observed with %LVEDV, QpI, Qp/Qs, LR shunt, LA/AO, CTR, and NTproBNP. Negative correlations were observed between PDA-ESOA and DBP. Positive correlations of PDA-ESOA were observed with Av.-PAP, Pp/Pa, %LVEDV, Qpl, Qp/Qs, LR shunt, LA/AO and NTproBNP.
Table 4
shows the results of multiple linear regression analysis using a stepwise procedure for VCW and PDA-ESOA. Multiple linear regression analysis was performed with the cardiac catheterization parameters, CTR and NTproBNP, and was applied to variables that were significant on univariate analysis; for VCW, a significant correlation was noted with Qp/Qs (R2=0.836, β=0.914, P<0.001); for PDA-ESOA, a significant correlation was noted with Qp/Qs (R2=0.621, β=0.788, P<0.001).
Figure 2
shows a comparison of PDA parameters between the surgical ligation and coil embolization cases. There were 8 cases in which surgical ligation was performed for PDA, and this group had significantly higher values of VCW and PDA-ESOA than the 10 patients who underwent coil embolization therapy [VCW 7.62 (8.44) vs. 1.33 (1.25), P<0.001, PDA-ESOA; 0.070 (0.048) vs. 0.008 (0.007), P=0.001].
Table 3.
Co-Relationship Between VCW, PDA-PISA and Cardiac Catheterization Parameters
| |
VCW (mm/m2) |
PDA-ESOA (cm2) |
| r |
P value |
r |
P value |
| SBP (mmHg) |
–0.169 |
0.465 |
–0.277 |
0.224 |
| Av.-BP (mmHg) |
–0.362 |
0.107 |
–0.229 |
0.318 |
| DBP (mmHg) |
–0.626** |
0.002 |
–0.600** |
0.004 |
| Av.-PAP (mmHg) |
0.325 |
0.151 |
0.540* |
0.012 |
| Pp/Pa |
0.319 |
0.158 |
0.531* |
0.013 |
| %LVEDV |
0.703** |
0.000 |
0.585* |
0.005 |
| LVEF (%) |
0.137 |
0.554 |
0.208 |
0.367 |
| QsI |
0.177 |
0.785 |
–0.170 |
0.461 |
| QpI |
0.749** |
0.000 |
0.522* |
0.015 |
| Qp/Qs |
0.827** |
0.000 |
0.715** |
0.015 |
| LR shunt (%) |
0.827** |
0.000 |
0.715** |
0.000 |
| Rp (Wood units×m2) |
–0.274 |
0.229 |
0.087 |
0.708 |
| Rs (Wood units×m2) |
–0.218 |
0.342 |
0.037 |
0.873 |
| Rp/Rs |
0.084 |
0.716 |
0.175 |
0.449 |
| LA/AO |
0.832** |
0.000 |
0.741** |
000 |
| CTR |
0.780** |
0.000 |
0.368 |
0.101 |
| NTproBNP (n=17) |
0.650** |
0.005 |
0.559** |
0.020 |
**
P<0.01,*
P<0.05.
LR, left-to-right. Other abbreviations as in Tables 1,2.
Table 4.
Multiple (Stepwise) Regression Analysis for Models Predicting VCW and PDA-ESOA
| |
Predicting models |
| VCW |
PDA-ESOA |
| Variable |
Qp/Qs |
Qp/Qs |
| R2 |
0.836 |
0.621 |
| Standardized coefficient β |
0.914 |
0.788 |
| P value |
<0.001 |
<0.001 |
Abbreviations as in Tables 1,2.
Regarding the intra-observer reliability of VCW, the ICC was 0.929 [95% confidence interval (CI), 0.800–0.981, standard error mean (SEM)=0.006], and for the interobserver reliability, the ICC was 0.967 (95% CI 0.919–0.990, SEM=0.001). For the intra-observer reliability of PDA-ESOA, the ICC was 0.980 (95% CI 0.944–0.995, SEM=0.001), and for the interobserver reliability, the ICC was 0.985 (95% CI 0.965–0.996, SEM=0.0001). Intra- and interobserver variations of VCW and PDA-ESOA were within an acceptable range.
Discussion
Echocardiography can be used to confirm the diagnosis and characterize the anatomy and physiology of PDA. Several parameters have previously been described by echocardiography for classification of PDA, including in the neonatal field.18
LA/AO derived using M-mode imaging from the long-axis approach is the most well-recognized surrogate of the severity of PDA and was first described by Silverman et al in 1974.19
However, many of these markers have low sensitivity and specificity for ductal significance when compared with PDA diameter, because the diameter of the PDA can not be demonstrated accurately, as is often the case. Moreover, these markers include both patient-related factors such as left ventricular performance or trans-atrial shunting, and operator-dependent factors, which may lead to over- or under-estimation of these single-dimensional measurements.20
Measurement of PDA lumen and morphology with conventional 2D imaging is not feasible because of the tortuosity of the duct, variability in PDA diameter across its course, and variations in PDA configuration, as is illustrated using the classification of Krichenko et al.21
Therefore, we evaluated whether VCW and PDA-ESOA measured by PISA on color Doppler imaging were parameters appropriate for direct calculation of the hemodynamic status of PDA based on cardiac catheterization parameters.
In the present study, we observed that the measurements of VCW and PDA-ESOA by the PISA method correlated well with data on the hemodynamic status of PDA obtained by cardiac catheterization. In particular, using multiple linear regression analysis, there were clinically useful correlations between VCW or PDA-ESOA and the cardiac catheterization parameter, Qp/Qs. Furthermore, the intra- and interobserver variations were within an acceptable range. An in vitro study has shown that equipment settings (gain, wall filter, frame rate, transmission power, and packet size) do not affect the volumetric flow rate calculated by PISA.22
VCW and PDA-ESOA allow quantitative assessment of PDA shunt flow more quickly and readily, because the calculation requires only measurements of area on 1 image of color flow mapping and shunt duration on spectral Doppler recording. The PDA shunt flow increased with PAH, ductal steal, left-heart volume overload and CHF. On univariate analysis, there were some differences in results between VCW and PDA-ESOA. VCW correlated with DBP, %LVEDV, QpI, LR shunt, LA/AO, CTR and NTproBNP, whereas PDA-ESOA correlated with DBP, average PAP, Pp/Pa, %LVEDV, Qpl, LR shunt, LA/AO and NT pro BNP. These are indirect parameters of the hemodynamic status of PDA; in particular, DBP, CTR, and NTproBNP are more easily accessible than measurement of cardiac catheterization parameters. The magnitude of shunt flow through a PDA is a function of both the orifice size and the continuous pressure relationship between the systemic and pulmonary artery pressures. The VC area is considered equivalent to the EROA in evaluating MR by the PISA method. The VC area is located immediately distal to the orifice, rather than before or within the regurgitant orifice, and can be up to 40% smaller than the anatomic orifice.23
The location and size of the VC area are highly dependent on the geometry of the mitral valve orifice and are largely independent of flow rate.5,24
Experimental studies have suggested that the VC area provides unique information with regard to the severity of regurgitation.25,26
We speculate that differences in some results between VCW and PDA-ESOA may have existed because VCW reflects the orifice size of the PDA, whereas PDA-ESOA may reflect the status of the pulmonary vasculature. Our data suggest that the VCW and PDA-ESOA determined by the PISA method in PDA patients are reliable for quantitative assessment of PDA shunt flow.
In the present study, there were 8 patients who underwent surgical ligation for PDA, and this group had significantly higher VCW and PDA-ESOA values than the 10 patients who underwent coil embolization therapy (see earlier). The PISA method is highly recommended in current guidelines for the quantification of EROA in MR.27
In a subsequent large retrospective study in which the severity of MR was quantified by Doppler echocardiography, 198 patients with an EROA >0.40 cm2
had a 4% per year risk of cardiac death during a mean follow-up period of 2.7 years.28
In our data, the clinical decision on surgical procedure was based on cardiac catheterization results. Although the present study was small in scale and retrospective, measurement of VCW and PDA-ESOA may allow noninvasive assessment of the severity of PDA and may have the potential to guide clinical decision-making and decisions regarding the timing of surgical intervention
.
Study Limitations
First, this study was conducted with a relatively small number of patients and used a retrospective cross-sectional study design. Second, the age distribution was wide for quantitative analysis of cardiac and pulmonary hemodynamics. Third, sources of error in the measurement of PISA included the presence of an eccentric jet, non-hemispheric geometry of proximal flow convergence, imprecise identification of regurgitant orifice, and dynamic changes of the PISA radius throughout systole.6,29
For the latter reason, just 1 frame per systole was used and the systolic frame with the largest flow convergence region and as near as possible to the PDA peak velocity was chosen. Fourth, it may be a limitation of the present study that the catheterization and echocardiographic studies were not performed simultaneously; however, because the time interval between the 2 studies was short and there were no significant hemodynamic changes during this period, this limitation may be negligible.
In spite of these limitations, there were significant correlations between VCW, PDA-ESOA and the cardiac catheterization findings. Recent technological advances in 3D echocardiography (3DE) have provided new tools for MR quantification using VCW and EROA, and 3D imaging is particularly helpful when there are multiple or complicated jets.30
The PISA method using 3DE can evaluate not only valvular disease but also congenital heart disease.31
The 2 current approaches for managing patients with PDA are observation and elective ductal closure. Management decisions depend on the size of the left-to-right shunt, and the age and size of the patient. Further studies are needed to evaluate the validity of PDA quantification by the 2DE-PISA method using new tools such as 3DE and cardiac magnetic resonance.
In conclusion, the VCW and PDA-ESOA calculated by PISA are both affected by PDA morphology and have color flow jet characteristics. Measurement of VCW and PDA-ESOA can noninvasively evaluate the hemodynamic status of PDA.
References
- 1.
Ichikawa Y, Yokoyama U, Iwamoto M, Oshikawa J, Okumura S, Sato M, et al. Inhibition of phosphodiesterase type 3 dilates the rat ductus arteriosus without inducing intimal thickening. Circ J 2012; 76: 2456–2464.
- 2.
Myers PO, Tissot C, Beghetti M. Assessment of operability of patients with pulmonary arterial hypertension associated with congenital heart disease. Circ J 2013; 78: 4–11.
- 3.
Bonow RO, Carabello BA, Chatterjee K, de Leon AC
Jr, Faxon DP, Freed MD, et al. 2008 focused update incorporated into the ACC/AHA 2006 guidelines for the management of patients with valvular heart disease: A report of the American College of Cardiology/American Heart Association Task Force on Practice Guidelines (Writing Committee to Develop Guidelines for the Management of Patients with Valvular Heart Disease). J Am Coll Cardiol 2008; 52: e1–e142, doi:10.1016/j.jacc.2008.05.007.
- 4.
Zoghbi WA, Enriquez-Sarano M, Foster E, Grayburn PA, Kraft CD, Levine RA, et al. Recommendations for evaluation of the severity of native valvular regurgitation with two-dimensional and Doppler echocardiography. J Am Soc Echocardiogr 2003; 16: 777–802.
- 5.
Hall SA, Brickner ME, Willett DL, Irani WN, Afridi I, Grayburn PA. Assessment of mitral regurgitation severity by Doppler color flow mapping of the vena contracta. Circulation 1997; 95: 636–642.
- 6.
Schwammenthal E, Chen C, Benning F, Block M, Breithardt G, Levine RA. Dynamics of mitral regurgitant flow and orifice area: Physiologic application of the proximal flow convergence method: Clinical data and experimental testing. Circulation 1994; 90: 307–322.
- 7.
Fehske W, Omran H, Manz M, Köhler J, Hagendorff A, Lüderitz B. Color-coded Doppler imaging of the vena contracta as a basis for quantification of pure mitral regurgitation. Am J Cardiol 1994; 73: 268–274.
- 8.
Recusani F, Bargiggia GS, Yoganathan AP, Raisaro A, Valdes-Cruz LM, Sung HW, et al. A new method for quantification of regurgitant flow rate using color Doppler flow imaging of the flow convergence region proximal to a discrete orifice: An in vitro study. Circulation 1991; 83: 594–604.
- 9.
Utsunomiya T, Ogawa T, Tang HA, Doshi R, Patel D, Quan M, et al. Doppler color flow mapping of the proximal isovelocity surface area: A new method for measuring volume flow rate across a narrowed orifice. J Am Soc Echocardiogr 1991; 4: 338–348.
- 10.
Yamachika S, Reid CL, Savani D, Meckel C, Paynter J, Knoll M, et al. Usefulness of color Doppler proximal isovelocity surface area method in quantitating valvular regurgitation. J Am Soc Echocardiogr 1997; 10: 159–168.
- 11.
Oku K, Utsunomiya AT, Mori H, Yamachika S, Yano K. Calculation of mitral valve area in mitral stenosis using the proximal isovelocity surface area method: Comparison with two-dimensional planimetry and Doppler pressure half time method. Jpn Heart J 1997; 38: 811–819.
- 12.
Kurotobi S, Sano T, Matsushita T, Takeuchi M, Kogaki S, Miwatani T, et al. Quantitative, non-invasive assessment of ventricular septal defect shunt flow by measuring proximal isovelocity surface area on color Doppler mapping. Heart 1997; 78: 305–309.
- 13.
Tunick PA, Kronzon I. Homograft pulmonic stenosis after the Ross procedure: Evaluation of the stenotic valve area by proximal isovelocity surface area (PISA). J Am Soc Echocardiogr 2001; 14: 67–69.
- 14.
Ishii M, Jones M, Shiota T, Heinrich R, Yamada I, Sinclair B, et al. Evaluation of eccentric aortic regurgitation by color Doppler jet and color Doppler-imaged vena contracta measurements: An animal study of quantified aortic regurgitation. Am Heart J 1996; 132: 796–804.
- 15.
Krovetz LJ, Goldbloom S: Normal standards for cardiovascular data.
I: Examination of the validity of cardiac index. Johns Hopkins Med J 1972; 130: 174–186.
- 16.
Dodge HT, Sandler HT, Ballew DW, Lord JD. The use of biplane angiography for the measurement of left ventricular volume in man. Am Heart J 1960; 60: 762–776.
- 17.
Collinson PO, Barnes SC, Gaze DC, Galasko G, Lahiri A, Senior R. Analytical performance of the N terminal pro B type natriuretic peptide (NT-proBNP) assay on the Elecsys 1010 and 2010 analysers. Eur J Heart Fail 2004; 6: 365–368.
- 18.
Sehgal A, McNamara PJ. Does echocardiography facilitate determination of hemodynamic significant attributable to the ductus arteriosus? Eur J Pediatr 2009; 168: 907–914.
- 19.
Silverman NH, Lewis AB, Heymann MA, Rudolph AM. Echocardiographic assessment of ductus arteriosus shunt in premature infants. Circulation 1974; 50: 821–825.
- 20.
Kluckow M, Evans N. Early echocardiographic prediction of symptomatic patent ductus arteriosus in preterm infants undergoing mechanical ventilation. J Pediatr 1995; 127: 774–779.
- 21.
Krichenko A, Benson LN, Burrows P, Möes CA, McLaughlin P, Freedom RM. Angiographic classification of the isolated, persistently patent ductus arteriosus and implications for percutaneous catheter occlusion. Am J Cardiol 1989; 63: 877–880.
- 22.
Utsunomiya T, Ogawa T, Doshi R, Patel D, Quan M, Henry WL, et al. Doppler color flow “proximal isovelocity surface area” method for estimating volume flow rate: Effects of orifice shape and machine factors. J Am Coll Cardiol 1991; 17: 1103–1111.
- 23.
Shames IH. Mechanics of fluids. 2nd edn.
New York, NY: McGraw-Hill, 1982; 192.
- 24.
Yoganathan AP, Cape EG, Sung HW, Williams FP, Jimoh A. Review of hydrodynamic principles for the cardiologist: Applications to the study of blood flow and jets by imaging techniques. J Am Coll Cardiol 1988; 12: 1344–1353.
- 25.
Ishii M, Jones M, Shiota T, Yamada I, Heinrich RS, Holcomb SR, et al. Quantifying aortic regurgitation by using the color Doppler-imaged vena contracta: A chronic animal model study. Circulation 1997; 96: 2009–2015.
- 26.
Zhou X, Jones M, Shiota T, Yamada I, Teien D, Sahn DJ. Vena contracta imaged by Doppler color flow mapping predicts the severity of eccentric mitral regurgitation better than color jet area: A chronic animal study. J Am Coll Cardiol 1997; 30: 1393–1398.
- 27.
Lancellotti P, Moura L, Pierard LA, Agricola E, Popescu BA, Tribouilloy C, et al. European Association of Echocardiography recommendations for the assessment of valvular regurgitation. Part 2: Mitral and tricuspid regurgitation (native valve disease). Eur J Echocardiogr 2010; 11: 307–332.
- 28.
Enriquez-Sarano M, Avierinos JF, Messika-Zeitoun D, Detaint D, Capps M, Nkomo V, et al. Quantitative determinants of the outcome of asymptomatic mitral regurgitation. N Engl J Med 2005; 352: 875–883.
- 29.
Buck T, Plicht B, Kahlert P, Schenk IM, Hunold P, Erbel R. Effect of dynamic flow rate and orifice area on mitral regurgitant stroke volume quantification using the proximal isovelocity surface area method. J Am Coll Cardiol 2008; 52: 767–778.
- 30.
Thavendiranathan P, Phelan D, Collier P, Thomas JD, Flamm SD, Marwick TH. Quantitative assessment of mitral regurgitation: How best to do it. JACC Cardiovasc Imaging 2012; 5: 1161–1175.
- 31.
Ishii M, Hashino K, Eto G, Tsutsumi T, Himeno W, Sugahara Y, et al. Quantitative assessment of severity of ventricular septal defect by three-dimensional reconstruction of color Doppler-imaged vena contracta and flow convergence region. Circulation 2001; 103: 664–669.


 , surgical ligation cases;
  , coil embolization cases. ESOA, effective shunt orifice area; PDA, patent ductus arteriosus.