Abstract
Background:
Because fatal arrhythmia is an important cause of death in patients with myocarditis, we investigated the proarrhythmic mechanisms of experimental autoimmune myocarditis.
Methods and Results:
Myocarditis was induced by injection of 2 mg porcine cardiac myosin into the footpads of adult Lewis rats on days 1 and 8 (Myo, n=15) and the results compared with Control rats (Control, n=15). In an additional 15 rats, 6 mg/kg prednisolone was injected into the gluteus muscle before the injection of porcine cardiac myosin on days 1 and 8 (MyoS, n=15). Hearts with myocarditis had longer action potential duration (APD), slower conduction velocity (CV; P<0.01 vs. Control), higher CV heterogeneity, greater fibrosis, higher levels of immunoblotting of high-mobility group protein B1, interleukin 6 and tumor necrosis factor-α proteins. Steroid treatment partially reversed the translations for myocarditis, CV heterogeneity, reduced APD at 90% recovery to baseline, increased CV (P<0.01), and reversed fibrosis (P<0.05). Programmed stimulation triggered sustained ventricular tachycardia in Myo rats (n=4/5), but not in controls (n=0/5) or Ca2+/calmodulin-dependent protein kinase II (CaMKII) inhibitor (KN93) treated Myo rats (n=0/5, P=0.01). CaMKII autophosphorylation at Thr287 (201%), and RyR2 phosphorylation at Ser2808 (protein kinase A/CaMKII site, 126%) and Ser2814 (CaMKII site, 21%) were increased in rats with myocarditis and reversed by steroid.
Conclusions:
The myocarditis group had an increased incidence of arrhythmia caused by increased phosphorylation of Ca2+
handling proteins. These changes were partially reversed by an antiinflammatory treatment and CaMKII inhibition. (Circ J 2014; 78: 2292–2301)
Myocarditis, and subsequent dilated cardiomyopathy (DCM), is a major cause of heart failure and arrhythmia in young patients.1,2
This condition is characterized by infiltration of inflammatory cells into the myocardium with cellular injury, consequent loss of myocytes and development of fibrosis and necrosis.3,4
In a significant number of patients, the long-term sequelae of cardiomyocyte loss are ventricular remodeling, permanent ventricular wall dysfunction, DCM, and consequently chronic heart failure. In particular, life-threatening ventricular arrhythmia or sudden death, occurring mainly during acute flare-up of myocarditis, is a serious complication of myocarditis. Therefore, understanding the mechanism of ventricular arrhythmia in myocarditis is important to developing treatment and improving prognosis.5
Experimental autoimmune myocarditis in the rat is a unique and useful model for understanding myocarditis and subsequent DCM. Myocarditis rats exhibit high inducibility of ventricular arrhythmia and prolonged action potential duration (APD).6
However, detailed elucidation of how inflammation of the heart contributes to an increased APD and causes ventricular arrhythmia has not been reported. In myocarditis, inflammation by immune cells increases oxidative stress by excessive production of free radicals from inflammatory cells. Notably, oxidative stress in cardiomyocytes has been shown to activate Ca2+/calmodulin-dependent protein kinase II (CaMKII),7
sequentially inducing afterdepolarization by prolonging APD.8
Therefore, we hypothesized that myocarditis-induced arrhythmias could be attributable to CaMKII activation triggered by inflammation and oxidative stress. To prove this hypothesis, we evaluated arrhythmic events and mechanisms using an in-vivo myocarditis model and Langendorff-perfused isolated hearts. We evaluated whether the level of inflammation and CaMKII activation were increased in myocarditis, and reversed by pretreatment with an antiinflammatory agent and CaMKII inhibition.
Methods
Induction of Myocarditis
The investigation conformed to the Guide for the Care and Use of Laboratory Animals published by the US National Institutes of Health (NIH Publication, 8th edition, 2011). The study protocol was approved by the Institutional Animal Care and Use Committee of Yonsei University College of Medicine and Cardiovascular Research Institute (approval reference no. 2011-0136), and conformed to the guidelines of the American Heart Association.
The myocarditis model was produced by the method described by Inomata et al.9
Briefly, to induce inflammation, we used purified cardiac myosin (M0531, Sigma Aldrich, Schnelldorf, Germany) from porcine ventricular muscle as the antigen. Purified cardiac myosin at a concentration of 7 mg/ml was emulsified with an equal volume of complete Freund’s adjuvant (BD Biosciences, Heidelberg, Germany) supplemented with
Mycobacterium tuberculosis
H37 Ra (Difco, Detroit, MI, USA) at a concentration of 10 mg/ml. The 6-week-old male Lewis rats were immunized by subcutaneous injection of 2 mg of purified cardiac myosin in each of their footpads on days 1 and 8 (Myo group, n=15). Another group was injected with 6 mg/kg prednisolone into the gluteus muscle prior to the immunization (MyoS group, n=15). The control rats received injections of 0.5 ml of complete Freund’s adjuvant in the same manner (Control group, n=15). Ambulatory Holter monitoring was performed for 24 h using a telemetry system (Telemetry Research, Auckland, New Zealand).
Echocardiographic Examination
On the 21st day after the initial immunization, transthoracic echocardiography was performed while the rats were anesthetized by intraperitoneal administration of pentobarbital sodium (0.25 mg/kg, Dainihon Chemical Co, Osaka, Japan). The echocardiographic examination was done with a 15-MHz transducer (Vivid Q, General Electric-Vingmed, Milwaukee, WI, USA) and the M-mode echocardiogram was evaluated along the short-axis view of the left ventricle (LV) at the level of the papillary muscles. Left ventricular end-diastolic dimension and left ventricular endsystolic dimension were measured and the left ventricular ejection fraction (LVEF) was calculated from the M-mode echocardiograms.
Optical Mapping
On the 21st day, rats from 5 groups (250–300 g; Control, n=6; Myo, n=6; MyoS, n=6; Myo+KN92, n=5; Myo+KN93, n=5) were anesthetized with an intraperitoneal injection of ketamine (80 mg/kg) and xylazine (4 mg/kg). The chests were opened via median sternotomy and the hearts were rapidly excised and immersed in cold Tyrode’s solution (composition in mmol/L: 125 NaCl, 4.5 KCl, 0.25 MgCl2, 24 NaHCO3, 1.8 NaH2PO4, 1.8 CaCl2, and 5.5 glucose). The ascending aorta was immediately cannulated and perfused with 37°C Tyrode’s solution equilibrated with 95% O2
and 5% CO2
to maintain a pH of 7.4. Coronary perfusion pressure was regulated between 80 and 95 mmHg. For optical recording, the contractility of the heart was inhibited by 10–17µmol/L of blebbistatin.10
For dual membrane voltage (Vm) and intracellular Ca2+
(Cai) recordings, the hearts were stained with Rhod-2 AM and RH237 (Molecular Probes, Eugene, OR, USA) and excited with laser light at 532 nm.11
Fluorescence was collected using 2 cameras (MiCAM Ultima, BrainVision, Tokyo, Japan) at 1 ms/frame and 100×100 pixels with spatial resolution of 0.35×0.35 mm2/pixel. The mapped area included parts of the right and left ventricular free walls. Optical mapping were performed in 6, 6 and 6 rats in the Control, Myo and MyoS groups, respectively. To evaluate the effect of CaMKII activation on arrhythmia, optical mapping was performed in additional rats with myocarditis after active CaMKII blockade (KN 93, 1 μmol/L infusion) for 20 min (Myo+KN93 group, n=5) or inactive CaMKII blockade (KN 92, 1 μmol/L infusion) for 20 min (Myo+KN92 group, n=5).
Activation and repolarization time-points at each site were determined from the fluorescence (F) signals by calculating (dF/dt)max and (d2F/dt2)max, which have been shown to coincide with approximately 97% repolarization to baseline and recovery from refractoriness.12
APD was measured from (dF/dt)max to 90% recovery to baseline, APD90. Mean APD90
was calculated for each heart by averaging APD90
from a region of atrium consisting of 10×10 pixels or 100 APD90
from each heart for a minimum of 5 hearts. APD dispersion is defined as the difference between maximum and minimum APDs. The duration of calcium transients was determined from the maximum first derivative of the Cai
upstroke to the time point of 90% recovery of Cai
to its original baseline. Local conduction velocity (CV) vectors were calculated for each pixel from the differences in activation time-points of that pixel (determined from (dF/dt)max) and its 7×7 nearest neighbors, as previously described.12
Local CVs were averaged and calculated as mean±standard error of the mean (SEM). Local CV can be overestimated when 2 wave fronts collide, transmural propagation breaks through the surface or when activation appears synchronous over a region of the atrium because of its proximity to the pacing electrode. To avoid overestimations of CV, values >1.25 m/s were deleted from the analysis.13
Time and frequency domains analysis was achieved, as previously described.14
Programmed Stimulation
To test for vulnerability to ventricular tachycardia (VT), each heart was paced at the LV using a programmed stimulation protocol consisting of 20 S1
pulses at 250 ms cycle length (CL) followed by a premature S2
pulse with progressively shorter S1–S2
interval steps: 250 to 100 ms in 20 ms steps; 100 to 70 ms in 10 ms steps and 60 to 35 in 5 ms steps, until loss of capture or the initiation of VT. Optical mapping and VT induction studies were performed in 5 rats in each group.
Histology and Assay of Inflammatory Cytokines and Oxidative Stress
On the 21st day after initial immunization, hearts from 3 groups were immediately separated and weighed. The ratio of heart weight to body weight was calculated. In randomly selected rats, the heart was transversely sliced and fixed in 10% formalin, embedded in paraffin and stained with hematoxylin-eosin or Masson’s trichrome for histological evaluation. Quantification of inflammation and fibrotic area was expressed as the percentage of stained area in comparison with the total area of fields examined, using ImageJ, image analysis software (National Institutes of Health, Bethesda, MD, USA).
The immunoblotting of high-mobility group protein B1 (HMGB1), interleukin 6 (IL-6), tumor necrosis factor α (TNF-α), inducible nitric oxide synthase (iNOS) and cyclooxygenase-2 (Cox-2) was performed to evaluate the level of inflammation and oxidative stress of tissue. Targeted antigens were probed with the following primary antibodies: anti-HMGB1 (1:1,000, Abcam Reagents, Cambridge, MA, USA), anti-IL-6 (1:1,000, Abcam Reagents), anti-TNF-α (1:1,000, Abcam Reagents), anti-iNOS (1:1,000, Santa Cruz Biotechnology, Santa Cruz, CA, USA), anti-Cox-2 (1:1,000, Santa Cruz Biotechnology) and anti-GAPDH (1:1,000, Santa Cruz Biotechnology).
After development, the densities of each band in the digitized images were measured using the ImageJ program.
Blood was obtained from the abdominal aorta of each rat in the 3 groups on day 21. Enzyme-linked immunosorbent assay was performed to determine the levels of HMGB1, IL-6 and TNF-α in serum. According to the manufacturer’s instructions, protein levels in serum were quantified with HMGB1 (IBL International, Hamburg, Germany), IL-6 (R&D System, Minneapolis, MN, USA) and TNF-α (R&D System) kits.
Immunoblot Analysis of Ca2+
Handling Proteins
The protein levels of total CaMKIIδ (1:1,000; Santa Cruz Biotechnology), Thr287 and Thr306/Thr307 phosphorylated CaMKIIδ (1:1,000; Abcam Reagents), GAPDH (1:100,000; Abcam Reagents), total RyR2 (1:1,000; Abcam Reagents), Ser2808 and Ser2814 phosphorylated RyR2 (1:500 and 1:1,000, Badrilla, Leeds, UK), total phospholamban (PLB) (1:1,000; Santa Cruz Biotechnology), Thr17 phosphorylated PLB (1:1,000; Santa Cruz Biotechnology) and L-type calcium channel subunits α (1:1,000; Santa Cruz Biotechnology) were quantified by western blotting. Targeted antigens were visualized with the suitable horseradish peroxidase-conjugated secondary IgG (1:5,000; Santa Cruz Biotechnology) followed by enhanced chemiluminescence assay (ECL Plus, Amersham, Piscataway, NJ, USA). Bands were scanned and their intensities were quantified with the Image J software.
Statistical Analysis
Data are expressed as the mean±SEM. Statistical differences between groups were tested by ANOVA analysis with post-hoc Bonferroni test. ANOVAs and post-hoc were used to compare numeric variables of the 3 groups. P<0.05 was considered statistically significant.
Results
Arrhythmia and Survival of Myocarditis Rats
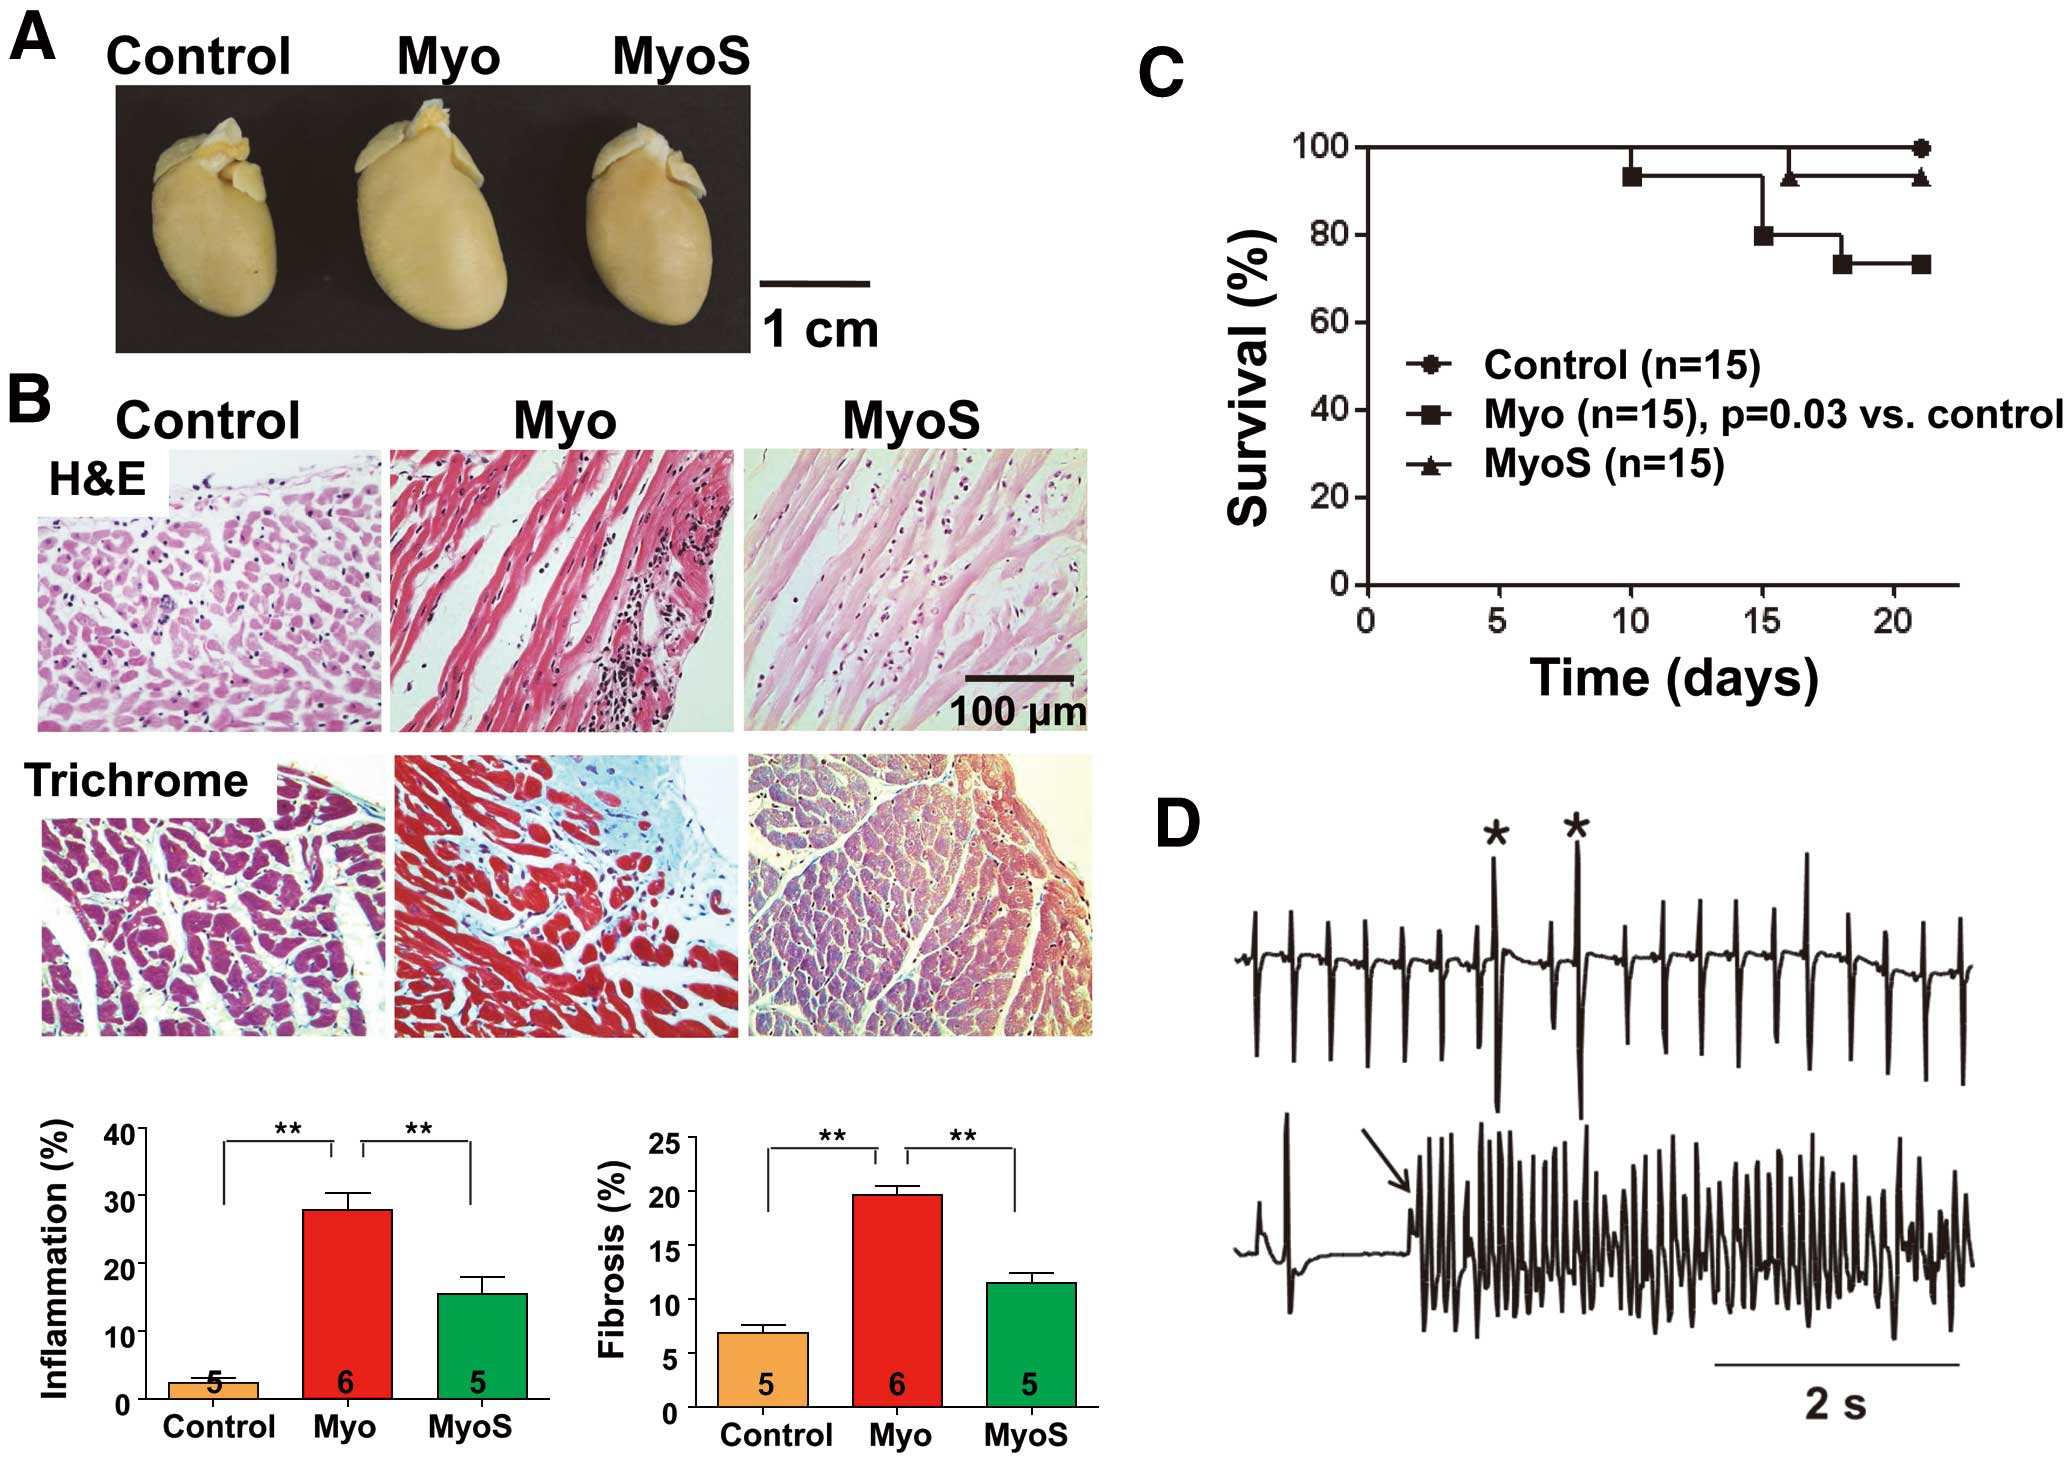
The heart weights were 1.2±0.1 g, 1.5±0.1 g and 1.3±0.0 g in the Control, Myo group and MyoS groups, respectively (Figure 1A). The ratios of heart weight to body weight were 3.2±0.3, 4.0±0.5 and 3.6±0.6, respectively. The Myo group had heavier heart weight than the Control (P=0.001) and MyoS groups (P=0.03). The ratios of heart weight to body weight were also larger in the Myo group than in controls (P=0.006).
Figure 1B
shows the histological analysis on 21 days after the initial immunization with cardiac myosin. Compared with controls, the infiltration of inflammatory cells was increased in Myo rats (2±1% vs. 28±5%, P<0.001). The infiltration of inflammatory cells was partially prevented in the MyoS group (15±5%, P=0.006). Myo rats showed increased levels of fibrosis compared with controls (6±2% vs. 20±2%, P<0.001). However, the MyoS group had less fibrosis than the Myo group (11±2%, P=0.013).
Figure 1C
shows the Kaplan-Meier survival curves of the 3 groups. The Myo group had lower survival rates than the controls (P=0.03).
Figure 1D
shows the ventricular premature beats and VT recorded by ambulatory Holter monitoring in the Myo group. Although arrhythmias were not observed in control rats, they were observed in 5 (56%) of the 9 surviving rats and 0 (0%) of 14 surviving rats in the Myo and MyoS groups, respectively (P=0.03).
Compared with controls, the myocarditis model showed decreased LVEF (83±3% vs. 58±7%, P<0.001) and increased LVDD (6.6±0.1 vs. 7.6±0.3 mm, P=0.005) and LVDS (5.3±0.6 vs. 3.4±0.4 mm, P=0.003) (Figure S1).
Increased Inflammation and Oxidative Stress in Myocarditis Model
Compared with the controls, HMGB1, IL-6, TNF-α, iNOS, Cox-2 expressions in the Myo group were increased by 3.1- (P<0.001), 2.8- (P=0.003), 2.2- (P=0.005), 1.8- (P<0.001) and 4.7-fold (P<0.001), respectively. After steroid treatment, compared with the Myo group, HMGB1, IL-6, and TNF-α expressions in the MyoS group were decreased by 0.23- (P<0.001), 0.64- (P=0.01) and 0.7-fold (P<0.001), respectively (Figure 2A). No significant differences in the levels of iNOS and Cox-2 were noted between Myo and MyoS rats.
On ELISA, the Myo group had increased serum levels of HMGB1 (11.6±0.2 vs. 45.0±2.3 ng/ml, P<0.001), IL-6 (48.5±8.4 vs. 97.6±35.8 pg/ml, P<0.001) and TNF-α (16.2±0.3 vs. 18.0±0.6 pg/ml, P<0.001) than controls. However, these inflammatory markers did not increase in the MyoS group (Figure 2B).
Increased APD and APD Dispersion in Myocarditis Model
Figure 3A
shows the Vm
and Cai
tracings recorded at the base of the LV during pacing CLs of 300 ms in the Langendorff-perfused hearts. The Myo group had longer APD with increased Cai
transient duration than the Control and MyoS groups.
Figure 3B
shows the activation and APD maps. Compared with the Control and MyoS groups, the Myo group showed crowding of activation isochronal lines, suggesting increased conduction time of the ventricle. Compared with controls (13±4 ms), APD dispersion was increased in the Myo group (43±16 ms, P=0.001), but not in the MyoS group (17±5 ms, P=1.0). To evaluate the relationship between myocarditis-induced arrhythmia and CaMKII activation, we recorded the action potential after pretreatment with CaMKII inhibitor. Myocarditis-induced APD prolongation was prevented by pretreatment with KN 93 (1 μmol/L) for 20 min, but not by KN 92 (1 μmol/L) for 20 min. The comparison of mean APD90
among the groups is presented in
Figure 3C
and the comparison of mean Cai
transient duration is shown in
Figure S2. The Myo group had a longer mean APD90
with increased Cai
transient duration than either the Control or MyoS group.

Figure 4
shows an example of spontaneous triggered activity and VT observed in the myocarditis model. Beats 1–3 each had the same normal conduction pattern, originating from the left upper left side of the recording window, while beat 4 was a spontaneously triggered beat originating from apex of the LV (site 2). Beat 5 also had the same normal conduction pattern. The subsequent 3 beats (6–9) also originated from the same site (site 2).
Spontaneous triggered activities were observed in 1 (17%), 5 (83%) and 2 (33%) rats in the Control (n=6), Myo (n=6) and MyoS (n=6) groups, respectively. Spontaneous triggered activities were more frequently observed in the Myo group than in the Control group (P=0.02). The Myo+KN 93 group had a significantly lower incidence of spontaneous VT (P=0.02) than the Myo group.
By programmed stimulation, VT were induced in 0, 4 (80%), and 0 (0%) rats in the Control (n=5), Myo (n=5), and MyoS (n=5) groups, respectively. Hearts with myocarditis had higher inducible VT or ventricular fibrillation (VF) than controls (P=0.01). Steroid treatment prevented inducible VT or VF after myocarditis was induced (P=0.01). Inducible ventricular arrhythmias were not observed in the Myo+KN 93 group, but in 2 of 3 hearts from the Myo+KN 92 group.
Conduction Heterogeneities in Myocarditis Model
The CV vector maps showed that conduction was significantly slower in the Myo group than in the other groups and conduction was more heterogeneous in the Myo group than in the other groups (Figures 5A,B). To quantify this heterogeneous of conduction, the conduction heterogeneity index across 5 tested pacing CLs was calculated. There was a significantly higher conduction heterogeneity in the hearts with myocarditis than in those of the other groups at all pacing CLs (P<0.001,
Figure 5B).

For the Control (n=4), Myo (n=4) and MyoS (n=4) groups, the discordant alternans heart rate threshold was 673±76, 306±34 and 527±25 beats/min, respectively (Figure S3). Compared with the Control (P<0.001) and MyoS groups (P=0.01), the Myo group showed a significantly decreased the heart rate at which discordant alternans was elicited. Moreover, conduction block and reentry were also observed at a lower heart rate in the Myo group than in the other groups (886±103 vs. 502±42 beats/min, P=0.001) (Figure 6).
Increased p-CaMKII, RyR2 and p-PLB in Myocarditis
We assessed CaMKII, RyR2 and PLB expressions and relative phosphorylation levels by western blotting.
Figure 7
shows the Ca2+
handling protein assay in rat ventricular tissues. CaMKII and Thr287-CaMKII protein expressions were significantly increased in myocarditis tissue lysates (P<0.001), with unaltered Thr306-CaMKII (Figure 7A). With slightly increased total RyR2 (P=0.01), both Ser2808-RyR2 and Ser2814-RyR2 protein expression was significantly increased in myocarditis tissue lysates (P<0.001). CaMKII autophosphorylation at Thr287 (201%), RyR2 phosphorylation at Ser2808 (protein kinase A/CaMKII site, 126%) and Ser2814 (CaMKII site, 21%) were increased in myocarditis and reversed after steroid treatment. Moreover, the levels of the ratio of Thr17-PLB to total PLB, which decreased in Myo hearts (80%), were restored by steroid treatment (Figure 7C). However, the protein levels of L-type calcium channel α-subunits were unaltered in myocarditis (Figure S4).
Discussion
Main Findings
Firstly, rats with myocarditis showed decreased survival and increased incidence of fatal VT. Secondly, spontaneous triggered activity and VT inducibility were increased in myocarditis, and partially reversed by treatment with steroid and CaMKII inhibitor, KN93. Thirdly, the myocarditis model showed increased activity of Ca2+
handling proteins, including p-CaMKII and p-RyR2. Finally, myocarditis-related arrhythmias and activation of Ca2+
handling proteins were partially attenuated by steroid pretreatment. Our results suggest that the mechanism of arrhythmia in myocarditis might be related with the increased phosphorylation of Ca2+
handling proteins caused with the inflammation and oxidative stress.
Increased Phosphorylation of Ca2+
Handling Proteins in Myocarditis
Abundant evidence now supports an important role of CaMKII in promoting heart failure and arrhythmias by its actions on SR Ca2+
uptake and release.15
The mechanism of CaMKII hyperactivity in heart failure is likely attributable to either autophosphorylation of threonine 287 and/or oxidation of methionines 281 and 282.16
In the present study, we found that the phosphorylation of CaMKII at Thr 287 was increased in myocarditis, suggesting the mechanism of CaMKII hyperactivity is attributable to autophosphorylation of threonine 287.
RyR2 is a SR Ca2+
release channel that is activated by a trigger of Ca2+
from
ICa.17
RyR2 phosphorylation by both protein kinase A and CaMKII enhances
ICa
and RyR2 Ca2+
release. CaMKII helps coordinate this physiological process of Ca2+-induced Ca2+
release by phosphorylation of CaV1.2 and RyR2. However, in failing myocytes the cell membrane ultrastructure supporting Ca2+-induced Ca2+
release is distorted18
and CaMKII hyperphosphorylation of CaV1.2 and RyR2 becomes arrhythmogenic. RyR2 is phosphorylated by CaMKII (serine 2814) and PKA (serine 2814 and 2808). In this study, myocarditis was associated with increased phosphorylation of serine 2814 and serine 2808 of RyR2. The hyperphosphorylation of RyR2 promotes RyR2 Ca2+
leak and arrhythmia-triggering delayed afterdepolarizations19
while depleting SR Ca2+
to impair inotropy.20–24
Previous studies have reported initial reduction of
Ito
-related molecules, such as the expression levels of Kv4.2, Kv1.5, frequenin and KChIP2, in a myocarditis model.25,26
However, the role of Ca2+
handling protein has not been evaluated in myocarditis. To our knowledge, ours is the first study to suggest that the activation of Ca2+
handling proteins might be a mechanism of myocarditis-induced arrhythmias.
Mechanism of Ventricular Arrhythmia in Myocarditis
In this study, the myocarditis model showed electrophysiological features characterized by increases in APD, APD dispersion and CV heterogeneity. Although APD prolongation is the main mechanism of long QT syndrome, enhanced dispersion of repolarization is critical to induce fatal arrhythmia.27
The increased level of fibrosis might be the mechanism of conduction disturbance.
Another interesting electrophysiological finding from this myocarditis model was increased spatially discordant alternans. Spatially discordant alternans causes an increase in the spatial dispersion of repolarization, and is thought to result in T-wave alternans,28
which is a precursor of cardiac electrical instability and consequently sudden cardiac death.29
Spatially discordant alternans can be explained by increased steepness of the APD restitution slope in myocarditis. A steep slope of electrical restitution predisposes to the breakup of single spiral waves into multiple spiral waves, a process that may account for the transition from VT to VF.30,31
A slope of electrical restitution ≥1 is especially related to VF.32
Secondly, discordant alternans could be related to altered Ca2+
handling proteins. The net effects of myocarditis remodeling promote Ca2+
alternans via increased phosphorylation of RyRs and CaMKII signaling to increase their Ca2+
sensitivity (increasing both gain and leak).33,34
Attenuation of Myocarditis-Induced Arrhythmia by Antiinflammatory Therapy
Inflammatory cytokines, such as HMGB-1, TNF-α or IL-6, and oxidative stress were overexpressed in rats with myocarditis.
As these inflammatory cytokines are strong inducers of reactive oxygen species, this inflammatory process may promote cardiac injury and electrical remodeling.6,35
Niwano et al reported that the N-acetylcysteine treatment suppressed ventricular remodeling in myocarditis rats.36
This study consistently showed that steroid pretreatment was related to improved survival and suppression of arrhythmias in the rats with myocarditis. Therefore, the prevention of inflammation might suppress arrhythmia by preventing either remodeling or myocarditis itself.
Study Limitations
We induced myocarditis by injection of cardiac myosin, so our results cannot explain the exact mechanisms of myocarditis-related arrhythmia, which is mostly caused by viral infection or other etiologies. However, autoimmunization to myosin might be a common pathway of myocarditis.37
Conclusions
A rat myocarditis model showed increased arrhythmia and increased activity of Ca2+
handling proteins, including p-CaMKII and p-RyR2, suggesting that the mechanism of arrhythmia in myocarditis might be related to increased phosphorylation of Ca2+
handling proteins caused by inflammation and oxidative stress.
Acknowledgments
This study was supported in part by research grants from the Korean Heart Rhythm Society (2011-3), the Basic Science Research Program through the National Research Foundation of Korea funded by the Ministry of Education, Science and Technology (NRF-2010-0021993, NRF-2012R1A2A2A02045367), and a grant of the Korean Healthcare technology R&D project funded by Ministry of Health & Welfare (HI12C1552). We thank Michael Hahm for his English correction.
Conflict of Interest
The authors have declared that no conflict of interest exists.
Supplementary Files
Supplementary File 1
Figure S1. Myocarditis-induced cardiac dysfunction.
Figure S2. Comparision of mean Cai transient duration among groups.
Figure S3. Aggravated spatially discordant alternans in autoimmune myocarditis.
Figure S4. Change in the protein expression levels of the L-type calcium channel (LTCC).
Please find supplementary file(s);
http://dx.doi.org/10.1253/circj.CJ-14-0277
References
- 1.
Eriksson U, Penninger JM. Autoimmune heart failure: New understandings of pathogenesis. Int J Biochem Cell Biol 2005; 37: 27–32.
- 2.
Saji T, Matsuura H, Hasegawa K, Nishikawa T, Yamamoto E, Ohki H, et al. Comparison of the clinical presentation, treatment, and outcome of fulminant and acute myocarditis in children. Circ J 2012; 76: 1222–1228.
- 3.
Feldman AM, McNamara D. Myocarditis. N Engl J Med 2000; 343: 1388–1398.
- 4.
Ito S, Kamegai A, Murakami Y, Nakasuka K, Sekimoto S, Miyata K, et al. Persistent electrical scar in the atrium evaluated on voltage mapping with a CARTO system in suspected acute myocarditis. Circ J 2012; 76: 2895–2897.
- 5.
Levi D, Alejos J. Diagnosis and treatment of pediatric viral myocarditis. Curr Opin Cardiol 2001; 16: 77–83.
- 6.
Kodama M, Matsumoto Y, Fujiwara M, Masani F, Izumi T, Shibata A. A novel experimental model of giant cell myocarditis induced in rats by immunization with cardiac myosin fraction. Clin Immunol Immunopathol 1990; 57: 250–262.
- 7.
Erickson JR, Joiner ML, Guan X, Kutschke W, Yang J, Oddis CV, et al. A dynamic pathway for calcium-independent activation of CaMKII by methionine oxidation. Cell 2008; 133: 462–474.
- 8.
Xie LH, Chen F, Karagueuzian HS, Weiss JN. Oxidative-stress-induced afterdepolarizations and calmodulin kinase II signaling. Circ Res 2009; 104: 79–86.
- 9.
Inomata T, Hanawa H, Miyanishi T, Yajima E, Nakayama S, Maita T, et al. Localization of porcine cardiac myosin epitopes that induce experimental autoimmune myocarditis. Circ Res 1995; 76: 726–733.
- 10.
Joung B, Tang L, Maruyama M, Han S, Chen Z, Stucky M, et al. Intracellular calcium dynamics and acceleration of sinus rhythm by beta-adrenergic stimulation. Circulation 2009; 119: 788–796.
- 11.
Hwang GS, Hayashi H, Tang L, Ogawa M, Hernandez H, Tan AY, et al. Intracellular calcium and vulnerability to fibrillation and defibrillation in Langendorff-perfused rabbit ventricles. Circulation 2006; 114: 2595–2603.
- 12.
Efimov IR, Huang DT, Rendt JM, Salama G. Optical mapping of repolarization and refractoriness from intact hearts. Circulation 1994; 90: 1469–1480.
- 13.
Ziv O, Morales E, Song YK, Peng X, Odening KE, Buxton AE, et al. Origin of complex behaviour of spatially discordant alternans in a transgenic rabbit model of type 2 long QT syndrome. J Physiol 2009; 587: 4661–4680.
- 14.
Choi BR, Nho W, Liu T, Salama G. Life span of ventricular fibrillation frequencies. Circ Res 2002; 91: 339–345.
- 15.
Wehrens XH. CaMKII regulation of the cardiac ryanodine receptor and sarcoplasmic reticulum calcium release. Heart Rhythm 2011; 8: 323–325.
- 16.
Swaminathan PD, Purohit A, Hund TJ, Anderson ME. Calmodulin-dependent protein kinase II: Linking heart failure and arrhythmias. Circ Res 2012; 110: 1661–1677.
- 17.
Fabiato A. Calcium-induced release of calcium from the cardiac sarcoplasmic reticulum. Am J Physiol 1983; 245: C1–C14.
- 18.
Song LS, Sobie EA, McCulle S, Lederer WJ, Balke CW, Cheng H. Orphaned ryanodine receptors in the failing heart. Proc Natl Acad Sci USA 2006; 103: 4305–4310.
- 19.
Ai X, Curran JW, Shannon TR, Bers DM, Pogwizd SM. Ca2+/calmodulin-dependent protein kinase modulates cardiac ryanodine receptor phosphorylation and sarcoplasmic reticulum Ca2+ leak in heart failure. Circ Res 2005; 97: 1314–1322.
- 20.
Wehrens XH, Lehnart SE, Reiken SR, Marks AR. Ca2+/calmodulin-dependent protein kinase II phosphorylation regulates the cardiac ryanodine receptor. Circ Res 2004; 94: e61–e70, doi:10.1161/01.RES.0000125626.33738.E2.
- 21.
Rodriguez P, Bhogal MS, Colyer J. Stoichiometric phosphorylation of cardiac ryanodine receptor on serine 2809 by calmodulin-dependent kinase II and protein kinase A. J Biol Chem 2003; 278: 38593–38600.
- 22.
Li L, Satoh H, Ginsburg KS, Bers DM. The effect of Ca(2+)-calmodulin-dependent protein kinase II on cardiac excitation-contraction coupling in ferret ventricular myocytes. J Physiol 1997; 501: 17–31.
- 23.
Guo T, Zhang T, Mestril R, Bers DM. Ca2+/Calmodulin-dependent protein kinase II phosphorylation of ryanodine receptor does affect calcium sparks in mouse ventricular myocytes. Circ Res 2006; 99: 398–406.
- 24.
Yang D, Zhu WZ, Xiao B, Brochet DX, Chen SR, Lakatta EG, et al. Ca2+/calmodulin kinase II-dependent phosphorylation of ryanodine receptors suppresses Ca2+ sparks and Ca2+ waves in cardiac myocytes. Circ Res 2007; 100: 399–407.
- 25.
Saito J, Niwano S, Niwano H, Inomata T, Yumoto Y, Ikeda K, et al. Electrical remodeling of the ventricular myocardium in myocarditis: Studies of rat experimental autoimmune myocarditis. Circ J 2002; 66: 97–103.
- 26.
Wakisaka Y, Niwano S, Niwano H, Saito J, Yoshida T, Hirasawa S, et al. Structural and electrical ventricular remodeling in rat acute myocarditis and subsequent heart failure. Cardiovasc Res 2004; 63: 689–699.
- 27.
Antzelevitch C. Ionic, molecular, and cellular bases of QT-interval prolongation and torsade de pointes. Europace 2007; 63: 689–699.
- 28.
Pastore JM, Girouard SD, Laurita KR, Akar FG, Rosenbaum DS. Mechanism linking T-wave alternans to the genesis of cardiac fibrillation. Circulation 1999; 9(Suppl 4): iv4–iv15.
- 29.
Rosenbaum DS, Jackson LE, Smith JM, Garan H, Ruskin JN, Cohen RJ. Electrical alternans and vulnerability to ventricular arrhythmias. N Engl J Med 1994; 330: 235–241.
- 30.
Karma A. Electrical alternans and spiral wave breakup in cardiac tissue. Chaos 1994; 4: 461–472.
- 31.
Witkowski FX, Leon LJ, Penkoske PA, Giles WR, Spano ML, Ditto WL, et al. Spatiotemporal evolution of ventricular fibrillation. Nature 1998; 392: 78–82.
- 32.
Riccio ML, Koller ML, Gilmour RF
Jr. Electrical restitution and spatiotemporal organization during ventricular fibrillation. Circ Res 1999; 84: 955–963.
- 33.
Wehrens XH, Lehnart SE, Marks AR. Intracellular calcium release and cardiac disease. Annu Rev Physiol 2005; 67: 69–98.
- 34.
Curran J, Hinton MJ, Rios E, Bers DM, Shannon TR. Beta-adrenergic enhancement of sarcoplasmic reticulum calcium leak in cardiac myocytes is mediated by calcium/calmodulin-dependent protein kinase. Circ Res 2007; 100: 391–398.
- 35.
Okura Y, Yamamoto T, Goto S, Inomata T, Hirono S, Hanawa H, et al. Characterization of cytokine and iNOS mRNA expression in situ during the course of experimental autoimmune myocarditis in rats. J Mol Cell Cardiol 1997; 29: 491–502.
- 36.
Niwano S, Niwano H, Sasaki S, Fukaya H, Yuge M, Imaki R, et al. N-acetylcysteine suppresses the progression of ventricular remodeling in acute myocarditis: Studies in an experimental autoimmune myocarditis (EAM) model. Circ J 2011; 75: 662–671.
- 37.
Kindermann I, Barth C, Mahfoud F, Ukena C, Lenski M, Yilmaz A, et al. Update on myocarditis. J Am Coll Cardiol 2012; 59: 779–792.