Abstract
Background:
Atherosclerotic plaque thrombogenicity is a critical factor that affects thrombus formation and the onset of acute myocardial infarction (AMI). The aim of this study was to identify the vascular factors involved in thrombus formation and AMI onset.
Methods and Results:
Culprit lesions in 40 coronary arteries with thrombi at autopsy after lethal AMI and non-cardiac death (asymptomatic plaque disruption) were analyzed on histology. Thrombus size, ratio of thrombus to lumen area, length of plaque disruption, and immunopositive areas for tissue factor (TF) and hexokinase (HK)-II were significantly larger in coronary arteries with AMI than with asymptomatic plaque disruption. The size of coronary thrombus positively correlated with the length of plaque disruption (r=0.80) and with immunopositive areas for TF (r=0.38) and HK-II (r=0.40). Because both M1 and M2 macrophages express TF and HK-II in symptomatic plaques, we assessed TF and HK-II expression in M1- and M2-polarized macrophages. The expression of TF was increased and that of HK-II was decreased in M2-, compared with M1-polarized THP-1 macrophages. Inhibiting glycolysis enhanced TF expression in the macrophages partly via hypoxia inducible factor-1α.
Conclusions:
The degree of plaque disruption and expression of TF and HK-II appear to be important vascular factors for AMI onset, and polarized macrophages make a distinct contribution to thrombogenicity and glucose metabolism. (Circ J 2015; 79: 2430–2438)
Thrombus formation on disrupted atherosclerotic plaque is a critical event that leads to atherothrombosis,1
but it does not always result in complete thrombotic occlusion with subsequent acute symptomatic events.2
Clinical angioscopy has indicated that multiple plaque rupture is a frequent complication in patients with coronary atherothrombosis.3
Plaque disruption in various stages of healing is also occasionally evident on autopsy with or without coronary atherothrombosis.4
Therefore, plaque disruption is not the final step, whereas large thrombus formation is critical to the onset of clinical events. The thrombogenicity of exposed plaque contents, local hemorheology and blood factors are thought to affect atherothrombus formation. Among them, atherosclerotic vascular change is essential for atherothrombosis. Determinants of thrombotic occlusion after plaque disruption remain unknown.
Tissue factor (TF) is an initiator of the coagulation cascade that is normally expressed in adventitia and to various degrees in the media of normal arteries.5
Atherosclerotic lesions express active TF, which is thus considered a major determinant of vascular wall thrombogenicity.6
Positron emission tomography (PET) using [18F]-fluorodeoxyglucose (18F-FDG) has been advocated as a means of evaluating arterial inflammation. The uptake of 18F-FDG closely correlates with plaque macrophage contents in animal models and human carotid plaque.7,8
We recently found that arterial 18F-FDG uptake reflects TF expression and vascular thrombogenicity in rabbits.9
This implies an association between arterial glucose metabolism and vascular thrombogenicity.
We investigated which vascular factors affect the size of coronary thrombus in autopsy cases of acute myocardial infarction (AMI) and non-cardiac death (asymptomatic plaque disruption).
Methods
Coronary Arteries in Non-Cardiac Death and AMI
The Ethics Committees at the participating institutions approved the study protocol (Approval No. 942). We assessed thrombotic coronary arteries from 35 individuals who had died of non-cardiac causes (20 coronary lesions from 15 patient) or AMI (20 coronary lesions from 19 patients).
The major epicardial coronary arteries (left main, left anterior descending, left circumflex, and right coronary arteries) isolated from formalin-fixed hearts as described2
were cut transversely at 3-mm intervals (after decalcification if necessary) and embedded in paraffin for histological evaluation. Sections (4 μm thick) were stained with hematoxylin and eosin for morphological evaluation. Consecutive sections were analyzed on immunohistochemistry.
The non-cardiac causes of death consisted of malignancy (n=8; 53%), pneumonia (n=3; 20%) and other causes, namely chronic renal failure, subarachnoid hemorrhage, and pulmonary hemorrhage (n=4; 27%). Hypertension was defined as blood pressure ≥140/90 mmHg or medication with anti-hypertensive agents. Diabetes mellitus was defined as fasting glucose ≥126 mg/dl, random non-fasting glucose ≥200 mg/dl hemoglobin A1c ≥6.5% or medication with anti-hyperglycemic agents. Hyperlipidemia was defined as total cholesterol ≥220 mg/dl, low-density lipoprotein (LDL) ≥140 mg/dl, triglycerides ≥150 mg/dl or medication with an oral lipid-lowering agent. Obesity was defined as body mass index ≥25 kg/mm2.
Table S1
lists the clinical characteristics of non-cardiac death and AMI at autopsy. The clinical background except for hypertension did not significantly differ between the groups.
Immunohistochemistry
Consecutive 4-μm slices were stained using antibodies against α-smooth muscle actin (SMA; 1A4, Dako, Glostrup, Denmark), CD68 (PGM-1; Dako), glucose transporter-1 (Glut-1; Acris, Herford, Germany), hexokinase-II (HK-II; Abcam, Cambridge, UK) and TF (Santa Cruz Biotechnology, Dallas, TX, USA). The sections were stained with Envision (Dako) or donkey anti-rabbit IgG secondary antibody (Jackson ImmunoResearch, Baltimore, MA, USA). Horseradish peroxidase activity was visualized using 3,3’-diaminobenzidine tetrahydrochloride, and Meyer’s hematoxylin counterstain. Immunostaining controls included non-immune mouse or rabbit IgG instead of primary antibodies.
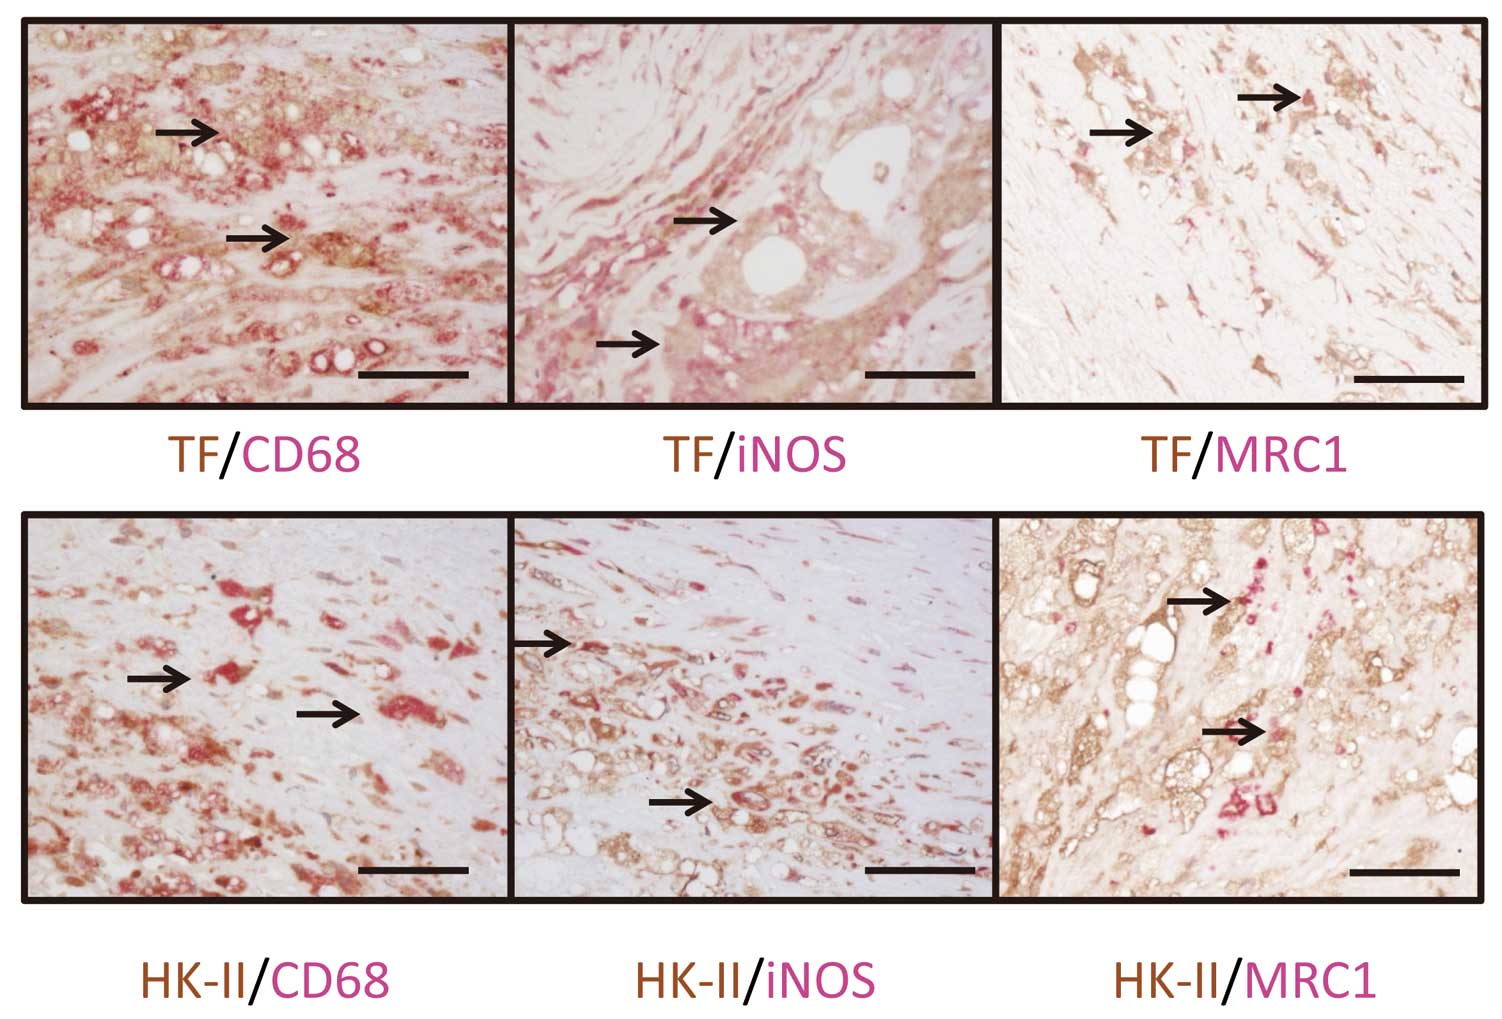
We performed double immunohistochemical staining for TF (Santa Cruz) and CD68 (PGM-1; Dako), inducible nitric oxide synthase (iNOS; mouse monoclonal, Novus, Littleton, CO, USA) and mannose receptor C-1 (MRC-1; mouse monoclonal, LifeSpan Biosciences, Seattle, WA, USA) using the MACH2 Double Stain 1 kit (Biocare Medical, Concord, CA, USA), and for HK-II (Abcam) and CD68 (rabbit polyclonal, Spring Bioscience, Pleasanton, CA, USA), iNOS (rabbit polyclonal, Novus), or MRC-1 (rabbit polyclonal, Atras Antibodies, Stockholm, Sweden) using the MACH2 Double Stain 2 kit (Biocare Medical).
Quantitative Methods
Thrombus size, ratio of thrombus to lumen area, degree of luminal narrowing, ratio of plaque to media area, area of necrotic core and length of plaque disruption were measured in sections under a microscope using NIS-Element-D 3.2 (Nikon, Tokyo, Japan). The length of plaque disruption was defined as the extent of disrupted fibrous cap over a lipid core and/or the extent of damage beneath mural thrombi. Areas of SMA, CD68, and TF were semiquantified using Win Roof (Mitani, Fukui, Japan).10
These areas are expressed as a ratio of positively stained areas per total vascular area. Nucleated cells that were immunopositive for Glut-1 and HK-II in the coronary arterial wall were counted under 200× magnification, and cell density is expressed as the number of immunopositive cells per mm2.
Cell Culture
Human THP-1 cells (Dainippon Sumitomo Pharm, Suita, Japan) were cultured in RPMI1640 (Dainippon Sumitomo Pharm) supplemented with 10% heat-inactivated fetal bovine serum, penicillin (100 U/ml), and streptomycin (100 μg/ml). THP-1 cells (1.0×10⁵
cells/cm2) were differentiated into macrophages using 125 nmol/L phorbol 12-myristate 13-acetate (PMA; Sigma, St. Louis, MO, USA), and polarized as described with modification.11,12
Cells were incubated with PMA for 6 h and then cultured with PMA plus tumor necrosis factor (TNF-α; 10 ng/ml; Sigma-Aldrich) and interferon-γ (INF-γ; 20 ng/ml; R & D Systems, Minneapolis, MN, USA) for a further 42 h to polarize them to the M1 phenotype. Cells were polarized to the M2 phenotype by incubation with PMA for 6 h, followed by PMA and 20 ng/ml each of interleukin (IL)-4 and IL-13 (both Sigma-Aldrich) for a further 42 h. Control macrophages consisted of THP-1 cells cultured with PMA for 48 h. Appropriate induction of polarization was evaluated by measuring the expression of M1 and M2 marker genes,
IL-6,
TNF-α, and
MRC-1. We assessed TF and HK-II mRNA and protein expression and procoagulant activity in these macrophages 42 h later. We measured lactate level in the supernatant using a lactate oxidase-based method, and normalized values to total cellular protein or total RNA. The TF mRNA stability in polarized macrophages was assessed with actinomycin D, a transcriptional inhibitor (10 μg/ml; Sigma). The contribution of glycolysis to TF expression was evaluated by culturing THP-1 macrophages with or without the glycolysis inhibitor 2 deoxyglucose (2DG; 5 mmol/L; Sigma) and hypoxia inducible factor (HIF)-1α inhibitor (dimethyl bisphonol A; 100 μmol/L; Abcam).
Quantitative Real-Time PCR
Complementary DNA (cDNA) was prepared using Primescript RT Master Mix kits (Takara Bio, Otsu, Japan), from cellular total RNA isolated using Trizol (Life Technologies, Carlsbad, CA, USA) and PureLinkTM
RNA mini kits (Life Technologies). The cDNA was assessed using quantitative PCR on a LightCycler 480 (Roche Applied Science, Penxberg, Germany) with SYBR Premix Ex TagTM
kits (Takara Bio) and the specific primers listed in
Table S2. Amounts of messenger RNA (mRNA) were subsequently normalized to those of β-actin, and are shown as fold change relative to the mean of control or M1-polarized macrophages.
ELISA and Western Blot
Cellular proteins were extracted using a mammalian protein extraction reagent (Thermo Fisher Scientific, Waltham, MA, USA) with 1% protease inhibitor cocktail (Thermo Fisher). Protein concentrations were determined using DC protein assay kits (Biorad, Hercules, CA, USA) and TF protein expression in M1- and M2-polarized macrophages was measured using Quantikine ELISA for human TF kits (R & D Systems).
The expression of HK-II in M1- and M2-polarized macrophages was analyzed on sodium dodecyl sulfate-polyacrylamide gel electrophoresis (SDS-PAGE) using 4–20% gels (Technical Frontier, Tokyo, Japan). Samples were incubated with sample buffer containing SDS and 2-mercaptoethanol for 3 min at 98℃ before SDS-PAGE. Separated proteins were electrophoretically transferred to Immobilon membranes (Millipore, Billerica, MA, USA). Non-specific binding was blocked overnight with 5% skimmed milk, and then the separated proteins were incubated with anti-HK-II antibody (Abcam) and β-actin (Sigma) followed by horseradish peroxidase conjugated anti-mouse IgG (Nacalai Tesque, Kyoto, Japan). Proteins of interest were detected on chemiluminescence using a LAS-4000 Lumino image analyzer (Fujifilm, Tokyo, Japan).
Transcriptional Factors in Nuclear Proteins
Nuclear proteins were extracted from cultured THP-1 macrophages using a nuclear extraction kit (Affymetrix, Santa Clara, CA, USA). The protein concentrations were determined using DC protein assay kits (Biorad). The binding activities of AP-1, nuclear factor (NF)-κB p65 and SP-1 nucleotide were assessed using a transcriptional factor activation ELISA kit (Affymetrix). Concentration of Egr-1 and HIF-1α was measured using ELISA kits (Egr-1; Cusabio Biotech, Wuhan, China, HIF-1α; Abcam).
Procoagulant Activity of M1- and M2-Polarized Macrophages
The procoagulant activity of M1- and M2-polarized macrophages was assessed based on rabbit plasma clotting times using a Thrombotrack AXIS-SHIELD coagulation timer (PoC AS, Oslo, Norway). Adherent cells were detached using trypsin-EDTA. Plasma clotting was initiated by adding 0.5×10⁵
macrophages in 100 μl of Tris-buffered saline (pH 7.4) containing 5 mmol/L CaCl2
and 20 mmol/L CaCl2
(100 μl). A standard curve was constructed from serial dilutions of TF derived from human placenta (Thromborel S; Sysmex, Kobe, Japan) and procoagulant activity is expressed as arbitrary units.
Statistical Analysis
All data are presented as mean±SD. Categorical variables were compared using Fisher’s exact test. Differences between groups were analyzed using the Mann-Whitney U-test or unpaired t-test. Differences among individual groups were analyzed using one-way ANOVA with the Bonferroni multiple comparison test or two-way ANOVA (GraphPad Prizm 6; GraphPad Software, San Diego, CA, USA). Relationships between factors were evaluated using Spearman’s rank correlation coefficient, and P<0.05 was considered significant.
Results
Large Thrombus Formation and Thrombotic Occlusion on Symptomatic Plaque
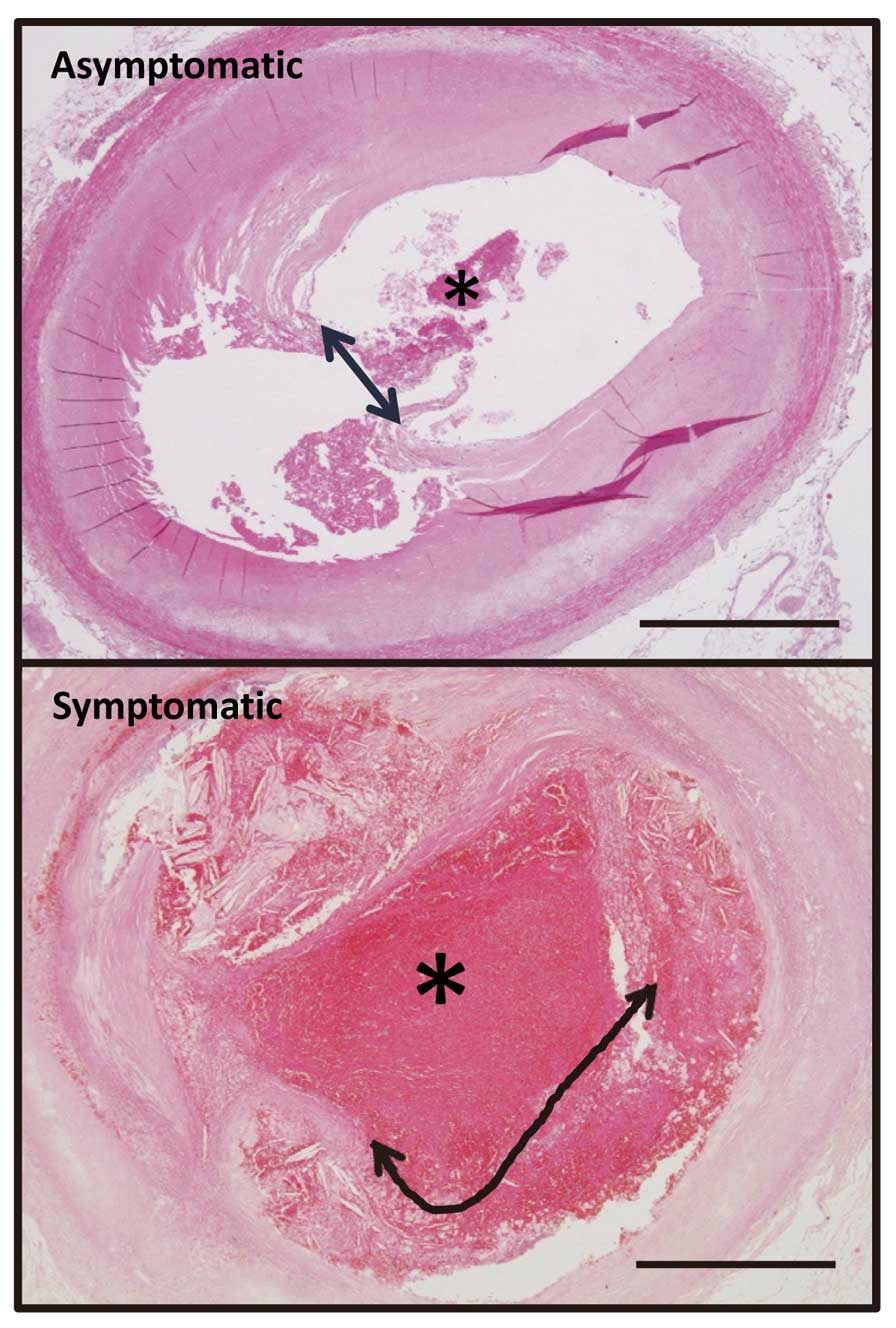
Vascular factors at autopsy associated with symptomatic and asymptomatic coronary thrombi were examined on histology. The size of the thrombus, ratio of thrombus to lumen area, degree of luminal narrowing, ratio of plaque to media area, area of necrotic core, and length of plaque disruption were measured at arterial sections with thrombi. The length of plaque disruption was defined as the extent of a disrupted fibrous cap over a lipid core and/or the extent of damage beneath a mural thrombus (Figure 1). The thrombus size, ratio of thrombus to lumen area, length of plaque disruption, ratio of intima and media area, stenotic ratio, and necrotic core area were larger in symptomatic, than in asymptomatic thrombi (Figure 2A).
Figure 2B
shows histological and immunohistochemical findings for CD68 (macrophage) and SMA (SMC) in symptomatic and asymptomatic coronary thrombi. Both types of arteries have plaque disruption and thrombus formation, as well as macrophage accumulation and loss of SMC at the disrupted site. Areas immunopositive for SMC and macrophages were smaller and larger in symptomatic disrupted, than in asymptomatic plaque, respectively, but the difference did not reach statistical significance (Figure 2A). TF was localized along the rim of the necrotic core or in the superficial portions of disrupted plaque (Figure 2C). The TF immunopositive area was larger in symptomatic, than in asymptomatic thrombotic plaque (Figure 2A).
Figure 2D
shows histological and immunohistochemical findings for CD68, Glut-1 and HK-II. Plaque cells expressed Glut-1 and HK-II in macrophage-rich areas, and 10-fold more nucleated cells were immunopositive for HK-II than for Glut-1 (Figure 2A). Erythrocytes in thrombus and plaques were also immunopositive for Glut-1. We excluded them, because this does not always reflect vascular metabolism. More cells were immunopositive for Glut-1 and HK-II cells in symptomatic, than in asymptomatic thrombotic plaques (Figure 2A). The ratios of Glut-1 and of HK-II immunopositive cells to CD68 immunopositive area were higher in symptomatic, than in asymptomatic thrombotic plaques (Figure 2A).
Double immunohistochemical staining showed that the cells expressing TF and HK-II in symptomatic thrombotic plaques were predominantly macrophages. Therefore, we examined TF and HK-II expression by macrophages that were iNOS (a M1 marker) or MRC-1 (a M2 marker) positive in plaques. Both, but not all, iNOS- and MRC-1-immunopositive cells expressed TF and HK-II (Figure 3).
Coronary Thrombus Formation and Vascular Parameters
Table
shows the relationship between thrombotic and vascular parameters. Thrombus size significantly correlated with length of plaque disruption and expression of TF and HK-II. The ratio of thrombus to lumen area significantly correlated with the length of plaque disruption, luminal stenosis, area of necrotic core, and expression of TF and HK-II.
Table.
Thrombotic and Vascular Parameter Correlation
| |
Thrombus size |
Thrombus lumen ratio |
| r |
P-value |
r |
P-value |
| Length of plaque disruption |
0.80 |
<0.0001 |
0.77 |
<0.0001 |
| Intima-media ratio |
0.24 |
0.13 |
0.49 |
<0.01 |
| Stenosis |
0.15 |
0.37 |
0.43 |
<0.01 |
| Lipid core-intima ratio |
0.23 |
0.16 |
0.31 |
<0.05 |
| SMA-positive area |
−0.17 |
0.29 |
−0.21 |
0.20 |
| CD68-positive area |
0.23 |
0.16 |
0.22 |
0.17 |
| TF-positive area |
0.38 |
<0.05 |
0.46 |
<0.01 |
| Glut-1-positive cells |
0.16 |
0.33 |
0.21 |
0.19 |
| HK-II-positive cells |
0.40 |
<0.05 |
0.43 |
<0.01 |
HK-II, hexokinase-II; SMA, smooth muscle actin; TF, tissue factor.
TF and HK-II Expression
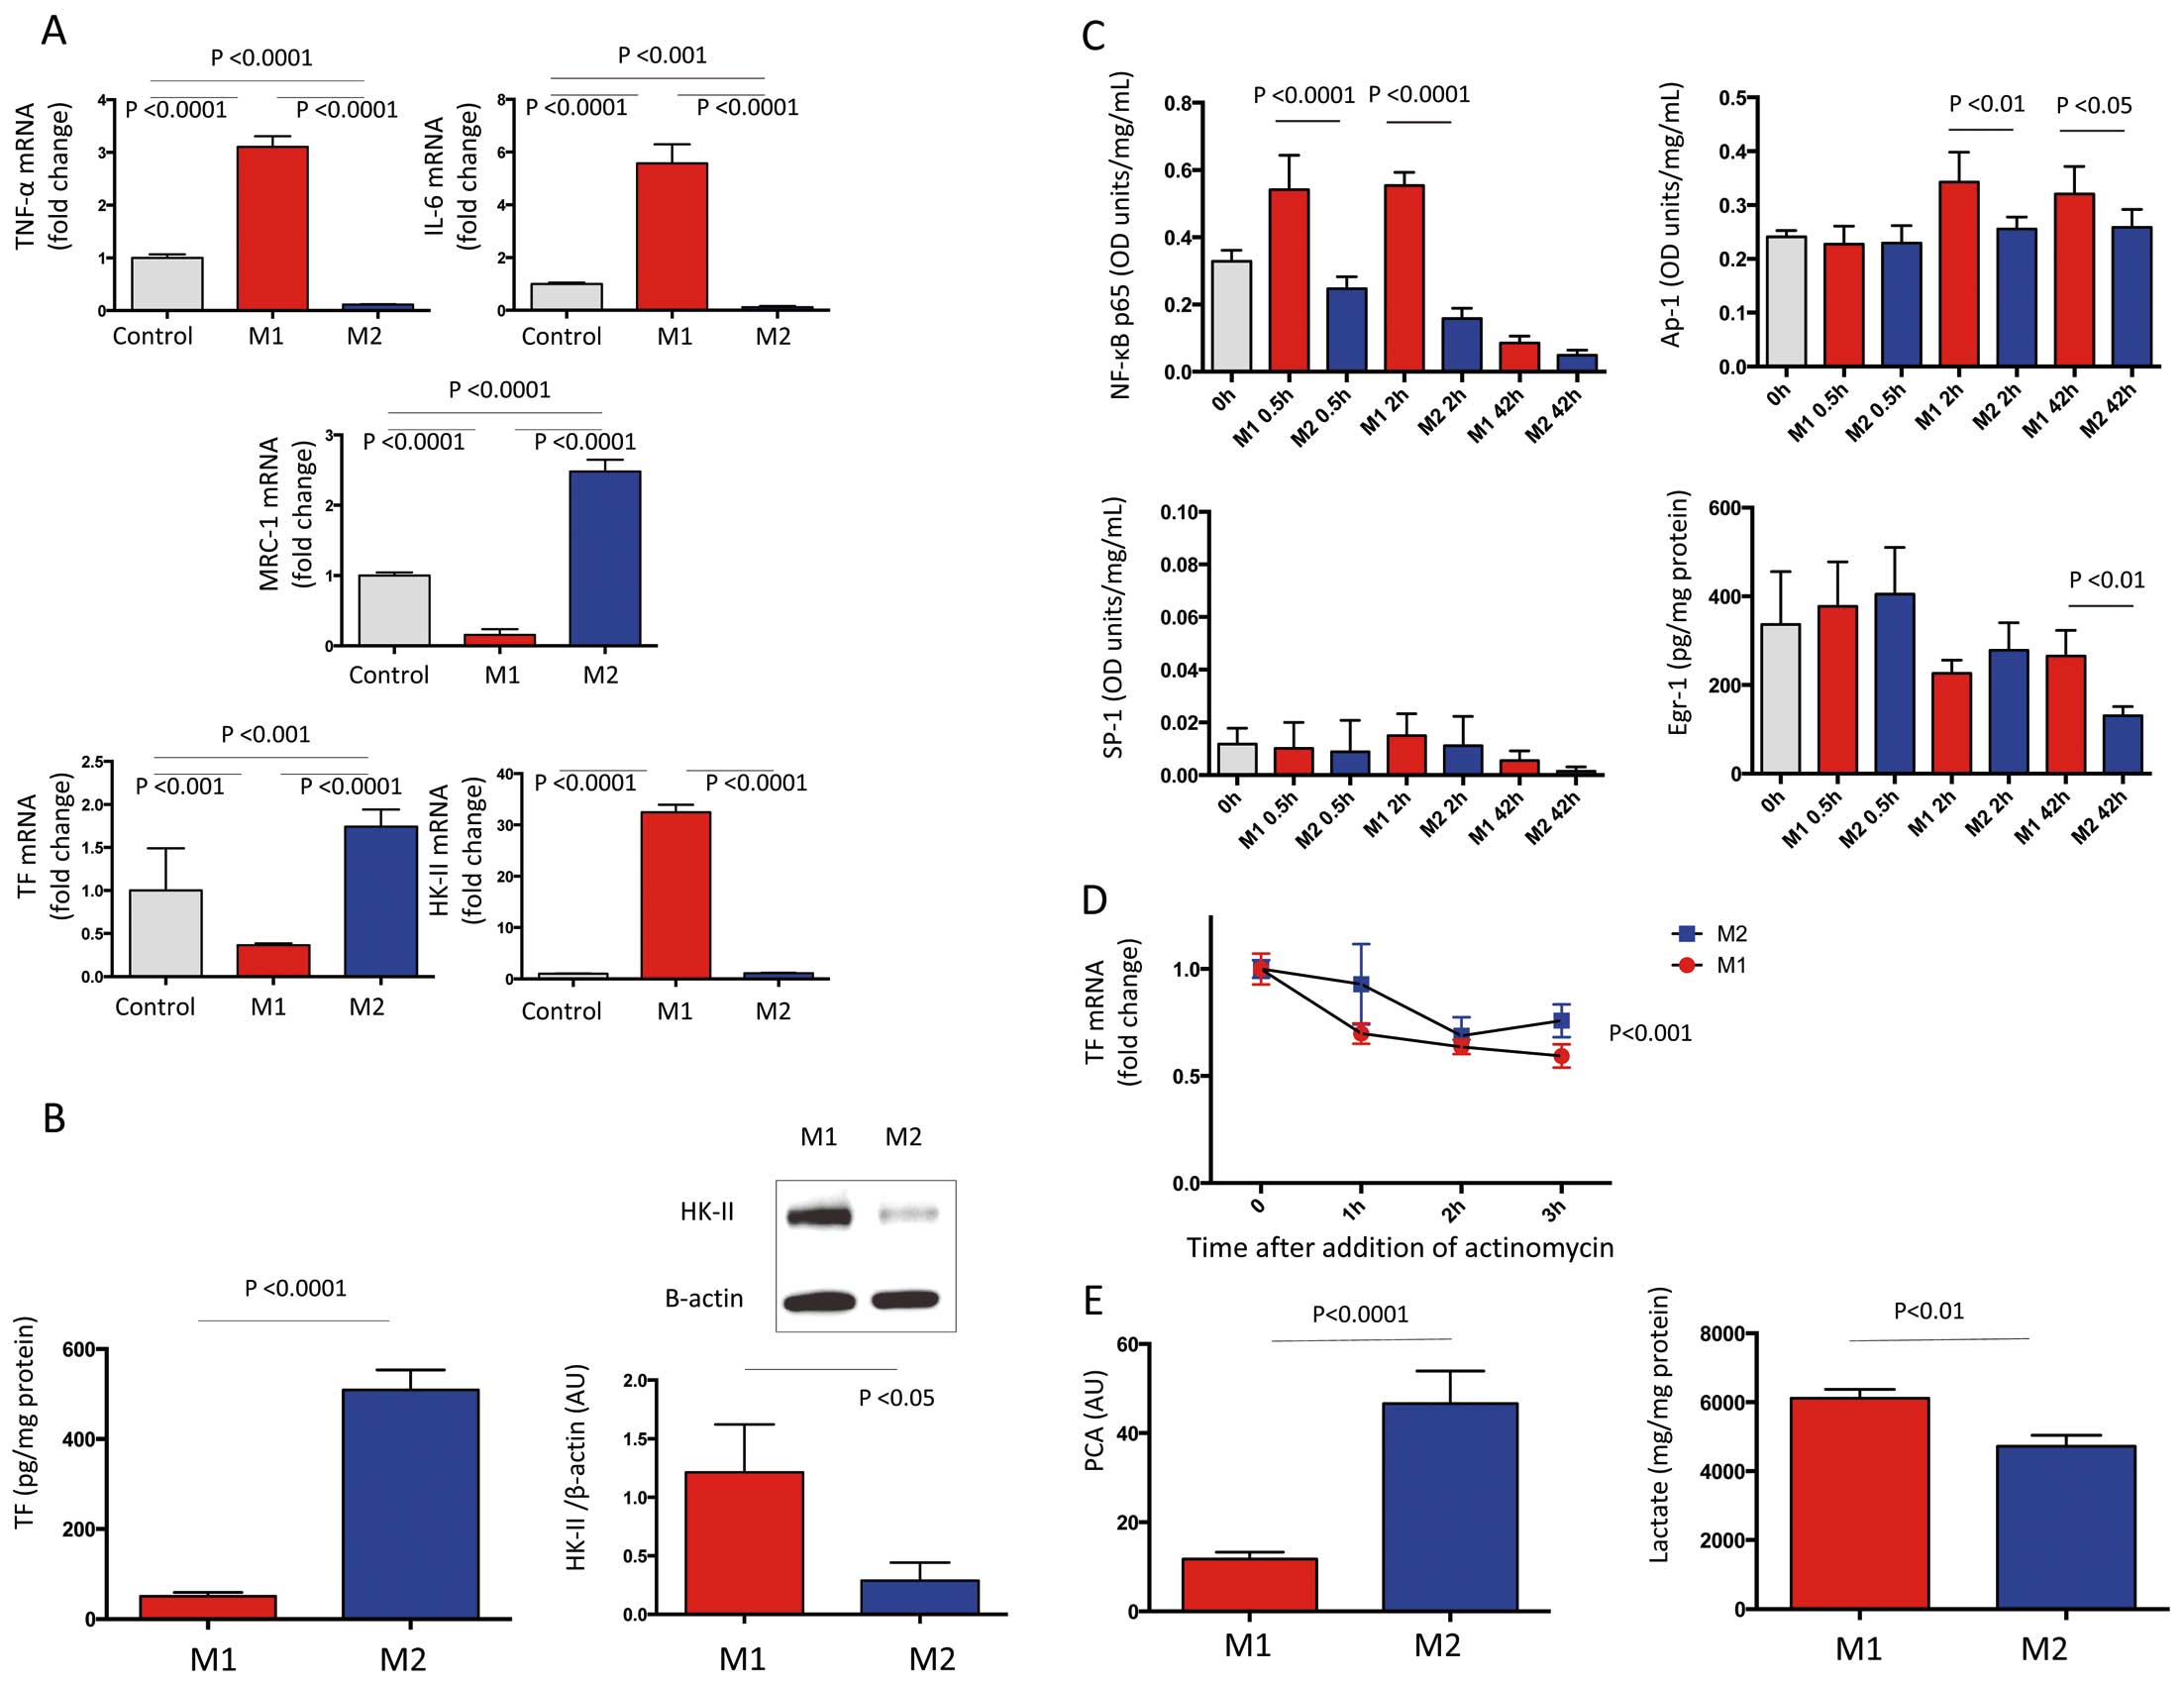
Because both M1 and M2 macrophages expressed TF and HK-II in symptomatic plaque, we compared TF and HK-II expression in THP-1-derived macrophages that were polarized to the M1 phenotype using TNF-α and INF-γ, or to the M2 phenotype using IL-4 and IL-13. Polarization of THP-1 derived macrophages to the M1 and M2 type was confirmed by the mRNA expression of TNF-α, IL-6, and MRC-1 (Figure 4A).
More TF mRNA and protein was expressed in M2-, than in M1-polarized macrophages, whereas M1-polarized macrophages expressed more HK-II mRNA and protein (Figures 4A,B).
The oligonucleotide binding activity of NF-κB p65, AP-1 and SP-1 in nuclear protein, and protein level of Egr-1 in nuclear protein, were quantified to determine level of TF expression in polarized macrophages. Neither the binding activities of NF-κB p65, AP-1, SP-1 nor the protein level of Egr-1 increased in M2-polarized macrophages at 30 min, or at 2 and 42 h after polarization. The binding activity of NF-κB p65 increased at 30 min and at 2 h after M1 polarization, whereas that of AP-1 and of Egr-1 increased at 2 and 42 h respectively, after M1 polarization (Figure 4C).
The TF mRNA stability in M1- and M2-polarized macrophages was assessed using actinomycin D, a transcriptional inhibitor. The TF mRNA stability was enhanced in M2- compared with M1-polarized macrophages (Figure 4D).
Procoagulant Activity and Lactate Production
Rabbit plasma clotting time initiated by cell suspensions and lactate level in supernatants was measured to determine procoagulant activity and glycolysis flux in polarized macrophages. Procoagulant activity was significantly enhanced in M2 macrophages (Figure 4E) and M1 macrophages produced more lactate (Figure 4E).
Effects of Glycolysis Inhibition on TF Expression and Procoagulant Activity
Macrophages were cultured for 42 h with or without the glycolysis inhibitor 2DG to assess the relationship between glycolysis and TF expression in polarized macrophages. The glycolysis inhibitor reduced lactate production approximately 30% in both M1 and M2 macrophages. The inhibition of glycolysis enhanced the expression of TF mRNA and protein in M1 macrophage, TF mRNA in M2 macrophage and procoagulant activity in both M1- and M2-polarized macrophages (Figure 5A).

Enhancement of HIF-1α Expression and Nuclear Translocation by Glycolysis Inhibition
Because 2DG is a pseudo-hypoxic state-inducing agent, we examined the effect of 2DG on HIF-1α mRNA and protein expression and TF mRNA stability in M1- and M2-polarized macrophages. The inhibition of glycolysis enhanced the expression of HIF-1α mRNA and nuclear protein level in M1- and M2-polarized macrophages (Figure 5B), but did not affect TF mRNA stability in both macrophages (Figure 5B). The enhanced TF mRNA expression and procoagulant activity by glycolysis inhibition was significantly suppressed by a HIF-1α inhibition in both M1- and M2-polarized macrophages (Figure 5C).
Discussion
The present study found that thrombotic occlusion in human coronary arteries is associated with length of plaque disruption, stenosis, necrotic core size and TF and HK-II expression in atherosclerotic plaque, and that procoagulant activity and lactate production differ in polarized macrophages. In addition, glycolytic flux negatively affected TF expression and procoagulant activity in such macrophages.
Recent findings have indicated that plaque disruption is not the final step, and that occlusive thrombus formation is critical to the onset of clinical events. Therefore, the present study focused on determinants of coronary thrombus size and thrombotic occlusion. As previously reported, TF was localized in the rim of necrotic cores13
and expressed in the superficial portion of disrupted plaque. The development of thrombus aspiration has enabled the evaluation of coronary artery thrombi at the onset of AMI.14
Nishihira et al examined aspirated coronary thrombi obtained from 264 patients within 24 h of AMI onset on pathology, and identified plaque components in 177 (44%) of them.15
TF co-localizes with fibrin in coronary thrombi.16
Exposing blood to materials containing thrombogenic TF might contribute to coronary thrombosis. Disturbed blood flow induces erosive damage to neointima, and induces thrombus formation in rabbits.17,18
The progression of neointimal damage caused by disturbed blood flow was associated with thrombus growth.17
The present autopsy findings agree with these experimental findings. Therefore, the degree of plaque disruption and subsequent exposure of TF might be the main determinant of coronary thrombotic occlusion.
The morphometric features differed between symptomatic and asymptomatic thrombotic plaques. The findings suggested that at least regional factors influence coronary thrombus size after plaque disruption. Luminal stenosis per se is not considered critical to AMI onset because of compensatory expansive remodeling of thin fibrous cap atheroma19
and severe luminal stenosis in patients with stable angina.20
Coronary occlusions that induce MI evolve most frequently in segments without severe stenosis according to an angiographic study,21
but a more recent study has shown that plaque stenosis and size measured on intravascular ultrasound are related to clinical events.22
The expansive remodeling and differences in mathematical dimension might affect the interpretation. Mauriello et al showed that symptomatic thrombotic carotid plaques have long plaque disruption, severe stenosis, abundant macrophages and a large necrotic core, compared with asymptomatic thrombotic plaques.23
The present results are compatible with these features except for the macrophage content, which in the present study tended to be larger in symptomatic, than in asymptomatic thrombotic plaques. The difference, however, did not reach statistical significance, because only a few asymptomatic thrombotic plaques in the present study had abundant macrophages. Although further studies are required, the difference in macrophage content could be due to anatomical and rheological differences between carotid and coronary arteries.
Both Glut-1 and HK-II were upregulated in symptomatic thrombotic plaque. The expression of Glut-1 and HK-II in the carotid artery was enhanced in advanced atherosclerotic plaques compared with early lesions.24
More FDG accumulated in culprit coronary lesions from patients with AMI than in those with stable angina pectoris.25
We recently showed that arterial 18F-FDG uptake reflects TF expression and vascular thrombogenicity in rabbits.9
These lines of evidence and the present results suggest that arterial glucose metabolism reflects the thrombogenicity of coronary atherosclerotic plaques. Because more cells were immunopositive for HK-II than for Glut-1 and this correlated with coronary thrombus formation, HK-II expression might be a marker of coronary plaque thrombogenicity.
Macrophages comprise a heterogeneous cell population with functional variability in atherosclerotic plaques.26
Although the precise role of polarized macrophages in atherosclerotic lesion remains undefined, M1 and M2 macrophages are generally considered atherogenic and atheroprotective, respectively. The NF-κB pathway is important in M1 macrophages, and the myeloid deletion of IκB kinase results in decreased inflammation and reduced lesion formation in mice deficient in LDL receptor.27
M2 macrophages express abundant IL-10, which protected against atherogenesis by modulating macrophage functions.28
TF expression and procoagulant activity in polarized macrophages, however, remain unknown. We found more TF expression and procoagulant activity in M2, than M1, macrophages. The TF mRNA in THP-1 monocytic cells is regulated at the transcriptional level and its stability in response to lipopolysaccharide (LPS).29
Although the precise mechanisms remain unknown, the present findings suggest increased stability rather than enhanced transcription of TF mRNA in M2 macrophages. Yunoki et al reported that macrophages with an M2 phenotype accumulate in coronary culprit lesions of patients with unstable angina, and that the accumulation of M2 macrophage is associated with microvessel density, intraplaque hemorrhage and erythrocyte-induced oxidative stress.30
Intraplaque hemorrhage can increase intraplaque hypoxia, which promotes arterial thrombus formation via augmentation of TF expression.31
The M2 polarization and increased hypoxia following intraplaque hemorrhage might enhance plaque thrombogenicity.
Evidence of glucose metabolism in cultured macrophages is contradictory. M1 macrophages display a metabolic shift towards the anaerobic glycolytic pathway, while M2 polarization has little effect.32
M1 macrophages enhance glucose uptake and HK-II expression compared with M2 macrophages.12
Glucose uptake and HK-II expression, however, are increased in macrophages stimulated with LPS but not in those with the M1 and M2 phenotypes.11
This discrepancy might be due to different cell sources and cell culture protocols. Both TF and HK-II were detected in M1 and M2 macrophages from symptomatic coronary arteries. Both macrophage phenotypes exert distinct procoagulant activities and produce lactate. The expression of both TF and HK-II might reflect plaque thrombogenicity, but the contribution of procoagulant activity and glucose metabolism in plaque might differ between M1 and M2 macrophages.
The TF expression is notably affected by inhibition of glycolysis. Recent studies have shown that increased glucose uptake contributes to pro-inflammatory responses in macrophages. The heterozygous disruption of inducible 6-phosphofructo-2-kinase, a rate-limiting glycolysis enzyme, enhances TNF-α and IL-6 gene expression in adipose tissue macrophages from mice fed a high-fat diet.33
A kinase screen in RAW264.7 macrophage identified sedoheptulose kinase, an enzyme of the pentose phosphate pathway, as a possible repressor of LPS-induced TNF-α production. Sedoheptulose kinase affects macrophage polarization through the control of glucose metabolism.34
The overexpression of glucose-6-phosphate dehydrogenase, the first and rate-limiting enzyme of the pentose phosphate pathway, stimulates the expression of pro-inflammatory cytokine genes in RAW 264.7 macrophages.35
Therefore, the present findings support the notion that glucose metabolism affects macrophage function. Glycolysis inhibition may induce a pseudohypoxic state, and low glucose concentration enhanced HIF-1α expression in non-neoplastic cells.36
The present results suggest that the enhanced TF mRNA expression and procoagulant activity caused by glycolysis inhibition is partly dependent on HIF-1α-mediated responses in M1- and M2-polarized macrophages.
This study has several limitations. Autopsy samples represent one feature of the dynamic process of thrombus formation and thrombolysis. We measured the length of plaque disruption in a single histological section and thus could not address the 3-D extent. Nevertheless, the close correlation suggested that the extent of plaque injury is a major determinant of coronary thrombus size and the onset of coronary events.
Conclusions
The degree of plaque disruption and expression of TF and HK-II appear to be important vascular factors for AMI onset; and polarized macrophages make a distinct contribution to thrombogenicity and glucose metabolism.
Acknowledgments
We thank Ritsuko Sotomura, Kyoko Ohashi, Fumiya Kawano, Hikari Kiyohara, and Sakiko Shigeta for excellent technical assistance.
Disclosures
This study was supported in part by Grants-in-Aid for Scientific Research in Japan (Nos. 25460440, 23390084) from the Ministry of Education, Science, Sports and Culture of Japan, Mitsui Life Welfare Foundation, Intramural Research Fund (25-4-3) for Cardiovascular Diseases of National Cerebral and Cardiovascular Center, and The Bayer Scholarship for Cardiovascular Research.
Conflicts of Interest
None.
Supplementary Files
Supplementary File 1
Table S1.
Clinical characteristics
Table S2.
Primer sequences used for quantitative PCR
Please find supplementary file(s);
http://dx.doi.org/10.1253/circj.CJ-15-0394
References
- 1.
Mackman N. Triggers, targets and treatments for thrombosis. Nature 2008; 451: 914–918.
- 2.
Sato Y, Hatakeyama K, Marutsuka K, Asada Y. Incidence of asymptomatic coronary thrombosis and plaque disruption: Comparison of non-cardiac and cardiac deaths among autopsy cases. Thromb Res 2009; 124: 19–23.
- 3.
Okada K, Ueda Y, Matsuo K, Nishio M, Hirata A, Kashiwase K, et al. Frequency and healing of nonculprit coronary artery plaque disruptions in patients with acute myocardial infarction. Am J Cardiol 2011; 107: 1426–1429.
- 4.
Burke AP, Kolodgie FD, Farb A, Weber DK, Malcom GT, Smialek J, et al. Healed plaque ruptures and sudden coronary death: Evidence that subclinical rupture has a role in plaque progression. Circulation 2001; 103: 934–940.
- 5.
Drake TA, Morrissey JH, Edgington TS. Selective cellular expression of tissue factor in human tissues: Implications for disorders of hemostasis and thrombosis. Am J Pathol 1989; 134: 1087–1097.
- 6.
Owens AP 3rd, Mackman N. Tissue factor and thrombosis: The clot starts here. Thromb Haemost 2010; 104: 432–439.
- 7.
Ogawa M, Ishino S, Mukai T, Asano D, Teramoto N, Watabe H, et al. (18)F-FDG accumulation in atherosclerotic plaques: Immunohistochemical and PET imaging study. J Nucl Med 2004; 45: 1245–1250.
- 8.
Tawakol A, Migrino RQ, Bashian GG, Bedri S, Vermylen D, Cury RC, et al. In vivo 18F-fluorodeoxyglucose positron emission tomography imaging provides a noninvasive measure of carotid plaque inflammation in patients. J Am Coll Cardiol 2006; 48: 1818–1824.
- 9.
Yamashita A, Zhao Y, Zhao S, Matsuura Y, Sugita C, Iwakiri T, et al. Arterial 18F-fluorodeoxyglucose uptake reflects balloon catheter-induced thrombus formation and tissue factor expression via nuclear factor-κB in rabbit atherosclerotic lesions. Circ J 2013; 77: 2626–2635.
- 10.
Yamashita A, Nishihira K, Matsuura Y, Ito T, Kawahara K, Hatakeyama K, et al. Paucity of CD34-positive cells and increased expression of high-mobility group box 1 in coronary thrombus with type 2 diabetes mellitus. Atherosclerosis 2012; 224: 511–514.
- 11.
Tavakoli S, Zamora D, Ullevig S, Asmis R. Bioenergetic profiles diverge during macrophage polarization: Implications for the interpretation of 18F-FDG PET imaging of atherosclerosis. J Nucl Med 2013; 54: 1661–1667.
- 12.
Satomi T, Ogawa M, Mori I, Ishino S, Kubo K, Magata Y, et al. Comparison of contrast agents for atherosclerosis imaging using cultured macrophages: FDG versus ultrasmall superparamagnetic iron oxide. J Nucl Med 2013; 54: 999–1004.
- 13.
Hatakeyama K, Asada Y, Marutsuka K, Sato Y, Kamikubo Y, Sumiyoshi A. Localization and activity of tissue factor in human aortic atherosclerotic lesions. Atherosclerosis 1997; 133: 213–219.
- 14.
Yunoki K, Naruko T, Sugioka K, Inaba M, Itoh A, Haze K, et al. Thrombus aspiration therapy and coronary thrombus components in patients with acute ST-elevation myocardial infarction. J Atheroscler Thromb 2013; 20: 524–537.
- 15.
Nishihira K, Hatakeyama K, Shibata Y, Kitamura K, Asada Y. Organized thrombus in aspirated coronary materials can predict in-hospital mortality of patients with acute myocardial infarction. Circ J 2013; 77: 1275–1280.
- 16.
Yamashita A, Sumi T, Goto S, Hoshiba Y, Nishihira K, Kawamoto R, et al. Detection of von Willebrand factor and tissue factor in platelets-fibrin rich coronary thrombi in acute myocardial infarction. Am J Cardiol 2006; 97: 26–28.
- 17.
Sumi T, Yamashita A, Matsuda S, Goto S, Nishihira K, Furukoji E, et al. Disturbed blood flow induces erosive injury to smooth muscle cell-rich neointima and promotes thrombus formation in rabbit femoral arteries. J Thromb Haemost 2010; 8: 1394–1402.
- 18.
Sameshima N, Yamashita A, Sato S, Matsuda S, Matsuura Y, Asada Y. The values of wall shear stress, turbulence kinetic energy and blood pressure gradient are associated with atherosclerotic plaque erosion in rabbits. J Atheroscler Thromb 2014; 21: 831–838.
- 19.
Varnava AM, Mills PG, Davies MJ. Relationship between coronary artery remodeling and plaque vulnerability. Circulation 2002; 105: 939–943.
- 20.
Smits PC, Pasterkamp G, Quarles van Ufford MA, Stella PR, de Jaegere PP, Borst C. Coronary artery disease: Arterial remodelling and clinical presentation. Heart 1999; 82: 461–464.
- 21.
Hackett D, Davies G, Maseri A. Pre-existing coronary stenoses in patients with first myocardial infarction are not necessarily severe. Eur Heart J 1988; 9: 1317–1323.
- 22.
Stone GW, Maehara A, Lansky AJ, de Bruyne B, Cristea E, Mintz GS, et al. A prospective natural-history study of coronary atherosclerosis. N Engl J Med 2011; 364: 226–235.
- 23.
Mauriello A, Servadei F, Sangiorgi G, Anemona L, Giacobbi E, Liotti D, et al. Asymptomatic carotid plaque rupture with unexpected thrombosis over a non-canonical vulnerable lesion. Atherosclerosis 2011; 218: 356–362.
- 24.
Sluimer JC, Gasc JM, van Wanroij JL, Kisters N, Groeneweg M, Sollewijn Gelpke MD, et al. Hypoxia, hypoxia-inducible transcription factor, and macrophages in human atherosclerotic plaques are correlated with intraplaque angiogenesis. J Am Coll Cardiol 2008; 51: 1258–1265.
- 25.
Rogers IS, Nasir K, Figueroa AL, Cury RC, Hoffmann U, Vermylen DA, et al. Feasibility of FDG imaging of the coronary arteries: Comparison between acute coronary syndrome and stable angina. JACC Cardiovasc Imaging 2010; 3: 388–397.
- 26.
De Paoli F, Staels B, Chinetti-Gbaguidi G. Macrophage phenotypes and their modulation in atherosclerosis. Circ J 2014; 78: 1775–1781.
- 27.
Park SH, Sui Y, Gizard F, Xu J, Rios-Pilier J, Helsley RN, et al. Myeloid-specific IκB kinase β deficiency decreases atherosclerosis in low-density lipoprotein receptor-deficient mice. Arterioscler Thromb Vasc Biol 2012; 32: 2869–2876.
- 28.
Han X, Boisvert WA. Interleukin-10 protects against atherosclerosis by modulating multiple atherogenic macrophage function. Thromb Haemost 2015; 113: 505–512.
- 29.
Brand K, Fowler BJ, Edgington TS, Mackman N. Tissue factor mRNA in THP-1 monocytic cells is regulated at both transcriptional and posttranscriptional levels in response to lipopolysaccharide. Mol Cell Biol 1991; 11: 4732–4738.
- 30.
Yunoki K, Naruko T, Komatsu R, Ehara S, Shirai N, Sugioka K, et al. Enhanced expression of haemoglobin scavenger receptor in accumulated macrophages of culprit lesions in acute coronary syndromes. Eur Heart J 2009; 30: 1844–1852.
- 31.
Matsuura Y, Yamashita A, Iwakiri T, Sugita C, Okuyama N, Kitamura K, et al. Vascular wall hypoxia promotes arterial thrombus formation via augmentation of vascular thrombogenicity. Thromb Haemost 2015; 114: 158–172.
- 32.
Rodríguez-Prados JC, Través PG, Cuenca J, Rico D, Aragonés J, Martín-Sanz P, et al. Substrate fate in activated macrophages: A comparison between innate, classic, and alternative activation. J Immunol 2010; 185: 605–614.
- 33.
Huo Y, Guo X, Li H, Wang H, Zhang W, Wang Y, et al. Disruption of inducible 6-phosphofructo-2-kinase ameliorates diet-induced adiposity but exacerbates systemic insulin resistance and adipose tissue inflammatory response. J Biol Chem 2010; 285: 3713–3721.
- 34.
Haschemi A, Kosma P, Gille L, Evans CR, Burant CF, Starkl P, et al. The sedoheptulose kinase CARKL directs macrophage polarization through control of glucose metabolism. Cell Metab 2012; 15: 813–826.
- 35.
Ham M, Lee JW, Choi AH, Jang H, Choi G, Park J, et al. Macrophage glucose-6-phosphate dehydrogenase stimulates proinflammatory responses with oxidative stress. Mol Cell Biol 2013; 33: 2425–2435.
- 36.
Dehne N, Hintereder G, Brüne B. High glucose concentrations attenuate hypoxia-inducible factor-1alpha expression and signaling in non-tumor cells. Exp Cell Res 2010; 316: 1179–1189.