Abstract
Background:
The characteristics and prognostic value of the variability of premature ventricular contraction (PVC) coupling intervals (CIs) for cardiac mortality are not yet decisive.
Methods and Results:
In 133 consecutive patients (58±14 years old, 53 women) who had left ventricular dysfunction (LVD: ejection fraction <50%) and frequent PVCs (≥10/h) who underwent 24-h ambulatory electrocardiography (AECG) recording and 123I-metaiodobenzylguanidine myocardial single-photon emission computed tomography simultaneously, the heart rate turbulence onset, slope, and T-wave alternans were analyzed from the 24-h AECG. The CI of the PVCs (MEANNV), standard deviation of the CI of the PVCs (SDNV) as an index of the variability of the PVC CI, and their ratio to the preceding N-N intervals (SDNV/SDNN) were calculated from constructed Poincaré plots using the annotated 24-h AECG QRS data. The primary endpoint was cardiac mortality. The mean follow-up period was 63 months. Among 133 patients, 114 survived (group 1) and 19 (14%, group 2) died during the follow-up. The MEANNV
and SDNV
were higher in group 2 (539±104 vs. 599±114 ms, P=0.021; 64±34 vs. 83±37 ms, P=0.022, respectively). The SDNV, PVC count, and delayed heart/mediastinum ratio remained as significant predictors of cardiac mortality in the binary logistic regression analysis.
Conclusions:
These results suggest that the SDNV
could be another adjunctive parameter for predicting cardiac mortality in LVD. (Circ J 2015; 79: 2360–2366)
Both the prevalence and incidence of heart failure (HF) and left ventricular dysfunction (LVD) have been steeply increasing over the past few decades.1
Despite recent advances in the diagnostic and therapeutic strategies for the management of HF, the mortality rate, including sudden cardiac death (SCD), in HF has become higher and remains as the most significantly challenging problem given its complex nature.2
The use of implantable cardioverter defibrillators (ICDs) is recognized as the mainstay of the primary prevention of SCD. The selection of high-risk patients who are vulnerable to cardiac death or SCD for primary preventive ICD therapy relies heavily on the left ventricular ejection fraction (LVEF), however, the suitability of the LVEF as a single stratifier of the arrhythmic risk in patients with HF is refutable. Therefore, much remains to be determined on how best to identify the high-risk patients who would most benefit from ICD implantations. So far, numerous noninvasive markers have been introduced for this purpose.3
Premature ventricular contractions (PVCs), as one among them, occur in 70–95% of patients with HF, in whom they are frequent and complex.4,5
Although the effect of PVCs and runs of nonsustained ventricular tachycardia (NSVT) varies with the nature and extent of the underlying disease, their presence in subjects with HF contributes to an increased mortality risk.6
Only a frequency cutoff of 10 PVCs per hour and the occurrence of NSVT as thresholds for an increased risk have been cited in most studies,7,8
and have been incorporated into the mortality risk scoring system.7
However, little attention has been paid to the clinical significance of the coupling interval (CI) variability of PVCs as a risk stratifier. A few studies have reported the clinical meaning of the PVC CI in relation to runs of ventricular arrhythmias,9–12
the drug response,13
and risk identification in coronary artery disease.14
Editorial p 2317
In the present study, we investigated the usefulness of the variability of the PVC CI as a predictor of cardiac mortality in patients with LVD by comparing it with conventional risk stratifiers such as the LVEF, heart rate turbulence (HRT), T-wave alternans (TWA), and parameters from 123I-metaiodobenzylguanidine (MIBG) myocardial single-photon emission computed tomography (SPECT).
Methods
Study Population
A total of 149 consecutive patients who had stable, mild to moderate HF (NYHA functional class II or III) because of idiopathic dilated or ischemic cardiomyopathy, and who had no prior arrhythmic cardiac events, were enrolled. All enrolled subjects underwent baseline examinations, which included ECG, transthoracic echocardiography, 24-h ambulatory ECG (AECG) monitoring, coronary angiography, and 123I-MIBG myocardial SPECT. All the tests were undertaken simultaneously after stabilization of the patients. Among them, 11 patients were excluded because they had atrial fibrillation (n=5), uninterpretable noise on the AECG recordings (n=3), or other miscellaneous causes (n=3). Patients who had or needed device therapy such as a pacemaker (n=2) or cardiac resynchronization therapy (n=3) were also excluded from the study. The prescribed medications were maintained during all the tests. Written informed consent was given by all patients prior to entry into the study. The study protocol was approved by the Institutional Review Board of the Yeungnam University Medical Center.
Ambulatory ECG Recordings and Analysis
A 24-h AECG was recorded using a 3-channel digital recorder (SEER MC ambulatory ECG recorder, GE Marquette, Milwaukee, WI, USA). All ambulatory ECGs were analyzed and edited manually with a Holter analyzer (Mars 7.1, GE Marquette). The total number of PVCs, number of PVCs with different morphologies and the presence of NSVT (≥3 consecutive PVCs at a rate of more than 100 beats/min) were assessed in each recording. The parameters of the HRT and TWA were computed using built-in software in the Holter analyzer (GE Healthcare’s TWA modified moving average [MMA] algorithm and HRT analysis program). For the HRT analysis, the turbulence onset (To: magnitude of sinus rhythm acceleration after a PVC), and turbulence slope (Ts: intensity of subsequent sinus rhythm deceleration) were calculated.15
The TWA was measured by a MMA method using weighing factors of 1/8.16
Computation of the PVC CI and Its Variability
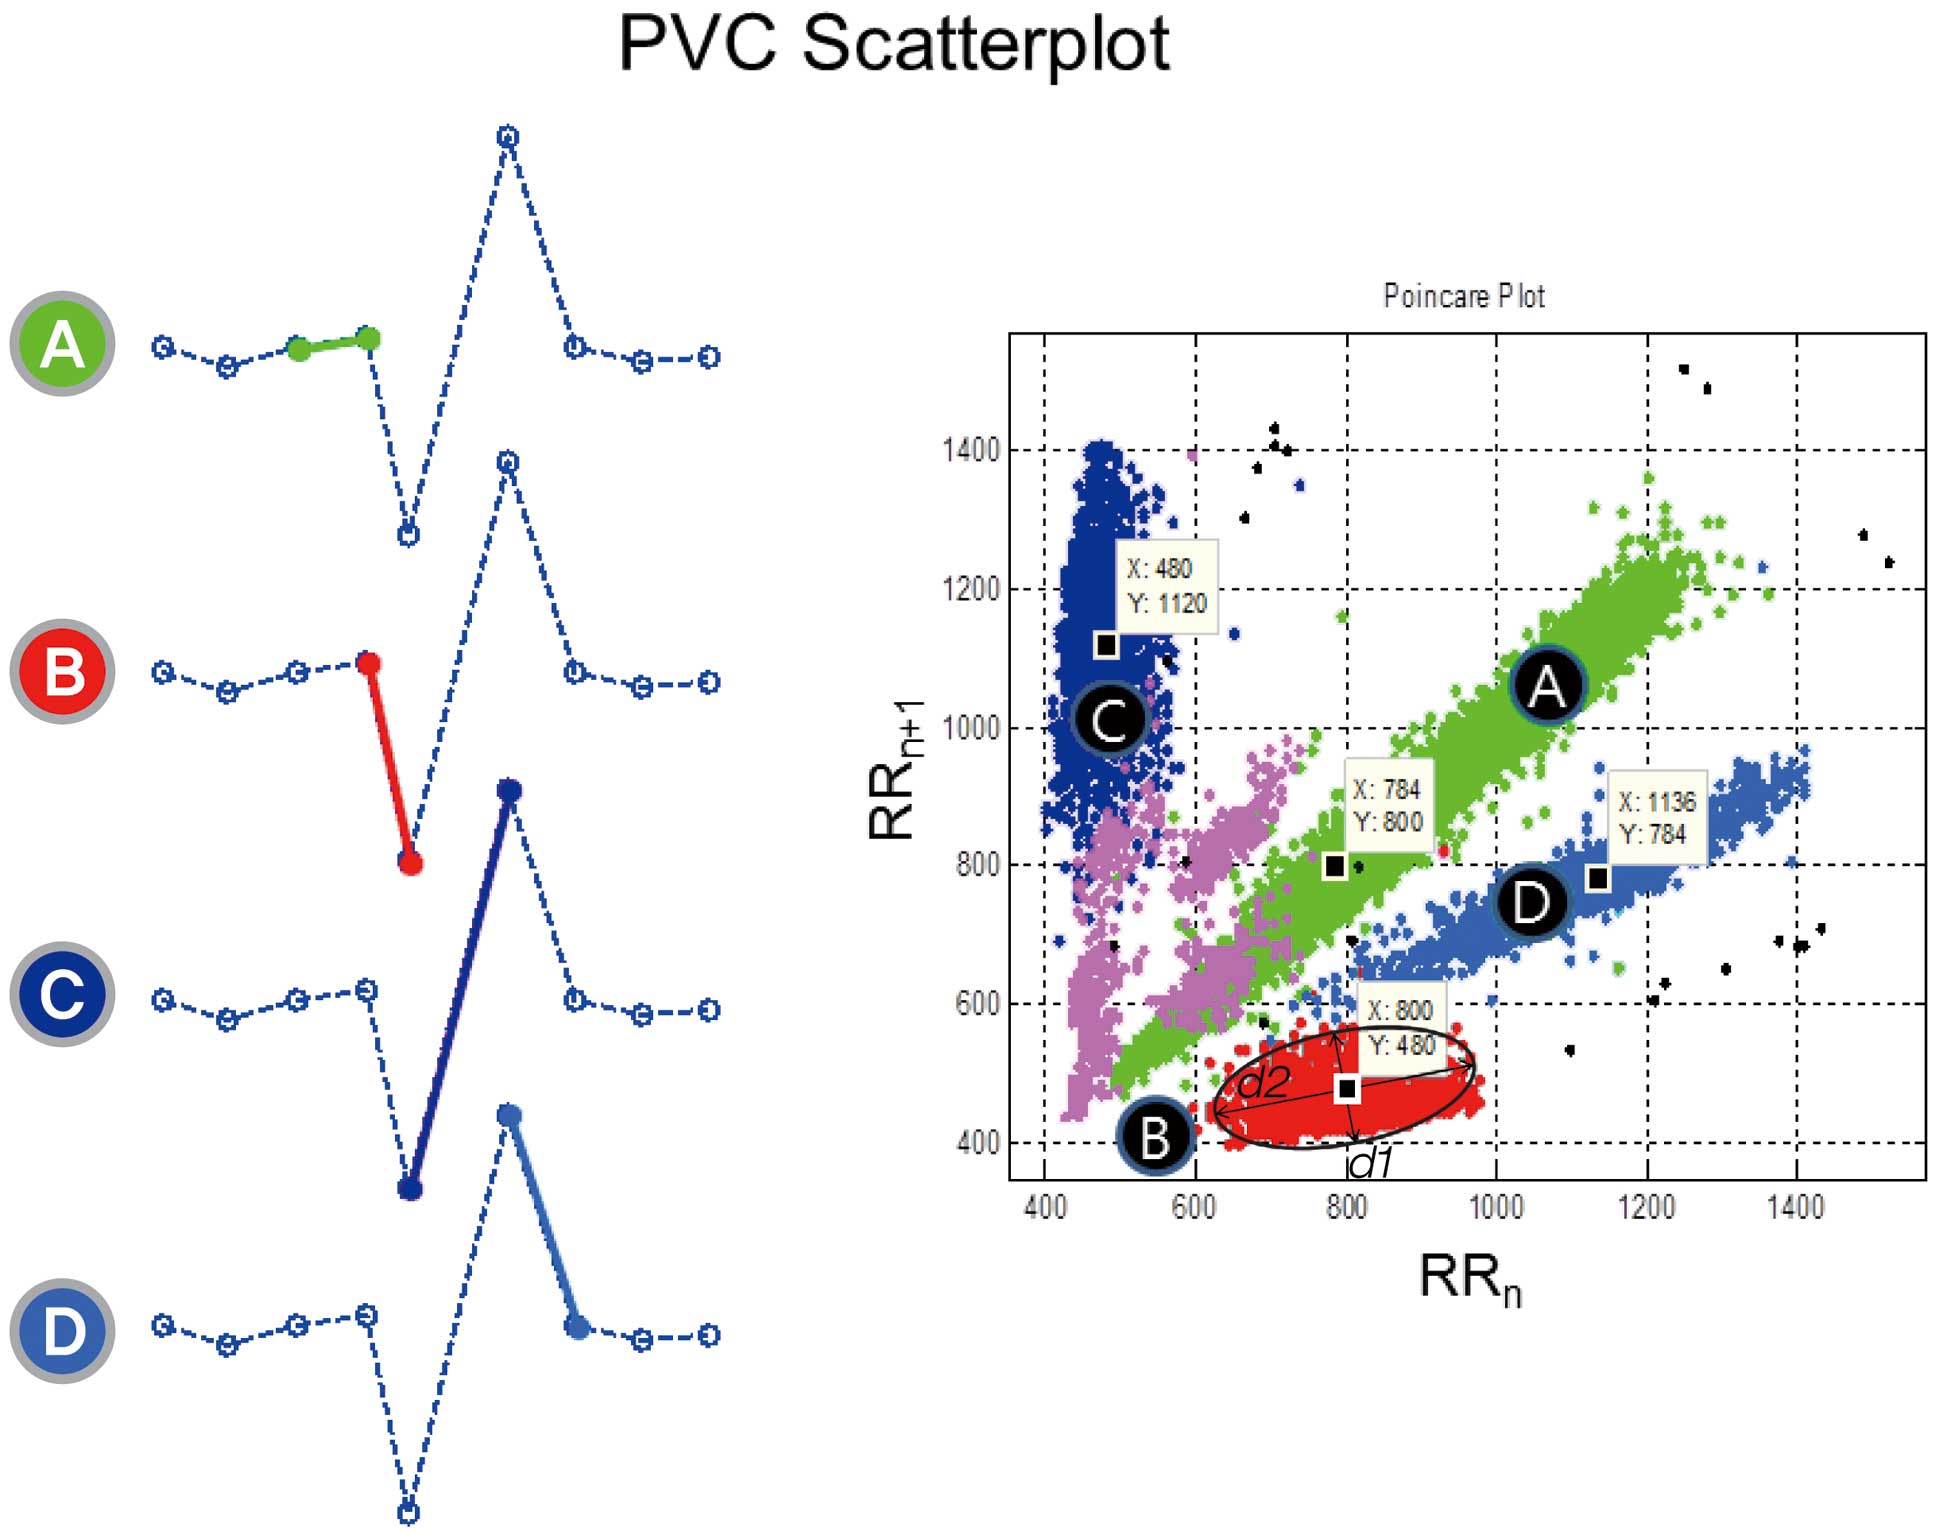
For each recording, an R-R interval scatterplot was constructed from the annotated QRS data from the 24-h AECG. This so-called Poincaré plot is one of the commonly used nonlinear methods in which a graphical representation of the correlation between successive normal R-R intervals (ie, plot of the RRn+1) as a function of the RRn
is obtainable.17
Normal R-R intervals (N-N interval, sinus cycle) are plotted along the line-of-identity (RRn=RRn+1) in an ellipsoid pattern. However, the CIs of the PVCs (N-V interval) as a function of the preceding N-N intervals of normal sinus beats are depicted as shown in
Figure 1. The following parameters were computed from this plot: the mean of all N-N intervals (MEANNN, ms), standard deviation of all N-N intervals (SDNN, ms), mean N-V intervals (MEANNV, ms), standard deviation of all N-V intervals (SDNV, ms), and ratio of the SDNV
to the SDNN
(SDNV/SDNN). We defined the SDNV
as the variability of the CI of the PVCs. To describe the geometry of the PVC cluster, we calculated the ratio (d1/d2) of the short axis (d1) and long axis (d2) derived from the clustered PVCs (Figure 1).
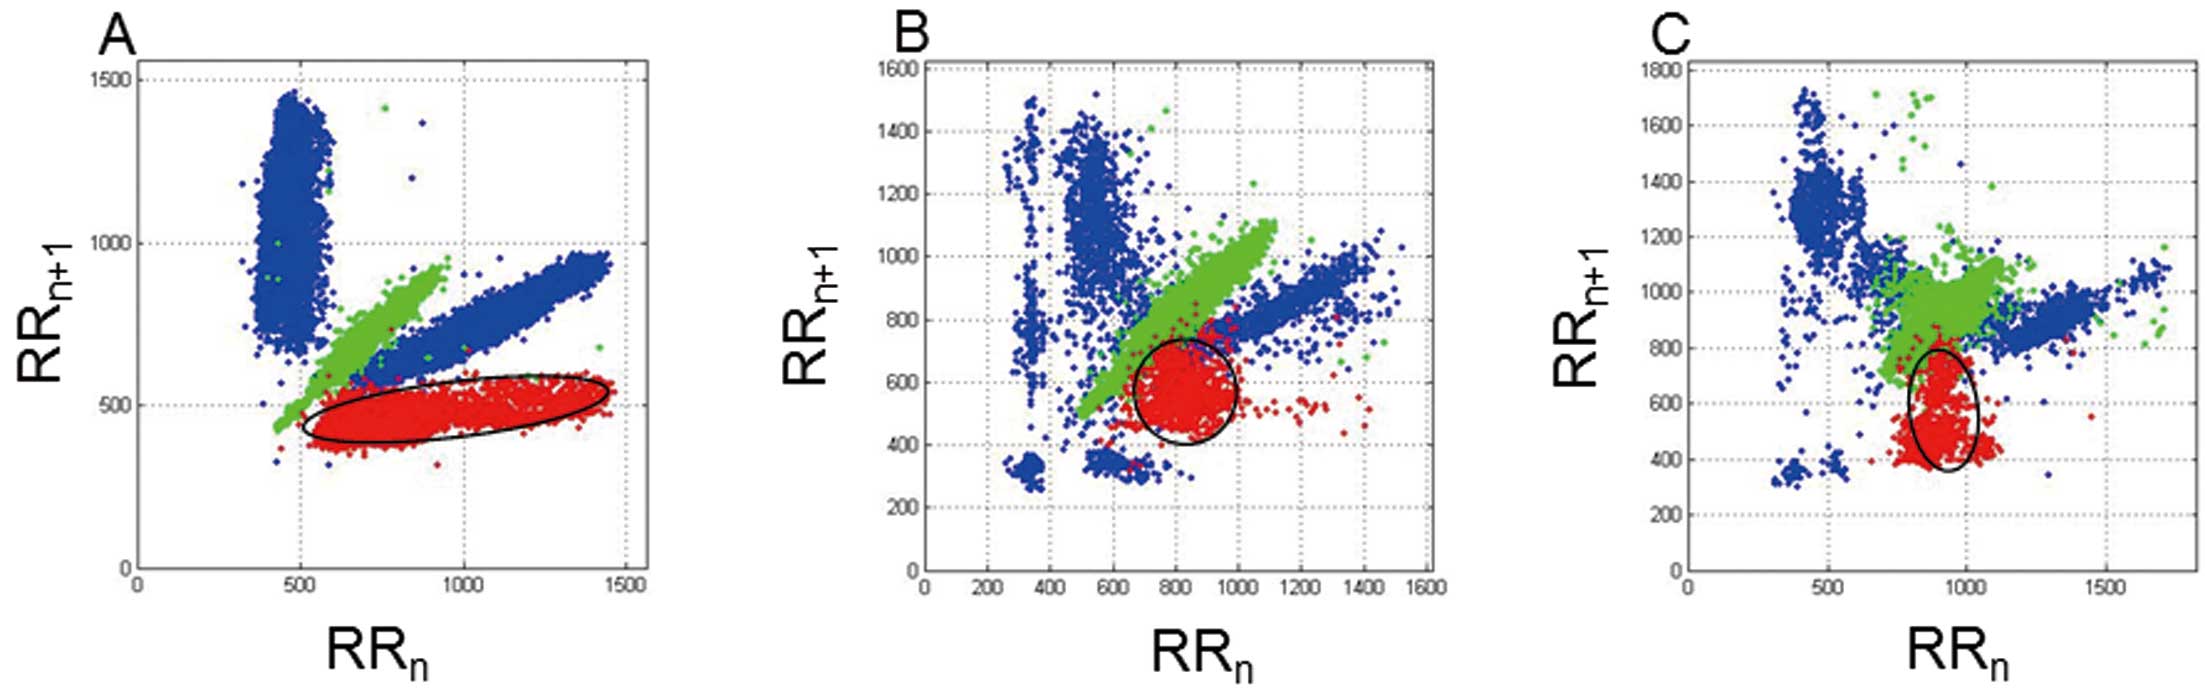
Figure 2
shows representative examples of Poincaré plots in a patient who survived and 2 who died. This computation was done by custom-made software using Matlab (R2009b, MathWorks, Natick, MA, USA).
Both planar and SPECT images were obtained 15 min (early images) and 3 h (delayed images) after an intravenous injection of 222 MBq of 123I-MIBG via the cubital vein. A 2-head rotating gamma camera (Millennium VG Hawkeye Gamma camera, GE Healthcare) with a low-energy high-energy collimator was used for imaging. The planar images were collected in a 128×128 matrix for 3 min. The collection time was 25s/frame, and 180-degree data were taken using 60 image steps (3°step; 30 directions×2 heads) for SPECT imaging, and a data-processing workstation (Xeleris 2.0, GE Healthcare) was used to analyze the SPECT data. On the anterior planar images, the number of pixels in the regions of interest and mean counts of the upper mediastinum (M) and heart (H) were calculated for both the early and delayed images. The H/M ratio of the MIBG in the initial and delayed images was calculated. A bull’s eye map was used for the SPECT imaging. Myocardial segments visualized by SPECT imaging (ie, the bull’s eye map) were divided into 4 segments (anterior wall, septum, lateral wall, and posterior wall), and the % washout ratio (WR) in each myocardial segment was calculated using the following formula: %WR of SPECT image=(mean counts for the early image-mean counts for the delayed image)/(mean counts for the early image)×100%.
Endpoints and Classification of Death
Information on the medical events, including the survival status, during the follow-up period of each patient was acquired from reviewing the medical records and/or telephone interviews. Deaths were categorized using an adapted form of the Hinkle classification.18
Clear distinctions between arrhythmic and nonarrhythmic death as a cause of death among the patients who were classified as a cardiac death were not possible based solely on the medical records, because of the retrospective nature of this study. Thus, cardiac death was the primary endpoint of this study. This included 3 patients who were resuscitated from cardiac arrest caused by witnessed ventricular fibrillation. The mean follow-up period was 63±27 months (median, 69 months).
Statistical Analysis
All statistical analyses were performed using SPSS version 20.0 for Windows software (IBM, SPSS Inc, Chicago, IL, USA). Continuous variables (presented as the mean±1 SD) were compared using an unpaired Student’s t-test or Mann-Whitney U test. Categorical variables (presented as frequencies) were compared using chi-square statistics or a Fisher’s exact probability test. Univariate and adjusted relative risks were analyzed using a binary regression. Age and the LVEF were chosen as prior clinical covariates. Other covariates used for an adjustment in the multiple binary regression analysis were chosen on the basis of their association with cardiac mortality in the studied population. A P value <0.05 was considered statistically significant.
Results
Clinical Characteristics
The baseline characteristics of all enrolled subjects are summarized in
Table 1. Among 133 patients, 114 survived and 19 (14%) died during the follow-up period of 63±27 months. The patients were divided into 2 groups according to cardiac mortality (alive, group 1; dead, group 2). The baseline characteristics of the 2 groups are shown in
Table 1. The patients in group 2 were older (56±14 vs. 68±9, P<0.001) and had a lower LVEF (42±17 vs. 33±13%, P=0.037) than those in group 1. Also, the patients in group 2 had a larger left ventricular end-diastolic dimension (LVEDD) (57±10 vs. 63±11 mm, P=0.022) and left ventricular end-systolic dimension (LVESD) (45±13 vs. 52±12 mm, P=0.025) compared with group 1.
Table 1.
Clinical Characteristics of the Study Patients With LV Dysfunction and Frequent PVCs
| |
Group 1
(n=114) |
Group 2
(n=19) |
P value |
| Age, years |
56±14 |
68±9 |
<0.001 |
| Male (%) |
64 (56.1) |
16 (84.2) |
0.016 |
| BMI, kg/m2 |
24.1±3.2 |
22.8±2.8 |
0.066 |
| Diabetes (%) |
17 (14.9) |
1 (5.3) |
0.468 |
| Hypertension (%) |
19 (16.7) |
8 (42.1) |
0.017 |
| Etiology |
|
|
0.021 |
| Idiopathic (%) |
84 (73.7) |
9 (47.4) |
|
| Ischemic (%) |
30 (26.3) |
10 (52.6) |
|
| Laboratory findings |
| Hemoglobin, g/dl |
13.4±1.6 |
12.6±3.1 |
0.507 |
| Creatinine, mg/dl |
1.03±0.38 |
1.03±0.24 |
0.634 |
| FBS, mg/dl |
139±49 |
119±18 |
0.738 |
| T-cholesterol, mg/dl |
191±38 |
188±50 |
0.568 |
| TG, mg/dl |
154±99 |
117±74 |
0.076 |
| HDL-C, mg/dl |
52±16 |
53±19 |
0.990 |
| LDL-C, mg/dl |
116±33 |
120±41 |
0.945 |
| Echocardiographic finding |
| LVEDD, mm |
57±10 |
63±11 |
0.022 |
| LVESD, mm |
45±13 |
52±12 |
0.025 |
| LVEF, % |
42±17 |
33±13 |
0.037 |
| Medication |
| β-blocker (%) |
49 (43.0) |
10 (52.6) |
0.464 |
| Digoxin (%) |
24 (21.1) |
8 (42.1) |
0.078 |
| Calcium-channel blocker (%) |
14 (12.3) |
0 (0) |
0.219 |
| ACEI or ARB (%) |
67 (58.8) |
18 (94.7) |
0.003 |
ACEI, angiotensin-converting enzyme inhibitor; ARB, angiotensin receptor blocker; BMI, body mass index; FBS, fasting blood sugar; HDL-C, high-density lipoprotein cholesterol; LDL-C, low-density lipoprotein cholesterol; LV, left ventricular; LVEDD, LV end-diastolic dimension; LVESD, LV end-systolic dimension; LVEF, LV ejection fraction; PVC, premature ventricular contraction; TG, triglyceride.
The differences in the parameters derived from the 24-h AECG and 123I-MIBG SPECT according to cardiac mortality are summarized in
Table 2. The total PVC count and number of PVC morphologies did not differ between the 2 groups. The rate of the presence of nonsustained VT was significantly higher in group 2 than in group 1 (75.0% vs. 44.2%; P=0.022). The max TWA and mean TWA did not differ between the 2 groups. The value of Ts also did not differ between the 2 groups. However, the patients in group 2 had a positive value (0.37±1.07 %) for To, whereas those in group 1 had a negative value (−0.40±2.02 %). The MEANNV, SDNV, and ratio of the SDNV
to SDNN
were significantly higher in the group 2 patients than in the group 1 patients (599±114 ms vs. 539±104 ms, P=0.021; 83±37 ms vs. 64±34 ms, P=0.022; 0.88±0.32 vs. 0.68±0.46, P=0.005, respectively). The
d1/d2
ratio of group 2 was larger than that of group 1 (0.60±0.17 vs. 0.42±0.19, P<0.001). All parameters derived from 123I-MIBG myocardial SPECT were also associated with cardiac mortality. The early and delayed H/M ratios were significantly lower in group 2 patients (1.81±0.15 vs. 2.04±0.33, P=0.003; 1.72±0.25 vs. 2.08±0.42, P=0.001, respectively). The %WR ratio was also higher in group 2 patients than in group 1 patients (6±9 vs. –1±10, P=0.013).
Table 2.
Comparison of the Parameters Derived From 24-h Ambulatory ECG and
123I-MIBG SPECT in Patients With LV Dysfunction and Frequent PVCs
| |
Group 1
(n=114) |
Group 2
(n=19) |
P value |
| No. of PVC morphologies |
1.51±0.67 |
1.68±0.67 |
0.123 |
| PVC counts/day |
9,237±13,159 |
10,166±15,765 |
0.800 |
| Presence of NSVT (%) |
46 (44.2) |
12 (75.0) |
0.022 |
| Max TWA, ms |
85.68±15.58 |
75.89±22.68 |
0.186 |
| Mean TWA, ms |
75.97±16.22 |
68.11±22.64 |
0.191 |
| To, % |
−0.40±2.02 |
0.37±1.07 |
0.023 |
| To ≥0%, n (%) |
36 (36.0) |
10 (66.7) |
0.024 |
| Ts, ms/RR |
4.92±5.22 |
3.41±3.99 |
0.089 |
| Ts ≤2.5 ms/RR, n (%) |
38 (38.4) |
8 (53.5) |
0.271 |
| MEANNN, ms |
820±116 |
910±208 |
0.046 |
| SDNN, ms |
64±34 |
83±37 |
0.215 |
| MEANNV, ms |
539±104 |
599±114 |
0.021 |
| SDNV, ms |
64±34 |
83±37 |
0.022 |
| SDNV ≥80 ms, n (%) |
31 (27.2) |
9 (47.4) |
0.076 |
| SDNV/SDNN
|
0.68±0.46 |
0.88±0.32 |
0.005 |
| d1/d2 |
0.42±0.19 |
0.60±0.17 |
<0.001 |
| Early H/M ratio |
2.04±0.33 |
1.81±0.15 |
0.003 |
| Delayed H/M ratio |
2.08±0.42 |
1.72±0.25 |
0.001 |
| %WR |
−1±10 |
6±9 |
0.013 |
123I-MIBG, 123I-metaiodobenzylguanidine; d1/d2, ratio of short axis (d1) and long axis (d2); H/M, heart/mediastinum; MEANNN, mean value of the normal N-N interval; MEANNV, mean coupling interval (CI) of the PVC and preceding normal N; NSVT, nonsustained ventricular tachycardia; SDNN, standard deviation (SD) of the normal N-N interval; SDNV, SD of the CI of the PVCs; SPECT, single-photon emission computed tomography; To, turbulence onset; Ts, turbulence slope; TWA, T-wave alternans; %WR, percent washout ratio. Other abbreviations as in Table 1.
We analyzed the associations between the variability of the CI (SDNV) and various parameters through a multiple linear regression analysis (Table 3). The determinants of the SDNV
were the number of PVC morphologies, PVC count and MEANNV. The number of PVC morphologies (ß±SE 11.452±5.762, P=0.051) and MEANNV
(ß±SE 0.187±0.038, P<0.001) were positively correlated with the SDNV. The echocardiographic parameters, such as LVEDD, LVESD, and LVEF, did not correlate with the SDNV.
Table 3.
Determinants of the SD
NV by a Multiple Linear Regression Analysis
| Variable |
β±SE |
P value |
| Age, years |
−0.426±0.283 |
0.136 |
| LVEDD |
0.309±0.462 |
0.506 |
| LVEF |
−0.213±0.286 |
0.459 |
| No. of PVC morphologies |
11.452±5.762 |
0.051 |
| PVC counts (/1,000 PVCs) |
−0.618±0.262 |
0.021 |
| Max TWA |
0.079±0.121 |
0.520 |
| To |
−1.367±1.897 |
0.474 |
| Ts |
−0.060±0.223 |
0.790 |
| MEANNN |
0.005±0.028 |
0.872 |
| SDNN |
0.051±0.099 |
0.606 |
| MEANNV |
0.187±0.038 |
<0.001 |
| Delayed HM ratio |
11.213±11.157 |
0.318 |
| Washout ratio |
71.153±40.451 |
0.083 |
SE, standard error. Other abbreviations as in Tables 1,2.
A binary logistic regression analysis was used to find the parameters that could predict cardiac mortality. Age, LVEF, presence of NSVT, PVC count, MEANNV, SDNV, Max TWA, and delayed H/M ratio were used as clinical covariates for an adjustment in this analysis. SDNV, PVCs count, and delayed H/M remained as parameters associated with cardiac mortality (Table 4). In particular, the variability of the CI of PVCs (SDNV) was a statistically significant predictor of cardiac mortality (adjusted odds ratio [OR] 1.021, 95% confidence interval [95% CI] 1.003–1.041, P=0.024). The best cutoff point of the SDNV
was 57.05 ms. At that point, the sensitivity and specificity were 0.789 and 0.518, respectively. The area under the curve (AUC) was 0.665 (SE=0.059, 95% CI 0.548–0.781, P=0.022). The positive predictive value (PPV) and negative predictive value (NPV) were 0.215 and 0.936, respectively, at a PVC CI cutoff value of 57.05 ms (Table 5).
Table 4.
Predictors of Cardiac Mortality From a Binary Logistic Regression Analysis
| Variable |
Univariate |
Multivariate |
| OR |
95% CI |
P value |
OR |
95% CI |
P value* |
| SDNV |
1.014 |
1.001–1.026 |
0.037 |
1.021 |
1.003–1.041 |
0.024 |
| PVC count (/1,000 PVCs) |
1.005 |
0.968–1.042 |
0.790 |
1.090 |
1.029–1.151 |
0.004 |
| Delayed H/M ratio |
0.073 |
0.014–0.375 |
0.002 |
0.013 |
0.001–0.165 |
0.001 |
*Adjusted for age, sex, LVEF, Presence of NSVT, PVC count, MEANNV, SDNV, max TWA, and delayed H/M ratio. The Forward Likelihood Ratio was used. 95% CI, 95% confidence interval; OR, odds ratio. Other abbreviations as in Tables 1,2.
Table 5.
Cutoff Points of the SD of the CI of the PVCs
| SDNV, ms |
Sensitivity |
Specificity |
PPV |
NPV |
| 57.05 |
0.789 |
0.518 |
0.215 |
0.936 |
| 80.00 |
0.443 |
0.728 |
0.203 |
0.567 |
PPV, positive predictive value; NPV, negative predictive value. Other abbreviations as in Tables 1,2.
Discussion
Main Findings
Our study demonstrated that the variability of the PVC CI (SDNV) has the potential to predict cardiac mortality in patients with LVD, and it exhibited some feasibility as an adjunctive tool for risk stratification. In our study, after evaluating the variability of the PVC CI as a new cardiac risk predictor in patients with LVD, which encompasses well-known risk predictors including LVEF, TWA, and HRT, the SDNV
remained as an independent risk predictor together with the PVC count and delayed H/M ratio of the 123I-MIBG. The sensitivity and specificity of the SDNV
were 0.789 and 0.518, respectively at a cutoff value of 57.05 ms. The AUC was 0.665. The PPV and NPV were 21.5% and 93.6%, respectively. The predictive capacity of the SDNV
was comparable to that achieved with known noninvasive risk predictors.
Previous observational studies demonstrated that the presence of ≥10 PVCs per hour, beyond which does not convey a further increase in risk, and NSVT were risk factors for subsequent mortality.8,19
Further, most studies cited a frequency cutoff of 10 PVCs per hour and the occurrence of NSVT as the thresholds for increased risk. However, the power of the risk prediction conferred by the PVC frequency in patients with depressed LV function yielded contradictory results and is now questioned.8,19–21
The existing methods, which rely largely on counting the frequencies of PVCs, do not address the fine details.22
In some populations, the presence of NSVT has been effectively used to select high-risk patients for the application of therapy to prevent sudden arrhythmic death. This may also have limited sensitivity.21
At the present time, a new parameter that can describe the characteristics of PVC clustering is needed.
Until now, there have been few studies on the clinical implications or the role of the variability of the PVC CI as a risk predictor.14,23
In a previous study that investigated the predictive value of the variability of the CI of PVCs for the cardiac mortality in patients with coronary artery disease, the presence of a higher variability of the PVC CI (SDNV
>80 ms) predicted a higher cardiac mortality at a relative risk of 6.7, and all the more so in the presence of a depressed LVEF and NSVT.14
However, contradictory to the findings of Sosnowski et al,14
and our study, Lerma et al reported that a low CI variability (standard deviation of the CI, ≤80 ms) was a potentially useful risk marker for all-cause death and cardiac death in 227 acute myocardial infarction patients with a reduced LVEF.23
Although a delayed H/M ratio was not a determinant of the SDNV
(ß±SE 11.213±11.157, P=0.318) in our study, the delayed H/M ratio of the 123I-MIBG was also a significant predictor of cardiac mortality (OR 0.013, P=0.001), which is compatible with the findings of the previous studies. It is known that a diminished delayed H/M ratio, suggesting cardiac sympathetic denervation or dysfunction, can be important because it acts as a functional arrhythmogenic substrate.
When looking at the previous studies of the variability of the PVC CIs, researchers reported that a variable CI >80 ms, multiformity, or both were significantly associated with the occurrence of repetitive forms,10
and the variability of the CI was an important sign of inhomogeneous conduction and may precede the onset of severe ventricular arrhythmias.12
Further, it has also been reported that the incidence of ventricular runs tends to be higher in patients with a variable CI than in those with a fixed CI, and the variation in the PVC CI is related to the occurrence of ventricular tachycardia and/or ventricular fibrillation.13
However, those reports did not provide direct evidence that increased variation in the CI is related to a worse clinical outcome and also they did not propose any clinically useful index.
It has been considered that the CIs of PVCs of the same origin are constant. Langendorf et al reported that the CIs of ectopic beats vary by less than 0.08 s.24
Consequently, most studies have used an 80 ms CI variation of the PVCs as the threshold value of a fixed CI,10,14,23,25
and 2 recent studies, which reported the clinical value of CI variations in the PVCs as a risk predictor, used a predefined cutoff value of 80 ms.14,23
However, we suggested 57 ms as the cutoff value rather than 80 ms for predicting cardiac mortality in our study. This value is close to that of Komatsu et al, who defined fixed as when the CIs remained constant at various preceding R-R intervals of the normal sinus beats, and the standard deviation of the CIs as less than 50 ms.13
The variation in the CI is thought to be one of the characteristics of ventricular parasystoles. However, studies have reported that the CIs vary in the absence of parasystoles.9,26
Suggested mechanisms for PVCs are reentry, triggered activity, and enhanced automaticity. A variation in the reentry circuit or alteration in the conduction within the reentrant circuit,25
a Wenckebach type of block,24
and the presence of another ectopic focus might be mechanisms of the variation in the CIs at reentry. With triggered activity, variations in the preceding cycle length,26
the electrolyte concentration, degree of ischemia, and changes in the autonomic tone might be a mechanism. Regarding PVCs caused by increased automaticity, intermittent parasystoles might be a cause of the variation in the CI. Although our study did not directly investigate the electrophysiological mechanisms of the variation in the CIs, we speculate that multiple factors contribute to this variation of the CIs because different mechanisms of PVCs may be involved in the same patient with LVD.27
In our study, we found that the SDNV
was related to the number of PVC morphologies, PVC count and mean PVC CI (MEANNV), but not to the LV dimension, LVEF and indices of 123I-MIBG, which is in contrast to the findings of Sosnowski et al.14
They found that the SDNV
correlated with the LV systolic function indices. Whatever the mechanisms of PVCs are, the results of our study indicate that the predictive power of CI variation in the PVCs from the 24-h AECG recordings may surpass and complement the conventional risk stratifiers.
The R-R interval scatterplots, or Poincaré plot, were used to quantify the variation in the PVC CI in our study, which is convenient for examining the rate-dependence of the CIs and are a graphical representation of PVC clustering. In the 2 recent studies by Sosnowski et al14
and Lerma et al,23
commercial software installed in a Holter analysis system and customized software that captures the quantitative features of PVCs in relation to the sinus R-R intervals in the Holter recordings (heartprint),22
respectively, were used for the calculation of the 24-h variability of the PVC CIs.
Study Limitations
The most important of limitation is that the results of our study were derived from a retrospective analysis and non-randomized data. Also, the number of patients was limited, so a reassessment is necessary in a later prospective multicenter, large population study. Because the analysis of the cause of death was based on review of the medical records and interviews, we could not ascertain the presence of any ECG-documented fatal or near-fatal ventricular arrhythmias, which included resuscitated cardiac arrest because of primary arrhythmias. We could not determine whether the cause of cardiac death was arrhythmic or not in a few patients. Those patients with that uncertainty were categorized into the cardiac death group. Thus, we set the primary endpoint of our study as cardiac mortality. In addition, a higher CI variability in patients with multiform PVCs might simply suggest the presence of various or plural reentrant circuits, but not the presence of myocardial instability. For this reason, it was assumed that an evaluation and comparison of the CI variability of PVCs with the same morphology would provide more meaningful results. Finally, because temporal incidences of PVCs or ventricular arrhythmias vary from day to day or on a long-term basis,28
the reproducibility of the analysis of the CI variability of the PVCs (SDNV) was not tested.
Conclusions
An analysis of CI variability of PVCs (SDNV) from the 24-h AECG recordings could be another adjunctive parameter for predicting cardiac mortality in patients with LVD, and could be especially promising in the subgroup of patients with frequent PVCs in whom all standard measures of heart rate variability have limited value.
Acknowledgments
The authors thank John Martin for his linguistic assistance.
References
- 1.
Redfield MM, Jacobsen SJ, Burnett JC Jr, Mahoney DW, Bailey KR, Rodeheffer RJ. Burden of systolic and diastolic ventricular dysfunction in the community: Appreciating the scope of the heart failure epidemic. JAMA 2003; 289: 194–202.
- 2.
Murakoshi N, Aonuma K. Epidemiology of arrhythmias and sudden cardiac death in Asia. Circ J 2013; 77: 2419–2431.
- 3.
Hayashi T, Fukamizu S, Hojo R, Komiyama K, Tanabe Y, Tejima T, et al. Fragmented QRS predicts cardiovascular death of patients with structural heart disease and inducible ventricular tachyarrhythmia. Circ J 2013; 77: 2889–2897.
- 4.
Teerlink JR, Jalaluddin M, Anderson S, Kukin ML, Eichhorn EJ, Francis G, et al. Ambulatory ventricular arrhythmias in patients with heart failure do not specifically predict an increased risk of sudden death: PROMISE (Prospective Randomized Milrinone Survival Evaluation) Investigators. Circulation 2000; 101: 40–46.
- 5.
Podrid PJ, Fogel RI, Fuchs TT. Ventricular arrhythmia in congestive heart failure. Am J Cardiol 1992; 69: 82G–95G.
- 6.
JCS Joint Working Group. Guidelines for clinical cardiac electrophysiologic studies (JCS 2011): Digest version. Circ J 2013; 77: 497–518.
- 7.
Vazquez R, Bayes-Genis A, Cygankiewicz I, Pascual-Figal D, Grigorian-Shamagian L, Pavon R, et al. The MUSIC Risk score: A simple method for predicting mortality in ambulatory patients with chronic heart failure. Eur Heart J 2009; 30: 1088–1096.
- 8.
European Heart Rhythm A, Heart Rhythm S,
Zipes DP, Camm AJ, Borggrefe M, Buxton AE, et al. ACC/AHA/ESC 2006 guidelines for management of patients with ventricular arrhythmias and the prevention of sudden cardiac death: A report of the American College of Cardiology/American Heart Association Task Force and the European Society of Cardiology Committee for Practice Guidelines (Writing Committee to Develop Guidelines for Management of Patients With Ventricular Arrhythmias and the Prevention of Sudden Cardiac Death). J Am Coll Cardiol 2006; 48: e247–e346, doi:10.1016/j.jacc.2006.07.010.
- 9.
Surawicz B, Macdonald MG. Ventricular ectopic beats with fixed and variable coupling: Incidence, clinical significance and factors influencing the coupling interval. Am J Cardiol 1964; 13: 198–208.
- 10.
Lowery M, de Marchena EJ, Castellanos A, Myerburg RJ, Kessler KM. Interrelationship of variable coupling, multiformity and repetitive forms: Implications for classification of ventricular arrhythmias. Am Heart J 1990; 119: 301–307.
- 11.
Thanavaro S, Kleiger RE, Miller JP, Province MA, Friedman E, Oliver GC. Coupling interval and types of ventricular ectopic activity associated with ventricular runs. Am Heart J 1983; 106: 484–491.
- 12.
Talbot S, Dreifus LS. Characteristics of ventricular extrasystoles and their prognostic importance: A reappraisal of their method of classification. Chest 1975; 67: 665–674.
- 13.
Komatsu T, Ikeda K, Tomoike H. Assessment of the variability in coupling intervals of ventricular premature contractions. Jpn Circ J 1993; 57: 781–788.
- 14.
Sosnowski M, Skrzypek-Wanha J, Korzeniowska B, Tendera M. Increased variability of the coupling interval of premature ventricular beats may help to identify high-risk patients with coronary artery disease. Int J Cardiol 2004; 94: 53–59.
- 15.
Bauer A, Malik M, Schmidt G, Barthel P, Bonnemeier H, Cygankiewicz I, et al. Heart rate turbulence: Standards of measurement, physiological interpretation, and clinical use: International Society for Holter and Noninvasive Electrophysiology Consensus. J Am Coll Cardiol 2008; 52: 1353–1365.
- 16.
Nearing BD, Verrier RL. Modified moving average analysis of T-wave alternans to predict ventricular fibrillation with high accuracy. J Appl Physiol (1985) 2002; 92: 541–549.
- 17.
Brennan M, Palaniswami M, Kamen P. Do existing measures of Poincare plot geometry reflect nonlinear features of heart rate variability? IEEE Trans Biomed Eng 2001; 48: 1342–1347.
- 18.
Hinkle LE Jr, Thaler HT. Clinical classification of cardiac deaths. Circulation 1982; 65: 457–464.
- 19.
Goldberger JJ, Cain ME, Hohnloser SH, Kadish AH, Knight BP, Lauer MS, et al. American Heart Association/American College of Cardiology Foundation/Heart Rhythm Society scientific statement on noninvasive risk stratification techniques for identifying patients at risk for sudden cardiac death: A scientific statement from the American Heart Association Council on Clinical Cardiology Committee on Electrocardiography and Arrhythmias and Council on Epidemiology and Prevention. Circulation 2008; 118: 1497–1518.
- 20.
Huikuri HV, Raatikainen MJ, Moerch-Joergensen R, Hartikainen J, Virtanen V, Boland J, et al. Prediction of fatal or near-fatal cardiac arrhythmia events in patients with depressed left ventricular function after an acute myocardial infarction. Eur Heart J 2009; 30: 689–698.
- 21.
Makikallio TH, Barthel P, Schneider R, Bauer A, Tapanainen JM, Tulppo MP, et al. Prediction of sudden cardiac death after acute myocardial infarction: Role of Holter monitoring in the modern treatment era. Eur Heart J 2005; 26: 762–769.
- 22.
Glass L, Lerma C, Shrier A. New methods for the analysis of heartbeat behavior in risk stratification. Front Physiol 2011; 2: 88.
- 23.
Lerma C, Gorelick A, Ghanem RN, Glass L, Huikuri HV. Patterns of ectopy leading to increased risk of fatal or near-fatal cardiac arrhythmia in patients with depressed left ventricular function after an acute myocardial infarction. Europace 2013; 15: 1304–1312.
- 24.
Langendorf R, Pick A, Winternitz M. Mechanisms of intermittent ventricular bigeminy. I: appearance of ectopic beats dependent upon length of the ventricular cycle, the “rule of bigeminy. Circulation 1955; 11: 422–430.
- 25.
Michelson EL, Morganroth J, Spear JF, Kastor JA, Josephson ME. Fixed coupling: Different mechanisms revealed by exercise-induced changes in cycle length. Circulation 1978; 58: 1002–1009.
- 26.
Langendorf R, Pick A. Mechanisms of intermittent ventricular bigeminy. II: Parasystole, and parasystole or re-entry with conduction disturbance. Circulation 1955; 11: 431–439.
- 27.
Pogwizd SM, Hoyt RH, Saffitz JE, Corr PB, Cox JL, Cain ME. Reentrant and focal mechanisms underlying ventricular tachycardia in the human heart. Circulation 1992; 86: 1872–1887.
- 28.
Wood MA, Simpson PM, Stambler BS, Herre JM, Bernstein RC, Ellenbogen KA. Long-term temporal patterns of ventricular tachyarrhythmias. Circulation 1995; 91: 2371–2377.