Abstract
Background:
We sought to identify the feasibility of speckle tracking echocardiography (STE) to predict cardiac resynchronization therapy (CRT) responders in a prospective multicenter study.
Methods and Results:
Patients who were newly implanted with a CRT device were enrolled. Time (T) from QRS to maximum peak radial and circumferential strain (CS) in 6 segments on the left ventricular (LV) short-axis plane, and to the maximum peak of longitudinal strain in 18 segments on 3 apical LV planes was measured (Tmax). In segments with multiple peaks on the time-strain curves, time to the first peak (Tfirst) was also assessed. Difference in T between the earliest and latest segment and standard deviation (SD) of T in each strain component were assessed. CRT responders were defined as having LV end-systolic volume reduction >15% at 6 months after CRT. Clinical outcomes were assessed with a composite endpoint of death from cardiac causes or unplanned hospitalization for heart failure. Among 180 patients, 109 patients were identified as responders. Tfirst-SD of CS >116 ms was selected as the best independent predictor of CRT responders (P<0.001, hazard ratio=9.83, 95% confidence interval 3.78–25.6). In addition, Tfirst-SD of CS was associated with the clinical endpoints.
Conclusions:
This prospective multicenter study revealed the high feasibility of dyssynchrony assessment by STE, which may improve the ability to predict CRT responders. (Circ J 2015; 79: 613–622)
Cardiac resynchronization therapy (CRT) is an important treatment option for patients with drug refractory heart failure, but several large trials have indicated a low clinical response (≈70% of patients).1–3
The primary concept of CRT is improvement of intraventricular dyssynchrony of the left ventricle, and echocardiography seems to be an ideal modality for predicting responders to CRT. However, echocardiographic dyssynchrony parameters determined by M-mode, Doppler, and tissue Doppler imaging (TDI) in prospective multicenter studies have shown disappointing results,4–7
following which, assessments of mechanical dyssynchrony by echocardiography have not been included in the guidelines for CRT.
Speckle tracking echocardiography (STE) has the potential to accurately predict responders to CRT, and some studies have suggested that STE parameters improve prediction of CRT responders.8–11
However, well-performed, prospective, multicenter studies have shown no evidence of improved prediction. Moreover, the directions of strain parameters measured in these studies were variable (longitudinal, circumferential, radial, or transverse), and uncertainty remains as to the best approach to determine dyssynchrony.
The regional time-strain curve is sometimes complex, with multiple peaks, and identification of which peak to choose can be confusing. Further, there is no agreement on which peak is correct, although many researchers have chosen the maximum peak.12
In addition, the very limited interinstitutional reproducibility of dyssynchrony parameters is an important and problematic issue.6
Some investigators have shown time-to-peak analysis by tissue Doppler imaging to be nonreproducible.13
Most multicenter studies of dyssynchrony assessments by STE used a core laboratory and showed acceptable reproducibility of STE analysis in that laboratory. However, reproducibility should be compared among several laboratories to provide objective data. Accordingly, we conducted a prospective multicenter study to assess the feasibility of STE for the prediction of CRT responders while maintaining an objective manner of analysis.
Methods
Study Design
The
Speckle
Tracking Imaging for the
Assessment of Cardiac
Resynchronization
Therapy (START) study was a multicenter prospective cohort study of patients undergoing CRT in Japan. Patients were enrolled from 17 Japanese centers between September 2009 and August 2011, and clinical follow-up was completed in September 2012. The study was approved by the local ethics committee of each participating institution. All patients provided written informed consent.
Study Population
Patients were enrolled based on criteria that included congestive heart failure refractory to optimal medical therapy and QRS duration ≥120 ms, NYHA class II, III or IV and left ventricular (LV) ejection fraction ≤35%. Patients were excluded at the baseline evaluation if they were expected to die within 1 year because of noncardiac disease, if they were scheduled for catheter intervention or cardiac surgery including cardiotomy or coronary bypass, or if they were expected to be lost to follow-up during the first year after CRT. We also excluded patients in chronic atrial fibrillation with irregular rhythm, except for those with regular rhythm because of ventricular pacing or escape rhythm with complete atrioventricular conduction block. Patients were scheduled to undergo echocardiographic studies with NYHA functional class assessment before and at 1 week and 6 months after CRT. Patients were followed up for at least 12 months.
CRT Responses and Clinical Outcomes
Two responses, LV reverse remodeling and clinical outcomes, were assessed. First, a volume responder to CRT was defined as a patient with reverse remodeling as indicated by ≥15% reduction of LV end-systolic volume at 6 months after CRT. Second, clinical outcomes were assessed with the endpoints of composite of death from cardiac causes or unplanned hospitalization for heart failure.
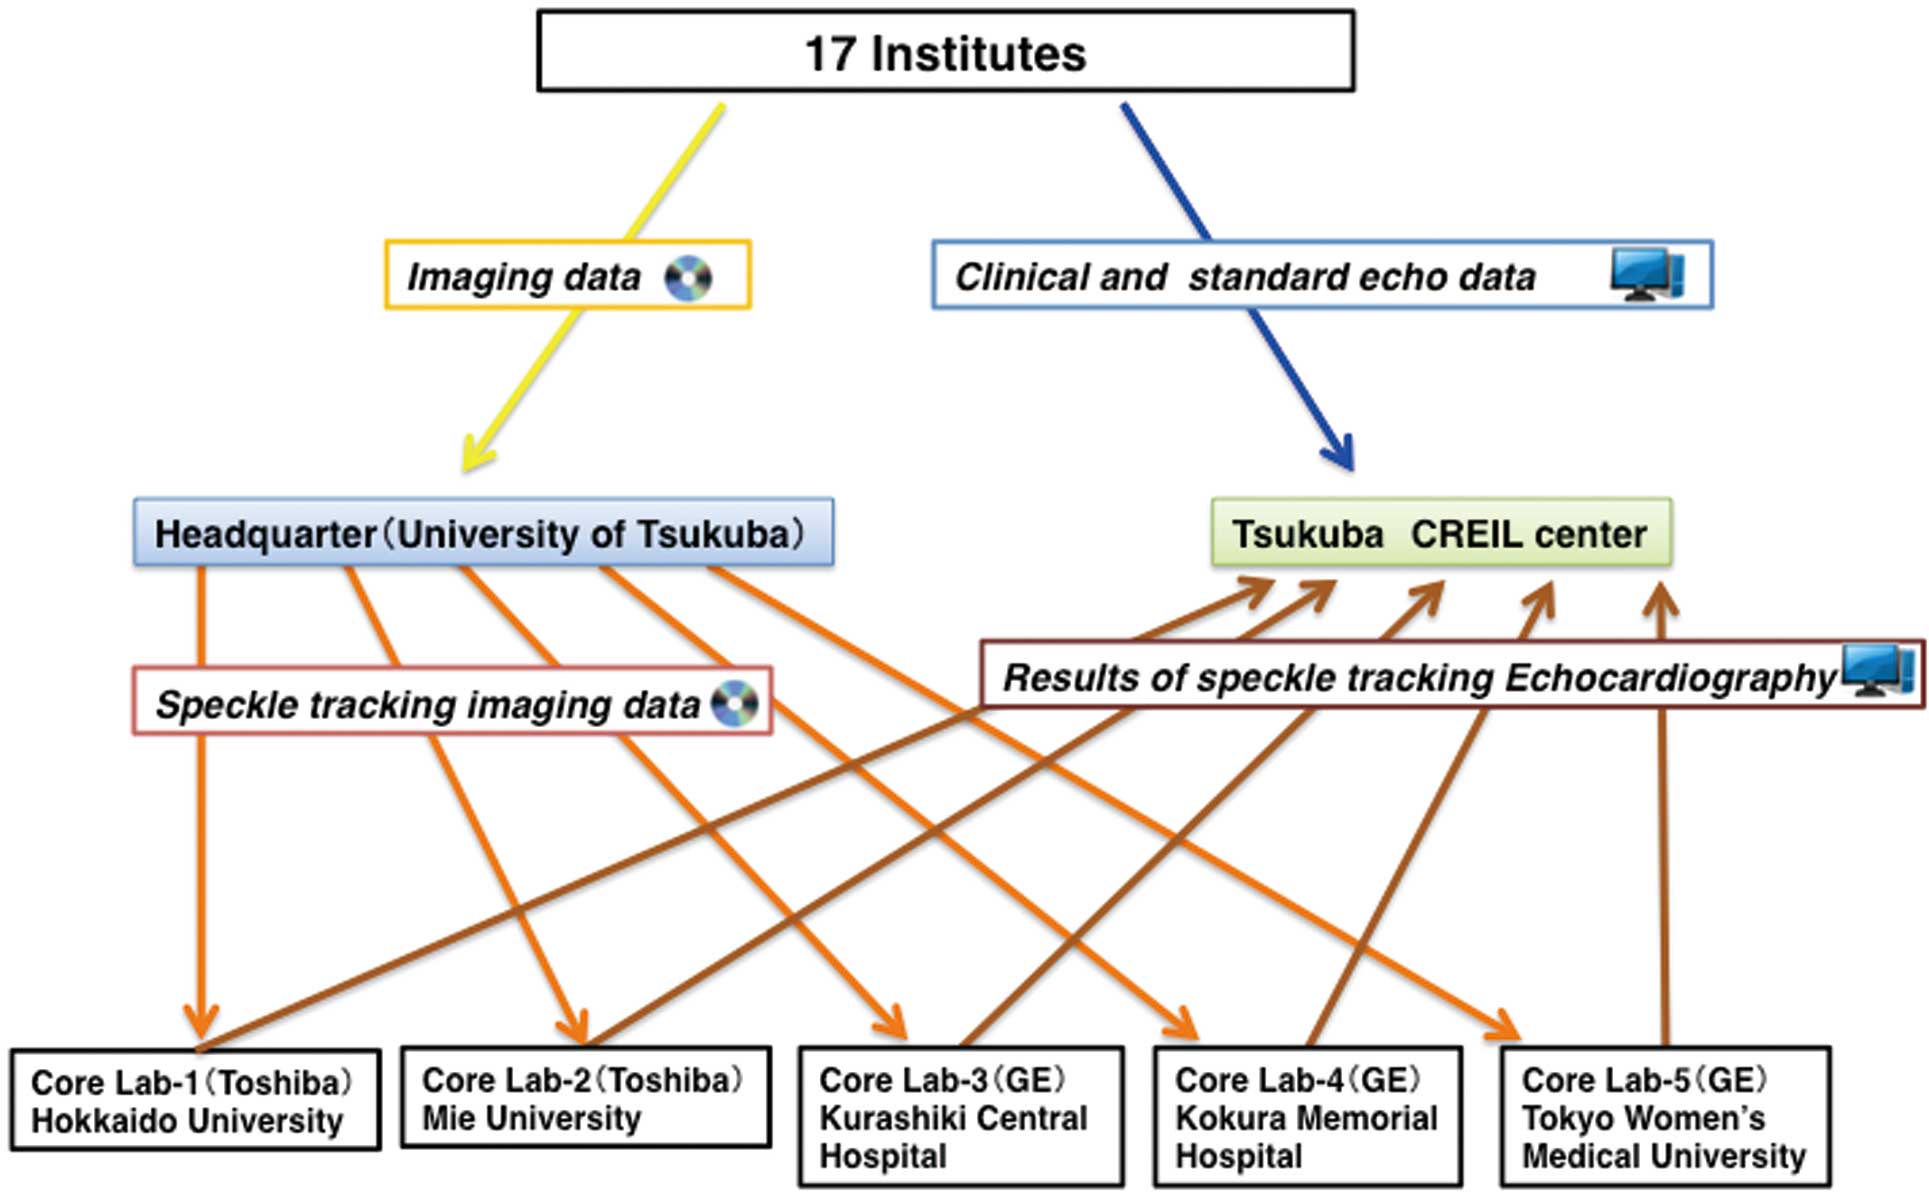
Data Flow
Data flow is summarized in
Figure 1. The Tsukuba Critical Path Research and Education Integrated Leading (CREIL) Center at the University of Tsukuba (http://md.tsukuba.ac.jp) performed data management. Clinical and standard echocardiographic data were obtained according to the study protocol and registered to the database in the CREIL center via the internet from each institution. In this study, echocardiographic systems were limited to 2 vendors: GE Healthcare (Horton, Norway) and Toshiba Medical Systems (Tochigi, Japan). The 5 core laboratories were assigned to analyze STE data only without any knowledge of the clinical data; 3 core laboratories (Tokyo Women’s University, Kokura Memorial Hospital, and Kurashiki Central Hospital) were assigned to analyze data from the GE systems, and the remaining 2 core laboratories (Hokkaido University and Mie University) analyzed the data from the Toshiba systems. STE data flow was as follows: a DVD with STE data sets was sent to the core laboratory specified for each institution by the study headquarters located at the University of Tsukuba. The results of STE analyses were registered to the database in the CREIL center via the internet from each core laboratory.
LV volumes (biplane modified Simpson’s method), dimensions, and wall thickness; Doppler-derived parameters of LV diastolic function; mitral regurgitation severity, defined as the ratio of color Doppler mitral regurgitant jet area to left atrial area (mitral regurgitation index); and pressure gradient derived from tricuspid regurgitant flow were assessed by standard methods. In this study, 4 previously reported dyssynchrony parameters were assessed for their ability to identify CRT responders:14
septal-to-posterior wall motion delay on the M-mode image (SPWMD), standard deviation of time from QRS to peak systolic velocity by tissue Doppler imaging in the ejection phase for 12 LV segments (Ts-SD), delay between time to peak systolic velocity by tissue Doppler imaging in ejection phase at the basal septal and lateral segments (Ts-LS), and interventricular mechanical delay (IMD), defined as the difference between LV pre-ejection period and RV pre-ejection period.
STE Studies
Images for STE studies were obtained in a LV short-axis plane at the papillary muscle level and in the apical 4-chamber, 2-chamber, and long-axis planes. The images were recorded at a minimum of 50 frames per second and were analyzed using workstations with vendor software packages (EchoPac PC v.7.0.1, GE Healthcare; 2D Wall Motion Tracking, Toshiba Medical Systems Co). Tanaka et al have showed that strain dyssynchrony analyses using different software (GE and Toshiba) were similarly able to predict responder to CRT.15
On an end-systolic frame, a region of interest (ROI) was traced on the endocardial cavity interface by a point-and-click approach. The ROI was automatically selected to approximate the myocardium between the endocardium and epicardium. Further adjustment of the ROI was performed to ensure that all regions of the myocardium were included. Next, the software captured the myocardium and automatically tracked its motion and thickening on the subsequent frames. Finally, the myocardium was divided into 6 segments in each plane. Time-radial strain (RS) and time-circumferential strain (CS) curves were obtained from the 6 segments of the LV short-axis plane. Time-longitudinal strain (LS) curves were obtained from a total of 18 segments of the 3 apical planes. The maximum peak in each time-strain curve was defined as the peak strain value during the systolic phase and the first half of the diastolic phase. End-systole was defined as timing of the aortic valve closing in the GE system and as timing of the minimum LV area measured by strain analyses in the Toshiba system. In addition, if multiple peaks were present in the time-strain curve, the first peak was also determined (Figure 2). Any strain curve with a maximum peak value <3% was excluded for STE analyses because the strain peak could not be distinguished from noise data.

Time from QRS onset to maximum strain (Tmax) and to first peak in the multiple strain peaks (Tfirst) were measured in each segment (Figure 2).12
The 3 dyssynchrony parameters in each of Tmax
and Tfirst
were calculated as follows: first, standard deviation of Tmax
(Tmax-SD) and Tfirst
(Tfirst-SD) in the 6 segments for RS and CS and the 18 segments for LS; second, time difference (TD) between the smallest Tmax
and largest Tmax
(Tmax-TD) and between the smallest Tfirst
and largest Tfirst
(Tfirst-TD) among the 6 segments for RS and CS and the 18 segments for LS; and third, TD between the septum and lateral wall (Tmax-TDSL, Tfirst-TDSL) for RS, CS, and LS. In the calculations of dyssynchrony parameters with Tfirst, Tmax
was substituted in the segments with a single peak.
Reproducibility
STE measurements were compared among the core laboratories using data sets from 40 randomly selected patients. We investigated data agreement of the diagnosis of dyssynchrony with Cohen’s κ coefficients.
Statistical Analysis
Data are presented as mean±standard deviation or percentages. Comparisons between groups were performed with unpaired Student’s t-test for continuous variables and χ2
tests for categorical variables. We assessed the performance of each dyssynchrony parameter to predict responders using the area under the curve (AUC) of the receiver-operating characteristic (ROC) curve. Independent determinants of the volume responders were assessed by multivariate logistic regression analysis adjusted for age and sex using univariate factors with a value of P<0.05, which could be assessed in all subjects who were included in the responder study. The risk of clinical endpoints was determined with Cox proportional hazard models. The univariate factors with a value of P<0.05 were entered into the multivariable model adjusted for age and sex to assess the effect of the parameters on the endpoints.
In the univariate logistic regression analysis and the univariate Cox proportional hazard models, the best cutoff value for each factor was identified by ROC analysis. The best cutoff value was defined as the point with the highest sum of sensitivity and specificity.
Kaplan-Meier analysis was done to determine the influence of dyssynchrony parameters on the endpoints. P<0.05 was considered to indicate statistical significance. Analyses were performed with SPSS version 17.0 (SPSS Inc, Chicago, IL, USA).
Results
Baseline Characteristics
Of the initially enrolled 182 patients, 2 (1.1%) were excluded because of CRT discontinuation immediately after implantation (n=1) or incomplete data (n=1). Ultimately, 180 patients formed the final study group (Table 1). The number of patients enrolled from each hospital was as follows: Kurashiki Central Hospital 35, Kokura Memorial Hospital 26, University of Tsukuba 21, Hokkaido University 14, Kobe University 13, Tokyo Woman’s Hospital 11, Shiga University of Medical Science 10, and other institutes 50. Almost all patients were NYHA class II or III, and the majority had nonischemic heart disease. Based on the guidelines, 38 (21.1%) patients with pacing therapy, the majority of whom depended on RV pacing, had an indication for CRT that was upgraded to biventricular pacing. The images from 135 patients were analyzed on workstations with GE software packages and with Toshiba software package for 45 patients.
Table 1.
Baseline Patient Characteristics in the START Study
| Characteristic |
All
(n=180) |
Responder
(n=109) |
Nonresponder
(n=62) |
P value* |
| Age, years |
66.3±12.5 |
66.5±12.0 |
65.5±13.1 |
0.61 |
| Male, n (%) |
120 (66.7) |
69 (63.3) |
44 (71.0) |
0.57 |
| Ischemic, n (%) |
35 (19.4) |
18 (16.5) |
15 (24.2) |
0.23 |
| NYHA class, n (%) |
|
|
|
0.98 |
| II |
63 (35.0) |
40 (36.7) |
22 (35.5) |
|
| III |
109 (60.6) |
64 (58.7) |
37 (59.7) |
|
| IV |
8 (4.4) |
5 (4.6) |
3 (4.8) |
|
| Basic rhythm, n (%) |
|
|
|
0.49 |
| Sinus |
120 (66.6) |
71 (64.2) |
44 (71.0) |
|
| Pacing (DDD,VDD or VVI mode) |
38 (21.1) |
27 (24.8) |
8 (12.9) |
|
| AF |
14 (7.8) |
7 (6.4) |
5 (8.1) |
|
| Other |
8 (4.4) |
4 (4.5) |
5 (8.1) |
|
| PQ interval, ms |
192.2±46.6 (n=155) |
182.8±44.5 (n=92) |
206.2±48.2 (n=55) |
0.003 |
| QRS duration, ms |
158.5±30.2 |
162.7±30.4 |
151.1±28.7 |
0.02 |
| Heart rate, beats/min |
70.1±14.6 |
71.1±14.7 |
68.6±14.1 |
0.28 |
| Systolic blood pressure, mmHg |
106.7±17.9 |
107.4±17.2 |
106.0±19.4 |
0.61 |
| Diastolic blood pressure, mmHg |
61.9±11.4 |
62.1±10.1 |
61.4±13.3 |
0.70 |
| Conduction disorder, n (%) |
|
|
|
<0.001 |
| LBBB |
92 (51.1) |
65 (59.6) |
21 (33.9) |
|
| Nonspecific |
41 (22.8) |
17 (15.6) |
22 (35.5) |
|
| RBBB |
14 (7.8) |
4 (3.7) |
10 (16.1) |
|
| RV pacing |
33 (18.3) |
23 (21.1) |
9 (14.5) |
|
| Primary ventricular tachyarrhythmia, n (%) |
|
|
|
0.34 |
| Nonsustained |
63 (35) |
33 (30.3) |
25 (40.3) |
|
| Sustained |
35 (19.4) |
20 (18.3) |
13 (21.0) |
|
| Ventricular fibrillation |
7 (3.9) |
5 (4.6) |
2 (3.2) |
|
| AF, n (%) |
|
|
|
0.14 |
| Paroxysmal AF |
25 (13.9) |
10 (9.2) |
14 (22.6) |
|
| Chronic AF |
22 (12.2) |
12 (11.1) |
8 (12.9) |
|
| Laboratory data |
| Hb |
12.7±2.2 |
12.8±2.1 |
12.6±2.3 |
0.62 |
| Albumin |
3.8±0.5 |
3.9±0.4 |
3.8±0.5 |
0.55 |
| Total cholesterol |
177.5±42.5 |
175.2±39.9 |
182.1±46.9 |
0.54 |
| HbA1c |
5.8±0.9 |
5.9±0.8 |
5.7±1.1 |
0.47 |
| BUN |
27.9±22.8 |
24.7±14.0 |
33.6±33.4 |
0.01 |
| Cre |
1.5±1.7 |
1.3±1.2 |
1.9±2.4 |
0.02 |
| Na |
138.0±3.7 |
138.3±3.6 |
137.6±3.9 |
0.21 |
| K |
4.3±0.5 |
4.3±0.5 |
4.3±0.5 |
0.43 |
| BNP*, pg/ml |
576.3±647.9 (n=160) |
575.1±721.4 (n=100) |
895.6±1,230.9 (n=50) |
0.03 |
| Medication, n (%) |
| ACEI/ARB |
137 (76.1) |
82 (75.2) |
78 (77.4) |
0.74 |
| β-blocker |
145 (80.6) |
95 (87.2) |
43 (69.4) |
0.005 |
| Loop diuretics |
151 (83.9) |
85 (78.0) |
57 (91.9) |
0.02 |
| Spironolactone |
111 (61.7) |
67 (61.5) |
38 (61.3) |
0.98 |
| Amiodarone |
60 (33.3) |
30 (27.5) |
24 (38.7) |
0.13 |
| Oral inotropes |
20 (11.1) |
11 (10.1) |
5 (8.1) |
0.62 |
| Digitalis |
21 (11.7) |
13 (11.9) |
8 (12.9) |
0.91 |
| Statins |
46 (25.3) |
28 (25.7) |
16 (25.8) |
0.98 |
| Intravenous inotropes |
5 (2.8) |
4 (3.7) |
1 (1.6) |
0.44 |
| hANP |
11 (6.1) |
6 (5.5) |
5 (8.1) |
0.51 |
*Responder vs. nonresponder. ACEI, angiotensin-converting enzyme inhibitors; AF, atrial fibrillation; ARB, angiotensin II receptor blocker; BNP, B-type natriuretic peptide; BUN, blood urea nitrogen; Cre, creatinine; hANP, human atrial natriuretic peptide; Hb, hemoglobin; LBBB, left bundle branch block; NYHA, New York Heart Association; RBBB, right bundle branch block; START, Speckle Tracking Imaging for the Assessment of Cardiac Resynchronization Therapy; VT, ventricular tachycardia.
The mean duration of follow-up was 636±284 (range, 4–1,151) days. By the end of the study, 41 patients had reached the endpoint of composite of death from cardiac cause or unplanned hospitalization for heart failure. A total of 20 patients (11.1%) died: 8 from heart failure, 2 from cardiac death (infective endocarditis and ventricular arrhythmia), 5 from sudden death, and 5 from noncardiac death. Unplanned hospitalization for heart failure occurred in 26 (14.4%) patients.
Volume Responder Study
LV volume measurements at 6 months were completed in 171 (95%) of the 180 patients. The 6-month data of the remaining 9 patients could not be assessed they had died: 4 from heart failure, 3 sudden cardiac deaths, and 2 noncardiac deaths. Of the 180 patients, 109 (60.6%) were identified as volume responders to CRT. Baseline patient characteristics of the responder and nonresponder groups are summarized in
Table 1. In the responder group, QRS duration was longer and the prevalence of left bundle branch block or RV pacing was greater than in the nonresponder group. Patients in the nonresponder group had significantly higher serum creatinine and B-type natriuretic peptide levels than those in the responder group. The prevalence of patients being administered a β-blocker was higher in the responder group, whereas that of patients being administered loop diuretics was lower in the responder group.
Baseline echocardiographic parameters are presented in
Table 2. LV end-diastolic and end-systolic dimensions, mitral regurgitation index, and the pressure gradient of tricuspid regurgitation were significantly higher in the nonresponder group than in the responder group. Of the 4 dyssynchrony parameters, only IMD was significantly higher in the responder group than in the nonresponder group. The AUC to predict volume responders for IMD was 0.61 (P=0.02), with a sensitivity of 0.47, specificity of 0.67, and positive predictive value of 0.72. The cutoff value was 40 ms.
Table 2.
Baseline Echocardiographic Parameters in the START Study
| Parameter |
All (n=180) |
Responder (n=109) |
Nonresponder (n=62) |
P value* |
| LVEDV, ml |
191.7±95.7 |
180.4±69.9 |
203.9±116.8 |
0.10 |
| LVESV, ml |
144.1±85.7 |
135.0±63.4 |
152.4±104.8 |
0.18 |
| LVEF, % |
26.5±7.0 |
26.7±6.9 |
26.7±7.0 |
0.99 |
| LVDd, mm |
63.4±10.0 |
62.5±8.5 |
66.6±10.6 |
0.007 |
| LVDs, mm |
54.6±12.2 |
53.5±9.3 |
57.7±10.9 |
0.01 |
| IVSth, mm |
9.0±2.6 |
9.4±2.6 |
8.7±2.3 |
0.11 |
| PWth, mm |
9.2±2.0 |
9.1±1.8 |
9.3±2.2 |
0.19 |
| E, cm/s |
70.1±34.3 (n=174) |
68.0±35.5 (n=107) |
75.4±32.7 (n=61) |
0.18 |
| A, cm/s |
65.5±26.4 (n=148) |
69.1±26.0 (n=91) |
59.6±25.4 (n=50) |
0.04 |
| E/A |
1.2±1.0 (n=148) |
1.1±1.1 (n=91) |
1.4±1.0 (n=50) |
0.07 |
| DT, ms |
203.6±80.4 (n=170) |
203.2±71.0 (n=101) |
205.0±97.1 (n=59) |
0.89 |
| E/E’ |
16.2±9.7 (n=166) |
16.2±10.9 (n=103) |
16.0±7.3 (n=55) |
0.90 |
| MR index, % |
23.7±18.4 |
21.1±16.7 |
28.1±21.4 |
0.02 |
| TR-PG, mmHg |
29±12 (n=156) |
24.4±11.8 (n=91) |
33.2±15.4 (n=52) |
0.001 |
| SPWMD, ms |
181.6±127.2 (n=178) |
199.7±135.4 (n=109) |
161.3±110.4 (n=61) |
0.06 |
| Ts-SD, ms |
49.0±26.4 (n=176) |
49.8±27.4 (n=107) |
47.0±24.3 (n=58) |
0.50 |
| Ts-SL, ms |
2.8±83.7 (n=176) |
−4.4±84.3 (n=105) |
18.6±82.5 (n=57) |
0.09 |
| IMD, ms |
34.4±43.2 (n=176) |
38.4±34.0 (n=109) |
20.6±44.2 (n=61) |
0.004 |
*Responder vs. nonresponder. A, peak velocity at atrial contraction of Doppler transmitral flow; DT, deceleration time of E; E, early diastolic peak velocity of Doppler transmitral flow; E/A, ratio of E to A; E/E’, ratio of E to E’; E’, early diastolic mitral annular velocity; IMD, interventricular mechanical delay; IVSth, interventricular septal thickness; LVDd, left ventricular (LV) dimension at end diastole; LVDs, LV dimension at end systole; LVEDV, LV end-diastolic volume; LVEF, LV ejection fraction; LVESV, LV end-systolic volume; MR, mitral regurgitation; PWth, posterior wall thickness; SPWMD, septal-to-posterior wall motion delay; TR-PG, pressure gradient of tricuspid regurgitation; Ts-SD, standard deviation (SD) of time from QRS to peak systolic velocity by tissue Doppler imaging in ejection phase for 12 LV segments; Ts-SL, delay between time to peak systolic velocity by tissue Doppler imaging in ejection phase at basal septal and lateral segments. Other abbreviations as in Table 1.
STE dyssynchrony parameters are summarized in
Table 3. All dyssynchrony parameters derived from first peak of time-strain curve were significantly higher in the responder group than in the nonresponder group. CS and RS parameters with first peak showed moderate accuracy (AUC ≥0.70), despite the low accuracy in the CS and RS parameters derived from maximum peak. LS parameters derived from both the maximum and first peaks showed low accuracy.
Table 3.
STE Parameters in Volume Responders and Nonresponders and the Ability to Predict Responders in the START Study
Dyssynchrony
parameter |
All
(n=180) |
Responder
(n=109) |
Nonresponder
(n=62) |
P value* |
AUC |
P value |
Cutoff
value |
Sensitivity |
Specificity |
Positive
predict
value |
| CS (ms) |
| Tmax-SD |
106.1±51.7 |
114.4±52.8 |
93.3±46.9 |
0.01 |
0.62 |
0.01 |
82 |
0.64 |
0.53 |
0.71 |
| Tmax-TD |
236.9±128.4 |
283.7±131.0 |
233.1±117.2 |
0.01 |
0.61 |
0.02 |
216 |
0.62 |
0.60 |
0.73 |
| Tmax-TDSL |
186.8±157.3 |
208.3±165.3 |
156.3±129.1 |
0.02 |
0.61 |
0.02 |
145 |
0.68 |
0.52 |
0.71 |
| Tfirst-SD |
133.8±51.8 |
151.9±45.3 |
105.3±49.0 |
<0.001 |
0.76 |
<0.001 |
116 |
0.82 |
0.69 |
0.82 |
| Tfirst-TD |
323.8±120.1 |
360.7±103.1 |
264.8±121.1 |
<0.001 |
0.73 |
<0.001 |
283 |
0.79 |
0.65 |
0.80 |
| Tfirst-TDSL |
268.0±153.1 |
317.2±125.8 |
192.9±148.3 |
<0.001 |
0.74 |
<0.001 |
208 |
0.84 |
0.61 |
0.79 |
| RS (ms) |
| Tmax-SD |
112.7±69.1 |
122.4±70.4 |
99.5±66.7 |
0.04 |
0.59 |
0.06 |
– |
– |
– |
– |
| Tmax-TD |
235.9±153.7 |
285.9±154.4 |
237.8±152.0 |
0.051 |
0.59 |
0.06 |
– |
– |
– |
– |
| Tmax-TDSL |
273.7±172.1 |
197.6±163.0 |
196.7±149.7 |
0.97 |
0.50 |
0.95 |
– |
– |
– |
– |
| Tfirst-SD |
142.4±66.9 |
161.2±61.6 |
117.9±65.6 |
<0.001 |
0.70 |
<0.001 |
126 |
0.76 |
0.60 |
0.77 |
| Tfirst-TD |
322.9±141.4 |
366.2±126.9 |
264.8±136.9 |
<0.001 |
0.72 |
<0.001 |
283 |
0.79 |
0.53 |
0.75 |
| Tfirst-TDSL |
273.7±172.1 |
320.0±162.5 |
210.8±167.3 |
<0.001 |
0.70 |
<0.001 |
265 |
0.72 |
0.60 |
0.76 |
| LS (ms) |
| Tmax-SD |
113.0±42.4 |
118.6±40.8 |
103.3±43.7 |
0.02 |
0.61 |
0.01 |
100 |
0.63 |
0.57 |
0.72 |
| Tmax-TD |
368.5±131.7 |
381.3±122.4 |
346.1±144.7 |
0.09 |
0.58 |
0.05 |
– |
– |
– |
– |
| Tmax-TDSL |
246.0±131.3 |
260.7±173.1 |
220.0±135.9 |
0.11 |
0.57 |
0.09 |
– |
– |
– |
– |
| Tfirst-SD |
128.8±43.6 |
136.3±42.8 |
115.2±41.9 |
0.002 |
0.63 |
0.003 |
129 |
0.61 |
0.65 |
0.75 |
| Tfirst-TD |
412.7±121.4 |
431.7±115.9 |
379.6±124.6 |
0.007 |
0.62 |
0.01 |
420 |
0.64 |
0.55 |
0.71 |
| Tfirst-TDSL |
318.8±152.0 |
337.7±156.0 |
285.5±139.8 |
0.03 |
0.61 |
0.02 |
248 |
0.69 |
0.52 |
0.71 |
*Responder vs. nonresponder. AUC, area under the curve; CS, circumferential strain; LS, longitudinal strain; RS, radial strain; STE, speckle tracking echocardiography; Tfirst-SD, SD of time from QRS onset to first peak; Tfirst-TD, time difference between the smallest Tfirst
and largest Tfirst; Tfirst-TDSL, Tfirst
between the septum and lateral wall; Tmax-SD, SD of time from QRS onset to maximum strain; Tmax-TD, time difference between the smallest Tmax
and largest Tmax; Tmax-TDSL, TDmax
between the septum and lateral wall. Other abbreviations as in Tables 1,2.
Baseline predictors of volume responders are shown in
Table 4. We selected the best first-peak parameter in CS, that in RS and the combined parameter. Three multivariate logistic regression analysis models were assessed using Tfirst-SD of CS >116 ms, Tfirst-SD of RS >126 ms, and combined Tfirst-SD, which was a combined dyssynchrony criterion that requires at least one of Tfirst-SD of CS >116 ms or Tfirst-SD of RS >125 ms. Each STE dyssynchrony parameter was identified as an independent predictor of a volume responder in addition to the presence of left bundle branch block or RV pacing, serum blood urea nitrogen level >30 mg/dl, administration of β-blocker, and mitral regurgitation index >40%.
Table 4.
Logistic Regression Analysis for Predefined Predictors of Volume Responders in the START Study
| Characteristic |
Univariate |
Multivariate model 1 |
Multivariate model 2 |
Multivariate model 3 |
| OR (95% CI) |
P value |
OR (95% CI) |
P value |
OR (95% CI) |
P value |
OR (95% CI) |
P value |
| Age, years |
1.01
(0.98–1.03) |
0.61 |
|
|
|
|
|
|
| Sex, male |
0.71
(0.36–1.38) |
0.31 |
|
|
|
|
|
|
| LBBB or RV pacing |
4.47
(2.24–8.90) |
<0.001 |
5.05
(1.78–14.4) |
0.002 |
4.90
(1.80–13.3) |
0.002 |
4.83
(1.59–14.7) |
0.005 |
| Baseline BNP >1,000 pg/ml |
0.47
(0.23–0.97) |
0.04 |
|
|
|
|
|
|
| Baseline BUN >30 mg/dl |
0.40
(0.20–0.80) |
<0.001 |
0.20
(0.07–0.56) |
0.002 |
0.21
(0.08–0.55) |
0.002 |
0.21
(0.07–0.59) |
0.003 |
| Loop diuretics |
3.22
(1.16–8.92) |
0.03 |
|
|
|
|
|
|
| β-blocker |
3.00
(1.38–6.53) |
0.006 |
7.87
(2.49–24.9) |
<0.001 |
6.67
(2.27–19.6) |
0.001 |
7.08
(2.22–22.4) |
0.001 |
| MR index >40% |
0.33
(0.15–0.73) |
0.006 |
0.24
(0.07–0.81) |
0.02 |
0.21
(0.07–0.66) |
0.007 |
0.15
(0.04–0.55) |
0.004 |
| IMD >40 ms |
1.01
(1.00–1.02) |
0.005 |
|
|
|
|
|
|
| CS Tfirst-SD >116 ms |
10.0
(4.87–20.8) |
<0.001 |
9.83
(3.78–25.6) |
<0.001 |
|
|
|
|
| CS Tfirst-TD >283 ms |
6.80
(3.40–13.6) |
<0.001 |
|
|
|
|
|
|
| CS Tfirst-TDSL >208 ms |
8.57
(4.14–17.7) |
<0.001 |
|
|
|
|
|
|
| RS Tfirst-SD >126 ms |
4.72
(2.41–9.25) |
<0.001 |
|
|
4.42
(1.81–10.8) |
0.001 |
|
|
| RS Tfirst-TD >283 ms |
4.26
(2.16–8.38) |
<0.001 |
|
|
|
|
|
|
| RS Tfirst-TDSL >265 ms |
3.90
(2.01–7.53) |
<0.001 |
|
|
|
|
|
|
| LS Tfirst-SD >129 ms |
2.86
(1.49–5.46) |
0.002 |
|
|
|
|
|
|
| Combined Tfirst-SD |
15.3
(6.38–36.8) |
<0.001 |
|
|
|
|
25.1
(6.04–94.7) |
<0.001 |
CI, confidence interval; Combined Tfirst-SD, combined dyssynchrony criterion that requires at least one of CS Tfirst-SD >116 ms or RS Tfirst-SD >126 ms; T, time. Other abbreviations as in Tables 1–3.
Univariate Cox proportional hazard analyses adjusted for age and sex revealed the relations of 8 predefined parameters with a composite of death from cardiac cause or unplanned hospitalization for heart failure (Table 5). Because 2 dyssynchrony parameters were associated with the endpoint, as well as the multivariate logistic regression analysis, 3 multivariate analysis models were assessed using Tfirst-SD of CS >125 ms, Tfirst-SD of RS >98 ms, and combined Tfirst-SD, which was a combined dyssynchrony criterion that requires at least one of Tfirst-SD of CS >125 ms or Tfirst-SD of RS >98 ms. As shown in the multivariate model 1, Tfirst-SD of CS >125 ms was associated with the endpoints independently of serum creatinine level >1.0 mg/dl and LV end-diastolic volume >250 ml. In contrast, Tfirst-SD of RS >98 ms and combined Tfirst-SD were not identified as independent predictors in multivariate models 2 and 3, respectively.
Table 5.
Univariate and Multivariate Predictors of Death From Cardiac Causes or Unplanned Hospitalization for Heart Failure by the Cox Proportional Hazard Model in the START Study
| Predictor |
Univariate |
Multivariate model 1 |
Multivariate model 2 |
Multivariate model 3 |
| HR (95% CI) |
P value |
HR (95% CI) |
P value |
HR (95% CI) |
P value |
HR (95% CI) |
P value |
| Age, years |
1.007
(0.98–1.03) |
0.63 |
|
|
|
|
|
|
| Sex, male |
1.23
(0.63–2.34) |
0.53 |
|
|
|
|
|
|
| Ischemic cardiomyopathy |
2.02
(1.03–3.99) |
0.04 |
|
|
|
|
|
|
| LBBB or RV pacing |
0.50
(0.27–0.93) |
0.02 |
|
|
0.49
(0.24–0.99) |
0.04 |
|
|
| Loop diuretics |
3.41
(1.02–14.1) |
0.04 |
|
|
|
|
|
|
| Amiodarone |
0.72
(052–0.98) |
0.03 |
|
|
|
|
|
|
| Cre >1.0 mg/dl |
2.98
(1.45–6.11) |
0.003 |
2.51
(1.15–5.45) |
0.02 |
2.70
(1.24–5.89) |
0.01 |
2.67
(1.23–5.86) |
0.01 |
| LVEDV >250 ml |
3.01
(1.52–6.19) |
0.002 |
5.39
(2.39–12.1) |
<0.001 |
4.74
(2.12–10.6) |
<0.001 |
4.80
(2.16–10.7) |
<0.001 |
| CS Tfirst-SD >125 ms |
0.31
(0.16–0.61) |
0.001 |
0.35
(0.17–0.73) |
0.005 |
|
|
|
|
| RS Tfirst-SD >98 ms |
0.52
(0.31–0.86) |
0.01 |
|
|
0.65
(0.32–1.23) |
0.18 |
|
|
| Combined Tfirst-SD |
0.50
(0.27–0.94) |
0.03 |
|
|
|
|
0.62
(0.30–1.27) |
0.19 |
HR, hazard ratio. Other abbreviations as in Tables 1–4.
Kaplan-Meier estimates of the time to endpoint are shown in
Figure 3. There were significantly fewer events in patients with Tfirst-SD of CS >125 ms than in those with Tfirst-SD of CS ≤125 ms (log rank, P<0.001). Of the 13 events in patients with Tfirst-SD of CS >125 ms, heart failure was the cause of death in 3 patients, sudden cardiac death occurred in 2 patients, and unplanned hospitalization occurred in 7 patients. Of the 28 events in patients with Tfirst-SD of CS ≤125 ms, heart failure was the cause of death in 5 patients and of unplanned hospitalization in 19 patients. Sudden cardiac death occurred in 3 patients and noncardiac death occurred in 2 patients. Other cardiovascular events were the cause of death in 1 patient in each arm.
Reproducibility
Interobserver agreement of LV dyssynchrony by STE among the core laboratories was substantial or excellent (Cohen’s κ coefficient of Tmax-SD: RS=0.82, CS=0.80, and LS=0.77; Tmax-TD: RS=0.79, CS=0.81, LS=0.74; Tfirst-SD: RS=0.81, CS=0.84, and LS=0.78; and Tfirst-TD: RS=0.80, CS=0.81, and LS=0.75).
Discussion
This prospective multicenter study revealed strong feasibility of dyssynchrony assessment by STE. In particular, Tfirst-SD of CS was the best dyssynchrony parameter to predict volume responders and Tfirst-SD of RS was second best. Both parameters were also positively associated with clinical endpoints. Moreover, we strictly assessed the objectivity of the data, and the interinstitutional reproducibility was excellent.
Conventional Dyssynchrony Parameters and STE Parameters
Our study reconfirmed the unfeasibility of conventional dyssynchrony parameters obtained from time-to-peak analysis with M-mode, conventional Doppler, or tissue Doppler methods. Because of approximately 30% of patients being nonresponders based on the guidelines,16
these echocardiographic parameters were developed in single-center studies to improve CRT response.17
However, these attempts were challenged in prospective multicenter studies because of poor reproducibility, low positive predictive values, and poor accuracy even in healthy control subjects.4–7,18
Several studies suggested that STE overcame some limitations of tissue velocity imaging and provided a better measurement of mechanical dyssynchrony. The dyssynchrony parameters by STE were proposed as additional indices to predict CRT response in single-center studies or those with small sample sizes.8–11,19
However, the real clinical effect of STE in identifying CRT responders can be verified only through a well-performed, prospective, and multicenter study. The present study meets these requirements with its study design, good interinstitutional reproducibility, and objectivity of STE data.
First Peak Measurements in Time-Strain Curve
We showed for the first time, to our knowledge, that strain parameters with first peak were superior to maximum peak strain parameters for predicting CRT responders. Moreover, experimental studies suggest that maximum peak strain-derived dyssynchrony indices may exaggerate underlying electrical dyssynchrony, and the parameters do not directly reflect electrical dyssynchrony.20,21
Abnormal systolic motion of the interventricular septum with electrical dyssynchrony includes multiple phases of myocardial shortening during the pre-ejection and ejection periods. Ventricular contraction abnormalities with electrical dyssynchrony are typically characterized as early septal contraction and lateral stretch, followed by septal stretch and lateral contraction later in systole. Pre-ejection septal shortening reflects active contraction, suggesting that the pre-ejection phase should be included when assessing LV dyssynchrony.22
Moreover, because of the complex mechanical interactions between different parts of the LV wall, maximum peak measurements by STE mislead by misidentifying apparent dyssynchrony with complete left bundle branch block as no dyssynchrony.23
Thus, first peak is more related to the electrical activation that can be treated by CRT than mamixum peak.19–23
Superiority of CS
In the present study, the first peak of the CS parameter showed the best predictive value as a single parameter approach, and use of combined parameters was superior to that of single parameters. Some researchers reported that global LS decreases firstly in 3 directions and is not associated with LV reverse remodeling or outcomes after CRT, which might be associated with the poor predictive value of LS dyssynchrony parameters in this study.24,25
In contrast, most researchers have shown the usefulness of RS to predict CRT response.8–11
The recent randomized, controlled, 2-center trial of the use of RS analysis only to target LV lead placement showed that RS analysis yielded significantly improved response and clinical outcomes.26
However, a core laboratory was not assigned and reproducibility of strain analysis was not evaluated in that trial. Thus, uncertainty remains as to which approach is best (longitudinal, circumferential, radial, transverse, or combined) to determine dyssynchrony. We believe the evidence from the present study is reliable; however, the difference between CS and RS was small, and further investigations are needed.
Clinical Outcomes
We found that the first peak of the CS parameter was an independent predictor of clinical outcomes. Hara et al27
showed that patients with dyssynchrony had more favorable long-term survival than those without dyssynchrony after CRT. The important finding was that clinical outcomes of patients with significant dyssynchrony were more favorable than those of patients without dyssynchrony. The present results also support the association of echocardiographic dyssynchrony with patient outcome after CRT.
Objectivity and Reproducibility of the STE Data
Multicenter trials require objective measurements that are accurate and reproducible across enrollment sites. Data from each core laboratory in the present study were registered in a central database via the internet. The PROSPECT study demonstrated poor interinstitutional reproducibility and lower accuracy partly because of differences in methods of data acquisition and analysis.6
Therefore, we devised standardized data acquisition and analysis protocols to precisely measure first and maximum peak time in the study headquarters and 5 core laboratories. The results show that interobserver agreement of LV dyssynchrony by STE among the core laboratories was substantial or excellent.
Clinical Implications
The clinically important finding was that the first peak and circumferential assessments were found to be superior to other parameters. Some reports have not even defined the position of the first or maximum peak strain. We speculate that clear definition of first-peak measurements makes dyssynchrony assessments more reproducible than maximum peak measurements.5–7
The evidence from this study is acceptable, and a standardized protocol may improve the ability to predict CRT responders.
Study Limitations
The accuracy of strain parameters in this study was not as good as that previously reported in single-center studies. Recent reports insist on the importance of understanding the complexity and variety of the etiology of cardiac dyssynchrony. We did not take into account lead position or myocardial viability, and the influence of these complex factors cannot be denied. However, we think that the results of this study are more objective than those of previous studies and closer to the true predictive value of time-to-peak strain analysis. Some researchers have advocated new dyssynchrony parameters such as wasted energy or discoordination analysis;28–30
however, the present prospective study was planned prior to the reporting of these parameters, and we only performed time-to-peak analysis by STE. Results using these new methods could be presented as a subanalysis of the START study.
Conclusions
The START study, a prospective, multicenter study of dyssynchrony assessments, showed for the first time, to our knowledge, that first-peak strain parameters in all 3 directions were superior to maximum peak parameters for predicting CRT responders. In particular, the first peak of the CS parameter showed the best predictive value in a single parameter approach. This study also revealed stong feasibility of dyssynchrony assessments by STE, which may improve the ability to predict CRT responders.
Disclosures
Financial Support: This work was supported by JSPS KAKENHI Grant Number 22590768. No other disclosures to declare.
References
- 1.
Bristow MR, Saxon LA, Boehmer J, Krueger S, Kass DA, De Marco T, et al; Comparison of Medical Therapy, Pacing, and Defibrillation in Heart Failure (COMPANION) Investigators. Cardiac-resynchronization therapy with or without an implantable defibrillator in advanced chronic heart failure. N Engl J Med 2004; 350: 2140–2150.
- 2.
Cleland JG, Daubert JC, Erdmann E, Freemantle N, Gras D, Kappenberger L, et al; Cardiac Resynchronization-Heart Failure (CARE-HF) Study Investigators. The effect of cardiac resynchronization on morbidity and mortality in heart failure. N Engl J Med 2005; 352: 1539–1549.
- 3.
Moss AJ, Hall WJ, Cannom DS, Klein H, Brown MW, Daubert JP, et al; MADIT-CRT Trial Investigators. Cardiac-resynchronization therapy for the prevention of heart-failure events. N Engl J Med 2009; 361: 1329–1338.
- 4.
Seo Y, Ito H, Nakatani S, Takami M, Naito S, Shiga T, et al; J-CRT investigators. The role of echocardiography in predicting responders to cardiac resynchronization therapy. Circ J 2011; 75: 1156–1163.
- 5.
Beshai JF, Grimm RA, Nagueh SF, Baker JH 2nd, Beau SL, Greenberg SM, et al; RethinQ Study Investigators. Cardiac-resynchronization therapy in heart failure with narrow QRS complexes. N Engl J Med 2007; 357: 2461–2471.
- 6.
Chung ES, Leon AR, Tavazzi L, Sun JP, Nihoyannopoulos P, Merlino J, et al. Results of the Predictors of Response to CRT (PROSPECT) trial. Circulation 2008; 117: 2608–2616.
- 7.
Ruschitzka F, Abraham WT, Singh JP, Bax JJ, Borer JS, Brugada J, et al; EchoCRT Study Group. Cardiac-resynchronization therapy in heart failure with a narrow QRS complex. N Engl J Med 2013; 369: 1395–1405.
- 8.
Suffoletto MS, Dohi K, Cannesson M, Saba S, Gorcsan J 3rd. Novel speckle-tracking radial strain from routine black-and-white echocardiographic images to quantify dyssynchrony and predict response to cardiac resynchronization therapy. Circulation 2006; 113: 960–968.
- 9.
Knappe D, Pouleur AC, Shah AM, Cheng S, Uno H, Hall WJ, et al; Multicenter Automatic Defibrillator Implantation Trial-Cardiac Resynchronization Therapy Investigators. Dyssynchrony, contractile function, and response to cardiac resynchronization therapy. Circ Heart Fail 2011; 4: 433–440.
- 10.
Delgado V, Ypenburg C, van Bommel RJ, Tops LF, Mollema SA, Marsan NA, et al. Assessment of left ventricular dyssynchrony by speckle tracking strain imaging comparison between longitudinal, circumferential, and radial strain in cardiac resynchronization therapy. J Am Coll Cardiol 2008; 51: 1944–1952.
- 11.
Tanaka H, Nesser HJ, Buck T, Oyenuga O, Jánosi RA, Winter S, et al. Dyssynchrony by speckle-tracking echocardiography and response to cardiac resynchronization therapy: Results of the Speckle Tracking and Resynchronization (STAR) study. Eur Heart J 2010; 31: 1690–1700.
- 12.
Seo Y, Ishizu T, Sakamaki F, Yamamoto M, Machino T, Yamasaki H, et al. Mechanical dyssynchrony assessed by speckle tracking imaging as a reliable predictor of acute and chronic response to cardiac resynchronization therapy. J Am Soc Echocardiogr 2009; 22: 839–846.
- 13.
Conca C, Faletra FF, Miyazaki C, Oh J, Mantovani A, Klersy C, et al. Echocardiographic parameters of mechanical synchrony in healthy individuals. Am J Cardiol 2009; 103: 136–142.
- 14.
Gorcsan J 3rd, Abraham T, Agler DA, Bax JJ, Derumeaux G, Grimm RA, et al. Echocardiography for cardiac resynchronization therapy: Recommendations for performance and reporting: A report from the American Society of Echocardiography Dyssynchrony Writing Group endorsed by the Heart Rhythm Society. J Am Soc Echocardiogr 2008; 21: 191–213.
- 15.
Tanaka H, Hara H, Saba S, Gorcsan J. Prediction of response to cardiac resynchronization therapy by speckle tracking echocardiography using different software approaches. J Am Soc Echocardiogr 2009; 22: 677–684.
- 16.
JCS Joint Working Group. Guidelines for non-pharmacotherapy of cardiac arrhythmias (JCS 2011): Digest version. Circ J 2013; 77: 249–274.
- 17.
Bax JJ, Ansalone G, Breithardt OA, Derumeaux G, Leclercq C, Schalij MJ, et al. Echocardiographic evaluation of cardiac resynchronization therapy: Ready for routine clinical use? A critical appraisal. J Am Coll Cardiol 2004; 44: 1–9.
- 18.
Miyazaki C, Powell BD, Bruce CJ, Espinosa RE, Redfield MM, Miller FA, et al. Comparison of echocardiographic dyssynchrony assessment by tissue velocity and strain imaging in subjects with or without systolic dysfunction and with or without left bundle-branch block. Circulation 2008; 117: 2617–2625.
- 19.
Miyazaki C, Lin G, Powell BD, Espinosa RE, Bruce CJ, Miller FA Jr, et al. Strain dyssynchrony index correlates with improvement in left ventricular volume after cardiac resynchronization therapy better than tissue velocity dyssynchrony indexes. Circ Cardiovasc Imaging 2008; 1: 14–22.
- 20.
Prinzen FW, Hunter WC, Wyman BT, McVeigh ER. Mapping of regional myocardial strain and work during ventricular pacing: Experimental study using magnetic resonance imaging tagging. J Am Coll Cardiol 1999; 33: 1735–1742.
- 21.
Duckett SG, Camara O, Ginks MR, Bostock J, Chinchapatnam P, Sermesant M, et al. Relationship between endocardial activation sequences defined by high-density mapping to early septal contraction (septal flash) in patients with left bundle branch block undergoing cardiac resynchronization therapy. Europace 2012; 14: 99–106.
- 22.
Gjesdal O, Remme EW, Opdahl A, Skulstad H, Russell K, Kongsgaard E, et al. Mechanisms of abnormal systolic motion of the interventricular septum during left bundle-branch block. Circ Cardiovasc Imaging 2011; 4: 264–273.
- 23.
Smiseth OA, Russell K, Skulstad H. The role of echocardiography in quantification of left ventricular dyssynchrony: State of the art and future directions. Eur Heart J Cardiovasc Imaging 2012; 13: 61–68.
- 24.
Zhang Q, Fung JWH, Yip GWK, Chan JYS, Lee APW, Lam YY, et al. Improvement of left ventricular myocardial short-axis, but not long-axis function or torsion after cardiac resynchronisation therapy: An assessment by two-dimensional speckle tracking. Heart 2008; 94: 1464–1471.
- 25.
Mochizuki Y, Tanaka H, Tatsumi K, Matsumoto K, Imanishi J, Yoshida A, et al. Easy-to-use comprehensive speckle-tracking approach for cardiac resynchronization therapy. Circ J 2014; 78: 2250–2258.
- 26.
Khan FZ, Virdee MS, Palmer CR, Pugh PJ, O’Halloran D, Elsik M, et al. Targeted left ventricular lead placement to guide cardiac resynchronization therapy: The TARGET study: A randomized, controlled trial. J Am Coll Cardiol 2012; 59: 1509–1518.
- 27.
Hara H, Oyenuga OA, Tanaka H, Adelstein EC, Onishi T, McNamara DM, et al. The relationship of QRS morphology and mechanical dyssynchrony to long-term outcome following cardiac resynchronization therapy. Eur Heart J 2012; 33: 2680–2691.
- 28.
Lim P, Buakhamsri A, Popovic ZB, Greenberg NL, Patel D, Thomas JD, et al. Longitudinal strain delay index by speckle tracking imaging: A new marker of response to cardiac resynchronization therapy. Circulation 2008; 118: 1130–1137.
- 29.
Risum N, Williams ES, Khouri MG, Jackson KP, Olsen NT, Jons C, et al. Mechanical dyssynchrony evaluated by tissue Doppler cross-correlation analysis is associated with long-term survival in patients after cardiac resynchronization therapy. Eur Heart J 2013; 34: 48–56.
- 30.
Iwano H, Yamada S, Watanabe M, Mitsuyama H, Mizukami K, Nishino H, et al. Strain rate dispersion index can predict changes in left ventricular volume and adverse cardiac events following cardiac resynchronization therapy. Circ J 2013; 77: 2757–2765.

