Abstract
Cardiovascular magnetic resonance is a well-established tool for the quantification of focal fibrosis. With the introduction of T1 mapping, diffuse myocardial processes can be detected and quantified. In particular, infiltration and storage disorders with large disease-related changes, and diffuse fibrosis where measurement is harder but the potential impact larger. This has added a new dimension to the understanding and assessment of various myocardial diseases. T1 mapping promises to detect early disease, quantify disease severity and provide prognostic insights into certain conditions. It also has the potential to be a robust surrogate marker in drug development trials to monitor therapeutic response and be a prognostic marker in certain diseases. T1 mapping is an evolving field and numerous factors currently preclude its standardization. In this review, we describe the current status of T1 mapping and its potential promises and pitfalls. (Circ J 2015; 79: 487–494)
The Need for T1 Mapping
Cardiovascular magnetic resonance (CMR) is the gold standard for noninvasive detection of focal fibrosis using gadolinium-based contrast agents (GBCA).1–4
This technique cannot be used to quantify diffuse fibrosis and for that, endomyocardial biopsy (EMB) remains the gold standard despite being prone to sampling error. Biopsy also carries with it inherent procedural risk and provides no information on the extent of ventricular involvement.5,6
With the introduction of T1 mapping, diffuse processes can now be detected and quantified, particularly for infiltrative and storage processes where the signal is high and for quantification of diffuse fibrosis, which is difficult to perform, but potentially has greater impact. This is reflected by the exponential rise in the number of myocardial T1 mapping-related publications referenced on Pubmed (Figure 1), and the swift progress made towards delivery of T1 mapping as a commercially available clinical test. It offers numerous promises, such as early detection of specific conditions; a surrogate marker in drug development trials, and as a prognostic marker in certain diseases. However, this is a still rapidly evolving field and numerous factors are currently precluding its standardization.7
This review describes the status quo of T1 mapping and its potential promises and pitfalls.

T1 Mapping: Past and Present
Late gadolinium enhancement (LGE) imaging was an advance on T1-weighted imaging because the operator could select a tissue that was “normal” and null it; that is, exaggerating the signal from any tissue with a different T1, thus identifying focally abnormal regions such as scar (eg, infarction), edema or amyloid. T1 mapping requires quantification of the exact T1 of a particular tissue and can be performed without GBCA. Different tissues have specific ranges of T1 (milliseconds) at a particular magnetic field strength8
and can be used to detect pathology.
Native T1 or Native Myocardial T1
The native T1, or noncontrast myocardial T1, is the longitudinal relaxation time (T1) of a given tissue without GBCA. This provides an intrinsic signal from both the myocytes and the interstitium.9
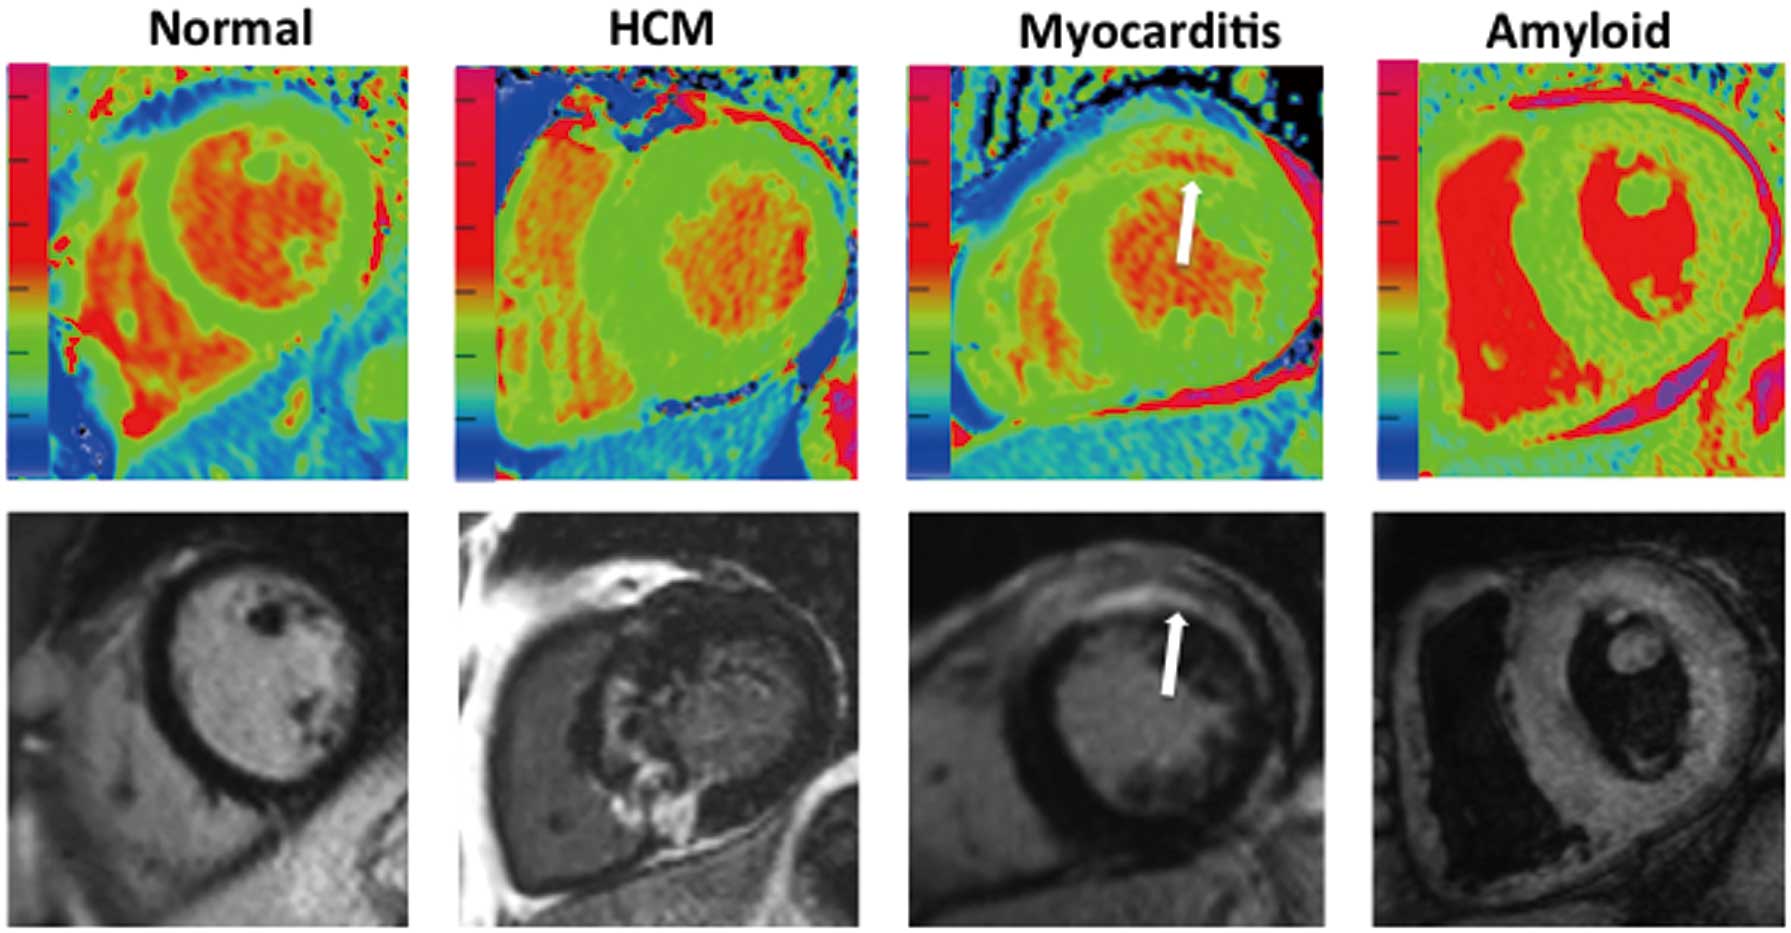
Our current understanding is that T1 is prolonged with fibrosis,10
edema11
and amyloid12
(Figure 2) and reduced in lipid accumulation (Anderson-Fabry disease [AFD]),13
cardiac siderosis,14
(Figure 3) and hemorrhage in acute infarction (Figure 4).15
However, as techniques advance, potentially other trends may be found. It does appear that pseudo-normalization of native T1 values also occurs when 2 processes cancel out coexisting fibrosis and iron (eg, sickle cell disease) or lipid (eg, AFD).16
Post-Contrast T1 for Extracellular Volume (ECV) Quantification
The extracellular matrix (ECM) is a complex architectural network made up of structural and nonstructural proteins contributing to strength and plasticity.17
The matrix is hydrated with extracellular fluid; measurement of this, the ECV, approximates the ECM. The ECM and ECV may expand with fibrosis, edema or amyloid (Figure 2).
GBCAs do not cross cell membranes. Post-contrast T1 mapping therefore partly measures the extracellular space. However, factors such as renal excretion rate, altered wash-in and wash-out kinetics of GBCAs in diseased myocardium,18
the volume of distribution and the acquisition time19
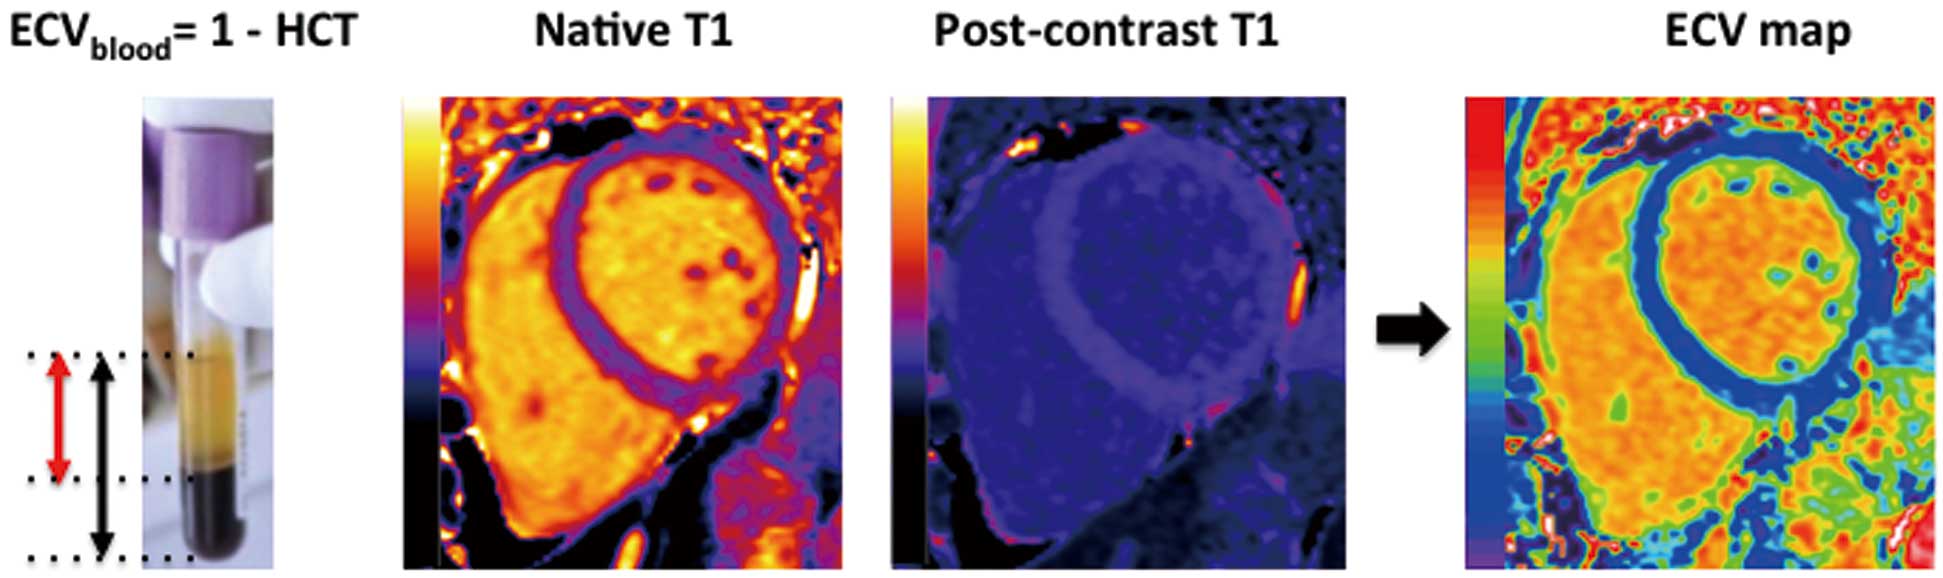
are influential. The ECV technique intrinsically corrects for this. ECV measurement is done when the concentration of contrast is equal in the water between cells in the myocardium and in blood; a sufficient equilibrium exists, either by a primed infusion or after a bolus and sufficient time (15 minutes is adequate for all but massive interstitial expansion).20
The ratio of a pre- to post-contrast signal change in the myocardium and blood reflects the relative ECV of the blood and myocardium (ie, the partition coefficient). As the blood ECV is one minus the hematocrit (from a simple blood test,
Figure 5), this can be substituted to obtain the myocardial ECV,20
which is (1–hematocrit)×∆R1myocardium/∆R1blood, where R1=1/T1.
There is no real need to use an infusion; the bolus-only method21
works for conditions with ECV <0.4, but progressively reads a higher ECV in high interstitial expansion diseases. An alternative approach is to perform multiple T1 measurements during contrast wash-out rather than awaiting equilibrium.22
The accuracy and relative precision of these approaches are unknown, and currently most centers do a single pre- and post-contrast measurement. Newer approaches are to automatically register the pre- and post-contrast T1 maps to create ECV maps (Figure 5).23
Measuring the T1: Techniques and Sequences
Initial methods of T1 measurement involved multiple breath-holds to obtain the recovery curve from different time points. The Look-Locker sequence was introduced24
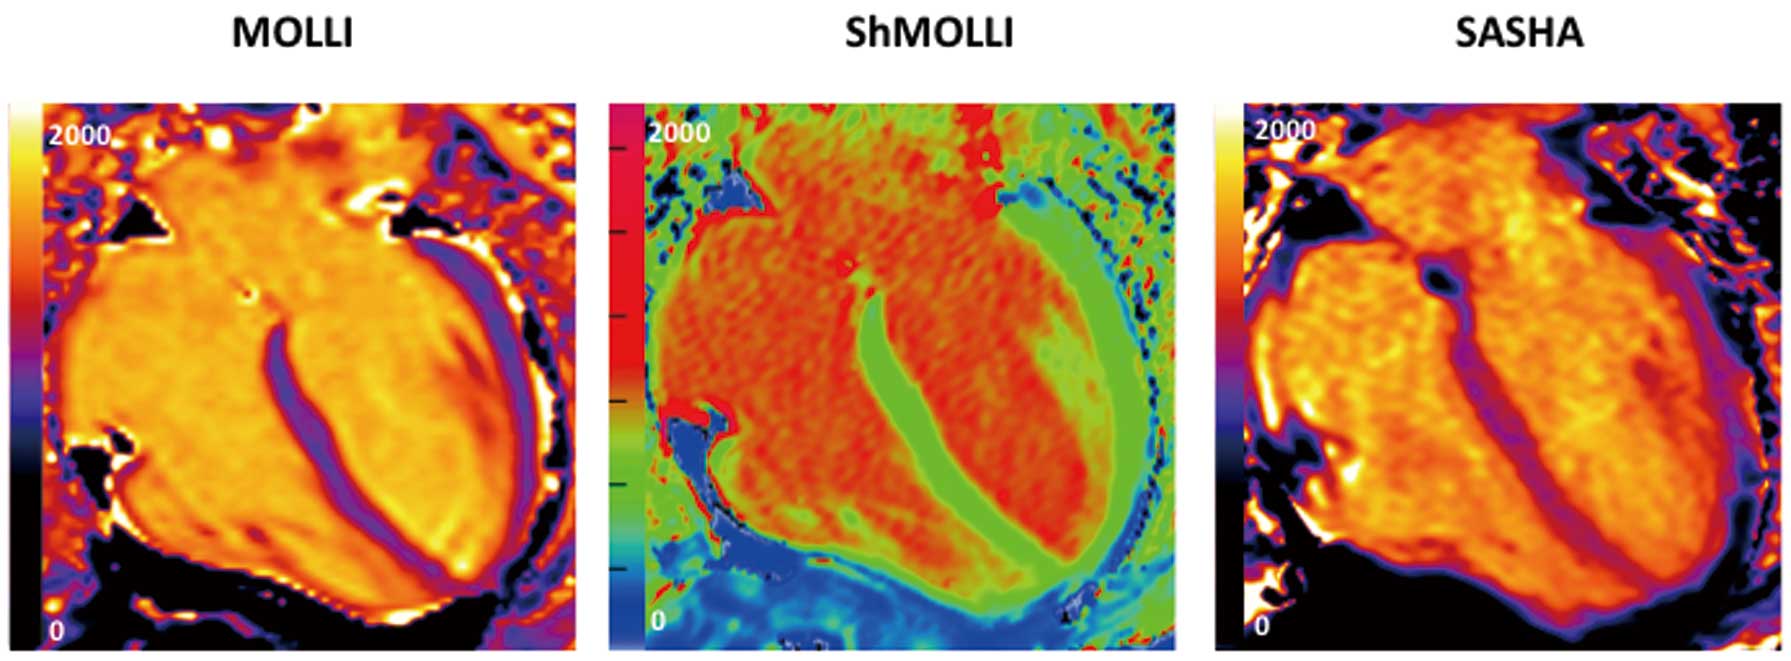
to measure the T1 relaxation time at multiple time points after an initial excitation pulse and then subsequently adapted as the modified Look-Locker inversion recovery (MOLLI)25
sequence. Color pixel-wise “T1 maps”, whereby each pixel carries the measured value of T1 (Figure 6), can now be generated. Since the introduction of the MOLLI method, multiple incremental improvements have been made, including better inversion pulses, sampling schemes, image reconstruction (eg, motion correction),18,25
curve fitting (making shorter breath-holds) and the introduction of error maps to provide confidence in measured results.26
New techniques have also been developed, including the saturation recovery single-shot acquisition (SASHA) sequence27
and hybrid schemes (eg, SAPPHIRE), which is heart rate independent and uses a combination of saturation and inversion pulses.28,29
Each technique is implemented differently by different scanner manufacturers30–32
and there is currently a lack of clarity on which improvements are valuable or even how to measure this value. Intuitively, the best sequence would be the one that most accurately measures T1, but even this is difficult and it is likely that precision (compared to the disease signal) and robustness across a healthcare system (which is not yet done) may be more important than accuracy. Reflecting this, current advice is to have a locally produced reference range from healthy volunteers, although quality control and standardization systems are being constructed.
T1 Mapping in the Clinical Context
Cardiac Amyloidosis
Amyloid in ventricular muscle is either light-chain (AL) or transthyretin (ATTR) in origin. Massive deposition of amyloid can occur in the heart, causing heart failure (HF) and a poor prognosis.33
Diagnosing cardiac amyloid using conventional CMR measures is easy in advanced disease, but harder in early disease (when treatment will improve survival). Late gadolinium imaging appearances are variable and renal failure precluding gadolinium administration use is not uncommon. T1 mapping techniques may have a higher sensitivity for detecting early disease,12
are able to quantify the amyloid and can be used in the context of renal failure. In addition, the ECV elevation in amyloidosis is beyond that of any other disease, making it pathognomonic. AL may have a higher native T1 and ATTR has a higher ECV, which hints at the underlying biology and may help predict the underlying subtype.34,35
Both native T1 and ECV are linked to prognosis36,37
and are currently being used as surrogate markers in 2 clinical trials of novel therapeutic agents for the treatment of amyloidosis (NCT 01981837 and 01777243).
AFD
AFD is a rare but treatable X-linked disorder resulting in sphingolipid deposition in a number of different organs. Its cardiac manifestations are left ventricular (LV) hypertrophy, arrhythmias and valvular disease.38
Early treatment with enzyme replacement therapy may reverse or slow disease progression. Native T1 mapping can identify patients early, potentially helping target the costly enzyme therapy. Two groups have independently demonstrated lower myocardial T1 values in AFD patients compared with healthy controls.13,39
Furthermore, T1 mapping can discriminate against other diseases with hypertrophy with no overlap in T1 values13
and has excellent reproducibility.40
Pseudo-normalization in T1 values (mixed extracellular fibrosis and lipid) and subsequent prolongation of T1 (burnt-out fibrosis) may provide an insight into disease progression.
Iron Overload
Hemochromatosis (primary and secondary) is characterized by a progressive increase in total body iron stores and abnormal iron deposition in several organs, including the heart and liver. Aggressive chelation therapy can prevent death, but is not without side effects.41
Development of the T2* imaging technique for the quantification of cardiac iron deposition led to a shift in the survival of patients with cardiac siderosis,42
but it requires a long breath-hold, and post-processing can be complex. Iron shortens the native T1 and Sado et al recently showed T1 mapping had a good correlation with T2*, was more reproducible and could potentially improve the detection of mild iron overload.14
This will inevitably have implications for future clinical trial design and therapeutic monitoring.
Ischemic Heart Disease
The role of T1 mapping in understanding LV remodeling following myocardial infarction has also been explored. Dall’Armellina et al noted that the higher the acute native T1 value, the lower the likelihood of segmental recovery at 6 months.43
Chan et al44
showed reduced post-contrast T1 in the remote myocardium of acute and chronic infarct patients when compared with controls. In that group of patients, there was also a correlation between the post-contrast T1 value and LV ejection fraction (EF). However, other studies failed to show a difference in post-contrast T1 and ECV between the remote myocardium of infarct patients and controls.45,46
More work remains to be done. T1 mapping have been shown to correlate with the area at risk when compared with SPECT47
and more validation studies are needed to establish its role with reference to T2 mapping.
HF
T1 mapping adds a new dimension to improving our understanding of the changes to the ECM, which plays a role in the pathogenesis of HF. There is a correlation between post-contrast T1 values and diffuse fibrosis on EMB48
and whole-heart histology (heart transplant)49
in patients with symptomatic HF. A strong correlation has also been shown between ECV and diastolic dysfunction in patients with HF and preserved EF,50
and a post-contrast T1 less than 388 ms (using their particular scanner and sequence) has been linked with an increased risk of cardiac events.51
Diabetic patients have been shown to have higher ECV values, and at a higher risk of death and hospitalization for HF.52
Of note, renin-angiotensin-aldosterone blockade was associated with lower ECV values.52
Aortic Stenosis (AS)
Despite existing guidelines for surgical treatment,53–55
the pathophysiology underlying AS is incompletely defined. Diffuse fibrosis may appear prior to symptom manifestation and architectural changes, so there is potential to improve diagnosis and treatment. Mild to moderate diffuse fibrosis at baseline has been linked to better symptomatic improvement through marked reduction of LV hypertrophy (LVH) postoperatively compared with those with severe fibrosis.56–58
Increased native T1 values have been shown to correlate with histology,10
and this increase was more pronounced in symptomatic patients. In a group of asymptomatic patients,59
native T1 values also correlated significantly with global longitudinal strain. ECV was found to be persistently elevated 6 months after aortic valve replacement for severe AS, despite LVH regression, indicating early LVH regression is predominantly a cellular process.20
Interest in T1 mapping as a biomarker in AS is growing and prospective cohort studies (NCT 01658345, 02174471, 01755936)60
are currently underway.
Cardiomyopathy
In a small cohort of dilated cardiomyopathy (DCM) patients,61
the native T1 values and ECV were increased in DCM patients when compared with normal volunteers, and a prolonged native T1 correlated with histological fibrosis.62–64
Likewise, native T1 values and ECV have been validated for hypertrophic cardiomyopathy (HCM) against normal cohorts.21,32,64,65
Puntmann et al also showed that native T1 mapping had higher sensitivity and specificity compared with post-contrast T1 and ECV to differentiate between DCM/HCM patients and normal volunteers.64
More work is being done on an international scale to explore the role of T1 mapping as a prognostic biomarker in HCM (HCMR study, NCT 01915615). In patients with muscular dystrophy and cardiac involvement, global and regional myocardial ECV values were significantly higher compared with patients without cardiac involvement and controls,66
and therefore may play a role in risk stratification of these patients. There is also growing interest in exploring the role of T1 mapping in the early detection of rejection following heart transplantation,67
in those at risk of uremic cardiomyopathy in chronic kidney disease,68
and in the detection of early diffuse fibrosis in systemic sclerosis69,70
and systemic lupus erythematosus.71
However, more validation work is required to establish which disease process will benefit the most from this technique.
Myocarditis
The clinical spectrum of acute myocarditis can range from subtle to catastrophic. Biopsy remains the gold standard for diagnosis but has limitations and CMR with LGE was a major advance. Existing techniques such as LGE imaging may be negative in cases with minimal areas of global rather than focal abnormality;72
detecting edema by conventional T2 imaging may be challenging.73,74
Native T1 mapping has been shown to have superior diagnostic performance and higher sensitivity for detection of acute myocarditis than T2-weighted and LGE imaging75,76
and was able to display typical non-ischemic patterns without the need for contrast agents when the patients were imaged within 3 days of presentation.77
ECV has not yet been well studied.
Atrial Fibrillation (AF)
AF78
is linked to diffuse atrial and ventricular fibrosis.79
Ling et al showed reduced post-contrast atrial T1 in AF predictive of outcome post ablation,80
and AF (persistent or paroxysmal) has reduced post-contrast T1 values,81
whereas tachycardia-induced cardiomyopathy has persistently lower post-contrast T1 values post ablation.82
However, it is our opinion that the technology for routinely quantifying diffuse atrial fibrosis does not exist at this stage.
Pitfalls and Challenges
There are several challenges before T1 mapping can be routinely implemented in clinical practice and the T1 Consensus Statement7
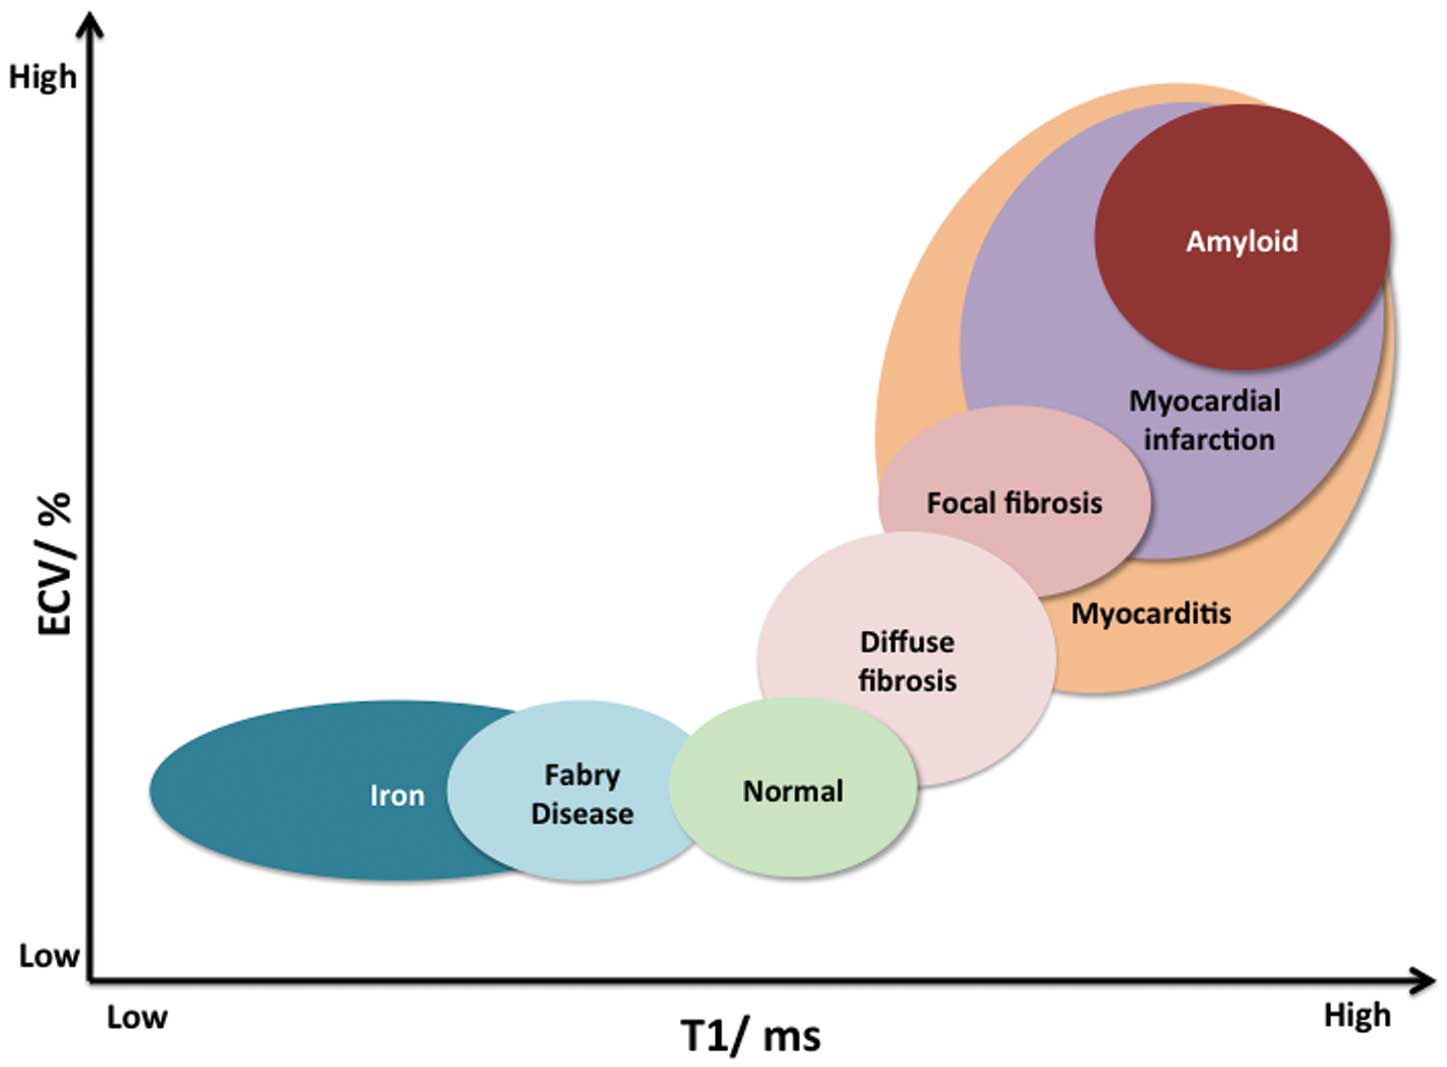
lays out some of these. Currently, it recommends the need for local normal values for every scanner, consistent parameters across pre- and post-contrast maps, quality control by use of parametric error maps, avoidance of partial voluming of blood when drawing regions of interest during analysis, and systematic testing of the accuracy, precision and stability of techniques over time. Other challenges remain, such as an overlap in T1 values between different disease states and normal (Figure 7), with the exceptions of large changes with fat, iron, amyloid and edema. Much work is ongoing to reduce the measurement error contributing to variability, including all aspects from sequence design and outputs, analysis methodology and quality control systems.
Future Prospects
The T1 mapping field is progressing rapidly on all fronts. New clinical developments, such as large, multicenter collaborations and Biobank studies, are underway. In the near future, T1 mapping could potentially change clinical practice and help develop new therapies for amyloid, AFD and iron overload. It will extend the spectrum of recognized disease in rheumatologic conditions affecting the heart, improve our understanding of myocarditis, may increase detection of infiltration in elderly HF (eg, ATTR amyloidosis) and explore new avenues such as monitoring of chemotherapy-induced cardiotoxicity (NCT 01719562) and cardiac involvement in HIV (NCT 02054494). These platforms should help develop tighter methodologies for diffuse fibrosis quantification. Integration of T1 mapping with other technologies (eg, genetics, proteomics, hybrid PET/MR imaging) may reinvigorate our understanding of the nature of myocardium and its components and transform our day-to-day management of disease processes.
Conclusions
Although T1 mapping is currently impeded by restricted accessibility, nonstandardized reference values for normal and abnormal myocardium, and non-uniformity of technique among vendors, it promises to play a fundamental role in a variety of clinical settings in the near future. We anticipate this will start for rare diseases, where there are high disease-related changes and clinical need and a drug development imperative will catalyze its standardization. This should subsequently provide the development platform for more robust methods for detection of diffuse fibrosis. Combined, the potential is for better mechanistic insights into disease processes, which should eventually lead to improved diagnostic pathways, prognostication and monitoring of therapy.
Acknowledgments
J.C. Moon has received grant funding from GlaxoSmithKline and is supported by the Higher Education Funding Council for England. This work was undertaken at the University College London Hospital and University College London, which received a proportion of funding from the Department of Health’s National Institute for Health Research Biomedical Research Centers funding scheme and in part supported by the Bristol NIHR Cardiovascular BRU.
References
- 1.
Assomull RG, Prasad SK, Lyne J, Smith G, Burman ED, Khan M, et al. Cardiovascular magnetic resonance, fibrosis, and prognosis in dilated cardiomyopathy. J Am Coll Cardiol 2006; 48: 1977–1985.
- 2.
Jiji RS, Kramer CM. Cardiovascular magnetic resonance: Applications in daily practice. Cardiol Rev 2011; 19: 246–254.
- 3.
Karamitsos TD, Neubauer S. The prognostic value of late gadolinium enhancement CMR in nonischemic cardiomyopathies. Curr Cardiol Rep 2013; 15: 326.
- 4.
Kramer CM, Barkhausen J, Flamm SD, Kim RJ, Nagel E, Society for Cardiovascular Magnetic Resonance Board of Trustees Task Force on Standardized Protocols. Standardized cardiovascular magnetic resonance imaging (CMR) protocols, society for cardiovascular magnetic resonance: Board of trustees task force on standardized protocols. J Cardiovasc Magn Reson 2008; 10: 35.
- 5.
Schalla S, Bekkers SC, Dennert R, van Suylen RJ, Waltenberger J, Leiner T, et al. Replacement and reactive myocardial fibrosis in idiopathic dilated cardiomyopathy: Comparison of magnetic resonance imaging with right ventricular biopsy. Eur J Heart Fail 2010; 12: 227–231.
- 6.
Mewton N, Liu CY, Croisille P, Bluemke D, Lima JA. Assessment of myocardial fibrosis with cardiovascular magnetic resonance. J Am Coll Cardiol 2011; 57: 891–903.
- 7.
Moon JC, Messroghli DR, Kellman P, Piechnik SK, Robson MD, Ugander M, et al. Myocardial T1 mapping and extracellular volume quantification: A Society for Cardiovascular Magnetic Resonance (SCMR) and CMR Working Group of the European Society of Cardiology consensus statement. J Cardiovasc Magn Reson 2013; 15: 92.
- 8.
Piechnik SK, Ferreira VM, Lewandowski AJ, Ntusi NA, Banerjee R, Holloway C, et al. Normal variation of magnetic resonance T1 relaxation times in the human population at 1.5 T using ShMOLLI. J Cardiovasc Magn Reson 2013; 15: 13.
- 9.
Coelho-Filho OR, Shah RV, Mitchell R, Neilan TG, Moreno H Jr, Simonson B, et al. Quantification of cardiomyocyte hypertrophy by cardiac magnetic resonance: Implications for early cardiac remodeling. Circulation 2013; 128: 1225–1233.
- 10.
Bull S, White SK, Piechnik SK, Flett AS, Ferreira VM, Loudon M, et al. Human non-contrast T1 values and correlation with histology in diffuse fibrosis. Heart 2013; 99: 932–937.
- 11.
Ferreira VM, Piechnik SK, Dall’Armellina E, Karamitsos TD, Francis JM, Choudhury RP, et al. Non-contrast T1-mapping detects acute myocardial edema with high diagnostic accuracy: A comparison to T2-weighted cardiovascular magnetic resonance. J Cardiovasc Magn Reson 2012; 14: 42.
- 12.
Karamitsos TD, Piechnik SK, Banypersad SM, Fontana M, Ntusi NB, Ferreira VM, et al. Noncontrast T1 mapping for the diagnosis of cardiac amyloidosis. JACC Cardiovasc Imaging 2013; 6: 488–497.
- 13.
Sado DM, White SK, Piechnik SK, Banypersad SM, Treibel T, Captur G, et al. Identification and assessment of Anderson-Fabry disease by cardiovascular magnetic resonance noncontrast myocardial T1 mapping. Circ Cardiovasc Imaging 2013; 6: 392–398.
- 14.
Sado DM, Maestrini V, Piechnik SK, Banypersad SM, White SK, Flett AS, et al. Noncontrast myocardial T1 mapping using cardiovascular magnetic resonance for iron overload. J Magn Reson Imaging
2014 August 8, doi:10.1002/jmri.24727.
- 15.
Pedersen SF, Thrysoe SA, Robich MP, Paaske WP, Ringgaard S, Botker HE, et al. Assessment of intramyocardial hemorrhage by T1-weighted cardiovascular magnetic resonance in reperfused acute myocardial infarction. J Cardiovasc Magn Reson 2012; 14: 59.
- 16.
Jellis CL, Kwon DH. Myocardial T1 mapping: Modalities and clinical applications. Cardiovasc Diagn Ther 2014; 4: 126–137.
- 17.
Rienks M, Papageorgiou AP, Frangogiannis NG, Heymans S. Myocardial extracellular matrix: An ever-changing and diverse entity. Circ Res 2014; 114: 872–888.
- 18.
Messroghli DR, Greiser A, Frohlich M, Dietz R, Schulz-Menger J. Optimization and validation of a fully-integrated pulse sequence for modified Look-Locker inversion-recovery (MOLLI) T1 mapping of the heart. J Magn Reson Imaging 2007; 26: 1081–1086.
- 19.
Chin CW, Semple S, Malley T, White AC, Mirsadraee S, Weale PJ, et al. Optimization and comparison of myocardial T1 techniques at 3T in patients with aortic stenosis. Eur Heart J Cardiovasc Imaging 2014; 15: 556–565.
- 20.
Flett AS, Sado DM, Quarta G, Mirabel M, Pellerin D, Herrey AS, et al. Diffuse myocardial fibrosis in severe aortic stenosis: An equilibrium contrast cardiovascular magnetic resonance study. Eur Heart J Cardiovasc Imaging 2012; 13: 819–826.
- 21.
White SK, Sado DM, Fontana M, Banypersad SM, Maestrini V, Flett AS, et al. T1 mapping for myocardial extracellular volume measurement by CMR: Bolus only versus primed infusion technique. JACC Cardiovasc Imaging 2013; 6: 955–962.
- 22.
Jerosch-Herold M, Sheridan DC, Kushner JD, Nauman D, Burgess D, Dutton D, et al. Cardiac magnetic resonance imaging of myocardial contrast uptake and blood flow in patients affected with idiopathic or familial dilated cardiomyopathy. Am J Physiol Heart Circ Physiol 2008; 295: H1234–H1242.
- 23.
Kellman P, Wilson JR, Xue H, Ugander M, Arai AE. Extracellular volume fraction mapping in the myocardium. Part 1: Evaluation of an automated method. J Cardiovasc Magn Reson 2012; 14: 63.
- 24.
Look DC, Locker DR. Time saving in measurement of NMR and EPR relaxation times. Rev Sci Instrum 1970; 41: 250–251.
- 25.
Messroghli DR, Radjenovic A, Kozerke S, Higgins DM, Sivananthan MU, Ridgway JP. Modified Look-Locker inversion recovery (MOLLI) for high-resolution T1 mapping of the heart. Magn Reson Med 2004; 52: 141–146.
- 26.
Piechnik SK, Ferreira VM, Dall’Armellina E, Cochlin LE, Greiser A, Neubauer S, et al. Shortened Modified Look-Locker Inversion recovery (ShMOLLI) for clinical myocardial T1-mapping at 1.5 and 3 T within a 9 heartbeat breathhold. J Cardiovasc Magn Reson 2010; 12: 69.
- 27.
Chow K, Flewitt JA, Green JD, Pagano JJ, Friedrich MG, Thompson RB. Saturation recovery single-shot acquisition (SASHA) for myocardial T(1) mapping. Magn Reson Med 2014; 71: 2082–2095.
- 28.
Weingartner S, Akcakaya M, Basha T, Kissinger KV, Goddu B, Berg S, et al. Combined saturation/inversion recovery sequences for improved evaluation of scar and diffuse fibrosis in patients with arrhythmia or heart rate variability. Magn Reson Med 2014; 71: 1024–1034.
- 29.
Higgins DM, Moon JC. Review of T1 mapping methods: Comparative effectiveness including reproducibility issues. Curr Cardiovasc Imaging Rep 2014; 7: 9252.
- 30.
Roujol S, Weingartner S, Foppa M, Chow K, Kawaji K, Ngo LH, et al. Accuracy, precision, and reproducibility of four T1 mapping sequences: A head-to-head comparison of MOLLI, ShMOLLI, SASHA, and SAPPHIRE. Radiology 2014; 272: 683–689.
- 31.
Kellman P, Hansen MS. T1-mapping in the heart: Accuracy and precision. J Cardiovasc Magn Reson 2014; 16: 2.
- 32.
Fontana M, White SK, Banypersad SM, Sado DM, Maestrini V, Flett AS, et al. Comparison of T1 mapping techniques for ECV quantification: Histological validation and reproducibility of ShMOLLI versus multibreath-hold T1 quantification equilibrium contrast CMR. J Cardiovasc Magn Reson 2012; 14: 88.
- 33.
Selvanayagam JB, Hawkins PN, Paul B, Myerson SG, Neubauer S. Evaluation and management of the cardiac amyloidosis. J Am Coll Cardiol 2007; 50: 2101–2110.
- 34.
Fontana M, Banypersad SM, Treibel TA, Maestrini V, Sado DM, White SK, et al. Native T1 mapping in transthyretin amyloidosis. JACC Cardiovasc Imaging 2014; 7: 157–165.
- 35.
Banypersad SM, Sado DM, Flett AS, Gibbs SD, Pinney JH, Maestrini V, et al. Quantification of myocardial extracellular volume fraction in systemic AL amyloidosis: An equilibrium contrast cardiovascular magnetic resonance study. Circ Cardiovasc Imaging 2013; 6: 34–39.
- 36.
Banypersad SM, Fontana M, Maestrini V, Sado DM, Captur G, Petrie A, et al. T1 mapping and survival in systemic light-chain amyloidosis. Eur Heart J 2015; 36: 244–251.
- 37.
Banypersad SM, Fontana M, Maestrini V, Sado D, White SK, Treibel TA, et al. Cardiac amyloid burden assessment by T1 mapping predicts survival in patients with systemic AL amyloidosis: A 2 year follow-up study. J Cardiovasc Magn Reson 2014; 16: O5.
- 38.
O’Mahony C, Elliott P. Anderson-Fabry disease and the heart. Prog Cardiovasc Dis 2010; 52: 326–335.
- 39.
Thompson RB, Chow K, Khan A, Chan A, Shanks M, Paterson I, et al. T(1) mapping with cardiovascular MRI is highly sensitive for Fabry disease independent of hypertrophy and sex. Circ Cardiovasc Imaging 2013; 6: 637–645.
- 40.
Pica S, Sado DM, Maestrini V, Fontana M, White SK, Treibel T, et al. Reproducibility of native myocardial T1 mapping in the assessment of Fabry disease and its role in early detection of cardiac involvement by cardiovascular magnetic resonance. J Cardiovasc Magn Reson 2014; 16: 99.
- 41.
Poggiali E, Cassinerio E, Zanaboni L, Cappellini MD. An update on iron chelation therapy. Blood Transfus 2012; 10: 411–422.
- 42.
Modell B, Khan M, Darlison M, Westwood MA, Ingram D, Pennell DJ. Improved survival of thalassaemia major in the UK and relation to T2* cardiovascular magnetic resonance. J Cardiovasc Magn Reson 2008; 10: 42.
- 43.
Dall’Armellina E, Karia N, Lindsay AC, Karamitsos TD, Ferreira V, Robson MD, et al. Dynamic changes of edema and late gadolinium enhancement after acute myocardial infarction and their relationship to functional recovery and salvage index. Circ Cardiovasc Imaging 2011; 4: 228–236.
- 44.
Chan W, Duffy SJ, White DA, Gao XM, Du XJ, Ellims AH, et al. Acute left ventricular remodeling following myocardial infarction: Coupling of regional healing with remote extracellular matrix expansion. JACC Cardiovasc Imaging 2012; 5: 884–893.
- 45.
Ugander M, Oki AJ, Hsu LY, Kellman P, Greiser A, Aletras AH, et al. Extracellular volume imaging by magnetic resonance imaging provides insights into overt and sub-clinical myocardial pathology. Eur Heart J 2012; 33: 1268–1278.
- 46.
Messroghli DR, Walters K, Plein S, Sparrow P, Friedrich MG, Ridgway JP, et al. Myocardial T1 mapping: Application to patients with acute and chronic myocardial infarction. Magn Reson Med 2007; 58: 34–40.
- 47.
Langhans B, Nadjiri J, Jahnichen C, Kastrati A, Martinoff S, Hadamitzky M. Reproducibility of area at risk assessment in acute myocardial infarction by T1- and T2-mapping sequences in cardiac magnetic resonance imaging in comparison to Tc99 m-sestamibi SPECT. Int J Cardiovasc Imaging 2014; 30: 1357–1363.
- 48.
Iles L, Pfluger H, Phrommintikul A, Cherayath J, Aksit P, Gupta SN, et al. Evaluation of diffuse myocardial fibrosis in heart failure with cardiac magnetic resonance contrast-enhanced T1 mapping. J Am Coll Cardiol 2008; 52: 1574–1580.
- 49.
Iles LM, Ellims AH, Llewellyn H, Hare JL, Kaye DM, McLean CA, et al. Histological validation of cardiac magnetic resonance analysis of regional and diffuse interstitial myocardial fibrosis. Eur Heart J Cardiovasc Imaging 2015; 16: 14–22.
- 50.
Su MY, Lin LY, Tseng YH, Chang CC, Wu CK, Lin JL, et al. CMR-verified diffuse myocardial fibrosis is associated with diastolic dysfunction in HFpEF. JACC Cardiovasc Imaging 2014; 7: 991–997.
- 51.
Mascherbauer J, Marzluf BA, Tufaro C, Pfaffenberger S, Graf A, Wexberg P, et al. Cardiac magnetic resonance postcontrast T1 time is associated with outcome in patients with heart failure and preserved ejection fraction. Circ Cardiovasc Imaging 2013; 6: 1056–1065.
- 52.
Wong TC, Piehler KM, Kang IA, Kadakkal A, Kellman P, Schwartzman DS, et al. Myocardial extracellular volume fraction quantified by cardiovascular magnetic resonance is increased in diabetes and associated with mortality and incident heart failure admission. Eur Heart J 2014; 35: 657–664.
- 53.
Vahanian A, Baumgartner H, Bax J, Butchart E, Dion R, Filippatos G, et al. Guidelines on the management of valvular heart disease: The Task Force on the Management of Valvular Heart Disease of the European Society of Cardiology. Eur Heart J 2007; 28: 230–268.
- 54.
Bonow RO, Carabello BA, Chatterjee K, de Leon AC Jr, Faxon DP, Freed MD, et al. 2008 focused update incorporated into the ACC/AHA 2006 guidelines for the management of patients with valvular heart disease: A report of the American College of Cardiology/American Heart Association Task Force on Practice Guidelines (Writing Committee to revise the 1998 guidelines for the management of patients with valvular heart disease). Endorsed by the Society of Cardiovascular Anesthesiologists, Society for Cardiovascular Angiography and Interventions, and Society of Thoracic Surgeons. J Am Coll Cardiol 2008; 52: e1–e142, doi:10.1016/j.jacc.2008.05.007.
- 55.
Taylor J. ESC/EACTS guidelines on the management of valvular heart disease. Eur Heart J 2012; 33: 2371–2372.
- 56.
Milano AD, Faggian G, Dodonov M, Golia G, Tomezzoli A, Bortolotti U, et al. Prognostic value of myocardial fibrosis in patients with severe aortic valve stenosis. J Thorac Cardiovasc Surg 2012; 144: 830–837.
- 57.
Shin S, Park PW, Han WS, Sung KI, Kim WS, Lee YT. Mass reduction and functional improvement of the left ventricle after aortic valve replacement for degenerative aortic stenosis. The Korean J Thorac Cardiovasc Surg 2011; 44: 399–405.
- 58.
Weidemann F, Herrmann S, Stork S, Niemann M, Frantz S, Lange V, et al. Impact of myocardial fibrosis in patients with symptomatic severe aortic stenosis. Circulation 2009; 120: 577–584.
- 59.
Lee SP, Lee W, Lee JM, Park EA, Kim HK, Kim YJ, et al. Assessment of diffuse myocardial fibrosis by using MR imaging in asymptomatic patients with aortic stenosis. Radiology 2015; 274: 359–369.
- 60.
Singh A, Ford I, Greenwood JP, Khan JN, Uddin A, Berry C, et al. Rationale and design of the PRognostic Importance of MIcrovascular Dysfunction in asymptomatic patients with Aortic Stenosis (PRIMID-AS): A multicentre observational study with blinded investigations. BMJ Open 2013; 3: e004348, doi:10.1136/bmjopen-2013-004348.
- 61.
Sibley CT, Noureldin RA, Gai N, Nacif MS, Liu S, Turkbey EB, et al. T1 Mapping in cardiomyopathy at cardiac MR: Comparison with endomyocardial biopsy. Radiology 2012; 265: 724–732.
- 62.
Dass S, Suttie JJ, Piechnik SK, Ferreira VM, Holloway CJ, Banerjee R, et al. Myocardial tissue characterization using magnetic resonance noncontrast T1 mapping in hypertrophic and dilated cardiomyopathy. Circ Cardiovasc Imaging 2012; 5: 726–733.
- 63.
Sado DM, Flett AS, Banypersad SM, White SK, Maestrini V, Quarta G, et al. Cardiovascular magnetic resonance measurement of myocardial extracellular volume in health and disease. Heart 2012; 98: 1436–1441.
- 64.
Puntmann VO, Voigt T, Chen Z, Mayr M, Karim R, Rhode K, et al. Native T1 mapping in differentiation of normal myocardium from diffuse disease in hypertrophic and dilated cardiomyopathy. JACC Cardiovasc Imaging 2013; 6: 475–484.
- 65.
Flett AS, Hayward MP, Ashworth MT, Hansen MS, Taylor AM, Elliott PM, et al. Equilibrium contrast cardiovascular magnetic resonance for the measurement of diffuse myocardial fibrosis: Preliminary validation in humans. Circulation 2010; 122: 138–144.
- 66.
Florian A, Ludwig A, Rosch S, Yildiz H, Sechtem U, Yilmaz A. Myocardial fibrosis imaging based on T1-mapping and extracellular volume fraction (ECV) measurement in muscular dystrophy patients: Diagnostic value compared with conventional late gadolinium enhancement (LGE) imaging. Eur Heart J Cardiovasc Imaging 2014; 15: 1004–1012.
- 67.
Vermes E, Pucheux J, Delhommais A, Alison D, Brunereau L. Cardiac magnetic resonance T1 mapping pre and post contrast in heart transplant patients with clinical antibody-mediated rejection: A preliminary experience. Journal of Cardiovascular Magnetic Resonance 2014; 16: P100.
- 68.
Edwards NC, Moody WE, Chue CD, Ferro CJ, Townend JN, Steeds RP. Defining the natural history of uremic cardiomyopathy in chronic kidney disease: The role of cardiovascular magnetic resonance. JACC Cardiovasc Imaging 2014; 7: 703–714.
- 69.
Thuny F, Lovric D, Schnell F, Bergerot C, Ernande L, Cottin V, et al. Quantification of myocardial extracellular volume fraction with cardiac MR imaging for early detection of left ventricle involvement in systemic sclerosis. Radiology 2014; 271: 373–380.
- 70.
Ntusi NA, Piechnik SK, Francis JM, Ferreira VM, Rai AB, Matthews PM, et al. Subclinical myocardial inflammation and diffuse fibrosis are common in systemic sclerosis: A clinical study using myocardial T1-mapping and extracellular volume quantification. J cardiovasc Magn Reson 2014; 16: 21.
- 71.
Puntmann VO, D’Cruz D, Smith Z, Pastor A, Choong P, Voigt T, et al. Native myocardial T1 mapping by cardiovascular magnetic resonance imaging in subclinical cardiomyopathy in patients with systemic lupus erythematosus. Circ Cardiovasc Imaging 2013; 6: 295–301.
- 72.
Friedrich MG, Marcotte F. Cardiac magnetic resonance assessment of myocarditis. Circ Cardiovasc Imaging 2013; 6: 833–839.
- 73.
Park CH, Choi EY, Greiser A, Paek MY, Hwang SH, Kim TH. Diagnosis of acute global myocarditis using cardiac MRI with quantitative T1 and T2 mapping: Case report and literature review. Korean J Radiol 2013; 14: 727–732.
- 74.
Verhaert D, Thavendiranathan P, Giri S, Mihai G, Rajagopalan S, Simonetti OP, et al. Direct T2 quantification of myocardial edema in acute ischemic injury. JACC Cardiovasc Imaging 2011; 4: 269–278.
- 75.
Ferreira VM, Piechnik SK, Dall’Armellina E, Karamitsos TD, Francis JM, Ntusi N, et al. T(1) mapping for the diagnosis of acute myocarditis using CMR: Comparison to T2-weighted and late gadolinium enhanced imaging. JACC Cardiovasc Imaging 2013; 6: 1048–1058.
- 76.
Luetkens JA, Doerner J, Thomas DK, Dabir D, Gieseke J, Sprinkart AM, et al. Acute myocarditis: Multiparametric cardiac MR imaging. Radiology 2014; 273: 383–392.
- 77.
Ferreira VM, Piechnik SK, Dall’Armellina E, Karamitsos TD, Francis JM, Ntusi N, et al. Native T1-mapping detects the location, extent and patterns of acute myocarditis without the need for gadolinium contrast agents. J Cardiovasc Magn Reson 2014; 16: 36.
- 78.
Burstein B, Nattel S. Atrial fibrosis: Mechanisms and clinical relevance in atrial fibrillation. J Am Coll Cardiol 2008; 51: 802–809.
- 79.
Beinart R, Khurram IM, Liu S, Yarmohammadi H, Halperin HR, Bluemke DA, et al. Cardiac magnetic resonance T1 mapping of left atrial myocardium. Heart Rhythm 2013; 10: 1325–1331.
- 80.
Ling LH, McLellan AJ, Taylor AJ, Iles LM, Ellims AH, Kumar S, et al. Magnetic resonance post-contrast T1 mapping in the human atrium: Validation and impact on clinical outcome following catheter ablation for atrial fibrillation. Heart Rhythm 2014; 11: 1551–1559.
- 81.
Ling LH, Kistler PM, Ellims AH, Iles LM, Lee G, Hughes GL, et al. Diffuse ventricular fibrosis in atrial fibrillation: Noninvasive evaluation and relationships with aging and systolic dysfunction. J Am Coll Cardiol 2012; 60: 2402–2408.
- 82.
Ling LH, Kalman JM, Ellims AH, Iles LM, Medi C, Sherratt C, et al. Diffuse ventricular fibrosis is a late outcome of tachycardia-mediated cardiomyopathy after successful ablation. Circ Arrhythm Electrophysiol 2013; 6: 697–704.