Abstract
Background:
Because the conventional evaluation of autonomic nervous system (ANS) function inevitably uses long-lasting uncomfortable electrocardiogram (ECG) recording, a more simplified and comfortable analysis system has been sought for this purpose. The feasibility of using a portable micro-electromechanical system (MEMS) blood flowmeter to analyze heart rate variability (HRV) for evaluating ANS function was thus examined.
Methods and Results:
Measurements of the R-R interval (TRR) derived from an ECG, simultaneously with the pulse wave interval (TPP) derived from a MEMS blood flowmeter, in 8 healthy subjects was performed and resultant HRV variables in time and frequency domains were compared. The TRR- and TPP-derived variables were strongly correlated (coefficients of regression for low frequency (LF), high frequency (HF), and LF/HF of 1.1, 0.66, and 0.35, respectively; corresponding coefficients of determination of 0.92, 0.63, and 0.91, respectively (P<0.01)). In addition, the values of LF, HF, and LF/HF, as analyzed using TPP, changed significantly from the supine to the standing position in another 6 subjects.
Conclusions:
Miniaturized-MEMS blood flowmetry can be used to perform HRV analysis for the evaluation of ANS function, which is as accurate as analysis based on ECG within comparable tolerances. As MEMS blood flowmetry can more easily and comfortably record physiological variables for longer durations than ECG recording, and can further capture skin blood flow information, this device has great potential to be used in a wider area of physiological analyses. (Circ J 2015; 79: 794–801)
The autonomic nervous system (ANS) plays key roles throughout the body, including the control of involuntary activities such as blood circulation, respiration, digestion, body temperature homeostasis, endocrine function, generative function, and metabolism. One example is the beating of the heart, which is influenced by autonomic inputs imparted upon the sinoatrial node to control heart rate. Fluctuation of cardiac rhythm is known as heart rate variability (HRV), and it reflects the physiological and pathological status of the cardiovascular ANS. Research into HRV began in dogs in 1981 using quantitative spectral analysis by Fast Fourier Transform, and it has since been studied in humans.1,2
The potential for measuring HRV easily and without any large equipment attracted much attention in the biomedical engineering fields in the 1990 s, and advances in wireless networks and miniaturization of biological sensors at that time made this technique more popular. As the ANS innervates many organs, symptoms of its dysfunction are observed in various diseases, and recordings of parameters controlled by the ANS may be useful for studying the occurrence, pathogenesis, response to treatment, and prognosis of a multitude of diseases. While many clinical applications of HRV analysis have been reported, it has been most accurately used as a clinical marker of diabetic neuropathy, a predictive factor for the risk of sudden cardiac death, and for risk stratification for the occurrence of arrhythmias after acute myocardial infarction.3
Moreover, it has been used to identify neurological diseases and to confirm the effects of treatment; it has also been used in the field of sports medicine.
However, the signs of autonomic dysfunction are difficult to observe in hospital settings compared with other health indices because it fluctuates based on circadian changes and reacts to temporal situations and environments; therefore, accurate evaluation is needed to collect data continuously throughout a subject’s daily activities. If health providers can access such data more easily, the medical service provided would undoubtedly be more efficacious.
The R-wave of the ECG has been mainly used in HRV analysis to assess autonomic function. However, accurate measurement using ECG leads sometimes becomes difficult due to unsatisfactory contact of the electrode or noise artifacts caused by body movement. Moreover, this means that patients might need to endure long periods of time with ECG leads attached.
We have recently developed a micro-integrated laser Doppler blood flowmeter (micro-electromechanical system (MEMS) blood flow sensor: approximately 70 ml and 65 g) that is 1/300th the volume of a conventional laser Doppler blood flowmeter.4,5
The weight of this sensor is approximately 1/30th and the power consumption is only 1/20th of a conventional instrument. The instrument is dramatically smaller than conventional instruments because it omits the optical fiber, which is the main source of noise in them, and therefore MEMS blood flowmetry would be ideal for the continuous measurement of blood flow over a long period of time. Moreover, because the changes in blood flow obtained by the MEMS blood flowmeter are caused as a result of summated alteration of skin sympathetic nervous system activity, blood pressure and body temperature, MEMS blood flowmetry has the potential to become an indicator of vital body systems; it might be widely applicable to the health-care field and various medical treatments.
The sharp R-wave obtained from ECG has been used for determining accurate heartbeat intervals in traditional HRV analysis.6
Yet, one of the possible problems in HRV analyses resides in the accuracy of the obtained R-R interval. As the waveform of blood flowmetry is basically a rounded shape without a sharp peak, it can be tricky to define the R-R interval precisely. Therefore, we sought to confirm the accuracy of HRV analysis using MEMS blood flowmetry as compared to ECG analysis; to this end, we attempted to analyze the relationship between the R-R interval (TRR) obtained from ECG readings and the pulse wave interval (TPP) obtained from a MEMS blood flowmeter (Figure 1). Additionally, participants were made to change posture in order to apply a physiological load to the body, allowing us to determine if we could detect changes in autonomic nervous function using MEMS blood flowmetry technology.
Methods
Subjects
The investigation complied with the ethical standards of the committee responsible for human experimentation of Kyushu University and with the Helsinki Declaration of 1964, as revised in 2008. A total of 14 healthy volunteers (13 males, 1 female; age range: 21–26 years) participated in this study. Among them, 8 male volunteers were used for the ECG/MEMS experiment (age range: 21–26 years) and the other 6 volunteers (5 males, 1 female; age range: 21–22 years) were used for the physiological load experiment.
MEMS Blood Flowmeter
The MEMS blood flowmeter, a non-invasive, ultra-compact (~70 ml), lightweight (~65 g) sensor, was used to estimate peripheral blood flow. It is a wearable sensor that is characterized by low power consumption and can operate wirelessly.
Structure
A schematic of the MEMS blood flowmeter is shown in
Figure 2. The MEMS blood flowmeter consists of a probe and a main body (Figure 2A). The sensor chip in the probe has a simple structure that consists of 2 crystal silicon substrates, a distributed feedback-laser diode (DFB-LD), and a photo diode (PD) (Figure 2B). One of the silicon substrates contains 2 square cavities that hold the bonded DFB-LD and PD, while the other contains a silicon microlens and a hole. Gold etched into the cavity leads the laser light from the DFB-LD into the microlens. Another silicon substrate is used to seal the cavity. The anti-reflective, coated microlens permits efficient light penetration.

Principle
The MEMS blood flow sensor is based on the principle of laser Doppler flowmetry.7,8
First, a laser is directed from the DFB-LD toward the skin. The scattered light from static tissues, such as the skin and blood vessels, and the Doppler-shifted scattered light from moving tissues, such as red blood cells, interfere with each other on the PD, creating a speckled pattern of light. The PD measures the visible pattern. Blood flow volume is then determined by analyzing a signal from the PD.
Experimental Method
Simultaneous measurements were performed by using a conventional ECG and MEMS blood flowmetry in 8 male volunteers to compare the TRR obtained from the ECG and the TPP from the MEMS blood flowmeter, which was attached to the right forefinger. Because the amount of peripheral blood flow differs according to recording location, we attached the flowmeter at the same place throughout each experiment. Furthermore, we fixed the MEMS blood flowmeter lightly with double-sided tape so that contact pressure did not change throughout the course of each experiment and also in order to prevent any noise caused by changes in contact pressure. The correlation between TRR and TPP was investigated by regression analysis of the TRR obtained by the simultaneous recording of 100 consecutive heartbeats while the subjects were kept in a sitting position. The correlation between the respective calculated ANS indices by both methods was also analyzed by regression analysis (details of index calculations are below). Then, a physiological load (change from a supine to a standing position9,10) was applied to the volunteers to investigate whether the ANS indices obtained from the TPP accurately reflected changes in intensity of the ANS activity. It is a physiological fact that as blood shifts to the lower extremities due to the influence of gravity by this postural change, the body enhances the sympathetic nervous system activity to maintain filling of the heart; thus, the ANS indices obtained from HRV was predicted to change. Measurements were continued over two 5-min periods while the subjects were in a supine position and in a standing position, respectively, with a 5-min break in between.
Data Analysis
The process of obtaining TPP is shown in
Figure 3. The pulse interval obtained from the detrended MEMS blood flowmetry was smoothed by the moving average method. As the first derivative of blood flow changes from positive to negative at the peak of the rising phase, the peak interval obtained by this method was set to the TPP (Figure 1). As high frequency vibrations caused by the accuracy of peak detection were observed in the TPP, smoothing by a moving average was performed. Correlation between the TRR and the TPP was investigated by regression analysis. The SDNN, which is the standard deviation of the normal-to-normal R-R intervals, and RMSSD, which is the root-mean square of successive differences between R-R intervals, were also investigated by regression analysis as indices in the time domain. Frequency analysis using the coarse-graining spectral analysis (CGSA) method was performed on TRR and TPP after third spline interpolation to obtain equidistant data.11

HRV accompanying blood pressure change is a fluctuation component known as the Mayer wave with a long, 10-s cycle that correlates with resonant time in the baroreflex circuit.12
As the distention of the lung baroreceptors during inspiration intensifies cardiac vagal activity through the cardiovascular center more than 9 times/min (>0.15 Hz), HRV that occurs at this frequency has been considered to reflect parasympathetic activity. These two indices are defined as follows:
· Low frequency component (LF)···0.04–0.15 Hz of power spectral density
· High frequency component (HF)···0.15–0.40 Hz of power spectral density
These were used to determine the intensity of relative sympathetic function by calculating the LF/HF ratio. From the power spectral density obtained from the TRR and TPP, the LF and HF, in addition to the LF/HF, were obtained.
One-sample t-testing was performed to investigate whether there was a statistically significant change in each of the ANS indices following postural change. The significance level was set to P<0.05. As the absolute change of each index due to a postural change was greatly different between individuals, data of the index after postural change was compared after normalization with indices before the postural changes set as 100.
Results
Figure 4
shows the correlation between the TRR from the ECG and the TPP from the MEMS blood flowmeter for each subject. The regression and the coefficient of determination obtained by regression analysis are also shown in each panel. For each subject, the coefficient of regression was 0.93, and the coefficient of intercept was 60, with the corresponding coefficients of determination being 0.79 (P<0.01).
Figure 5
shows the relationship between SDNN and RMSSD, obtained from TRR data and TPP data. The coefficients of regression for SDNN and RMSSD were 0.88 and 0.49, respectively; their coefficients of intercept were 7.3 and 22, respectively. The coefficients of determination for SDNN and RMSSD were 0.97 and 0.72, respectively (P<0.01).
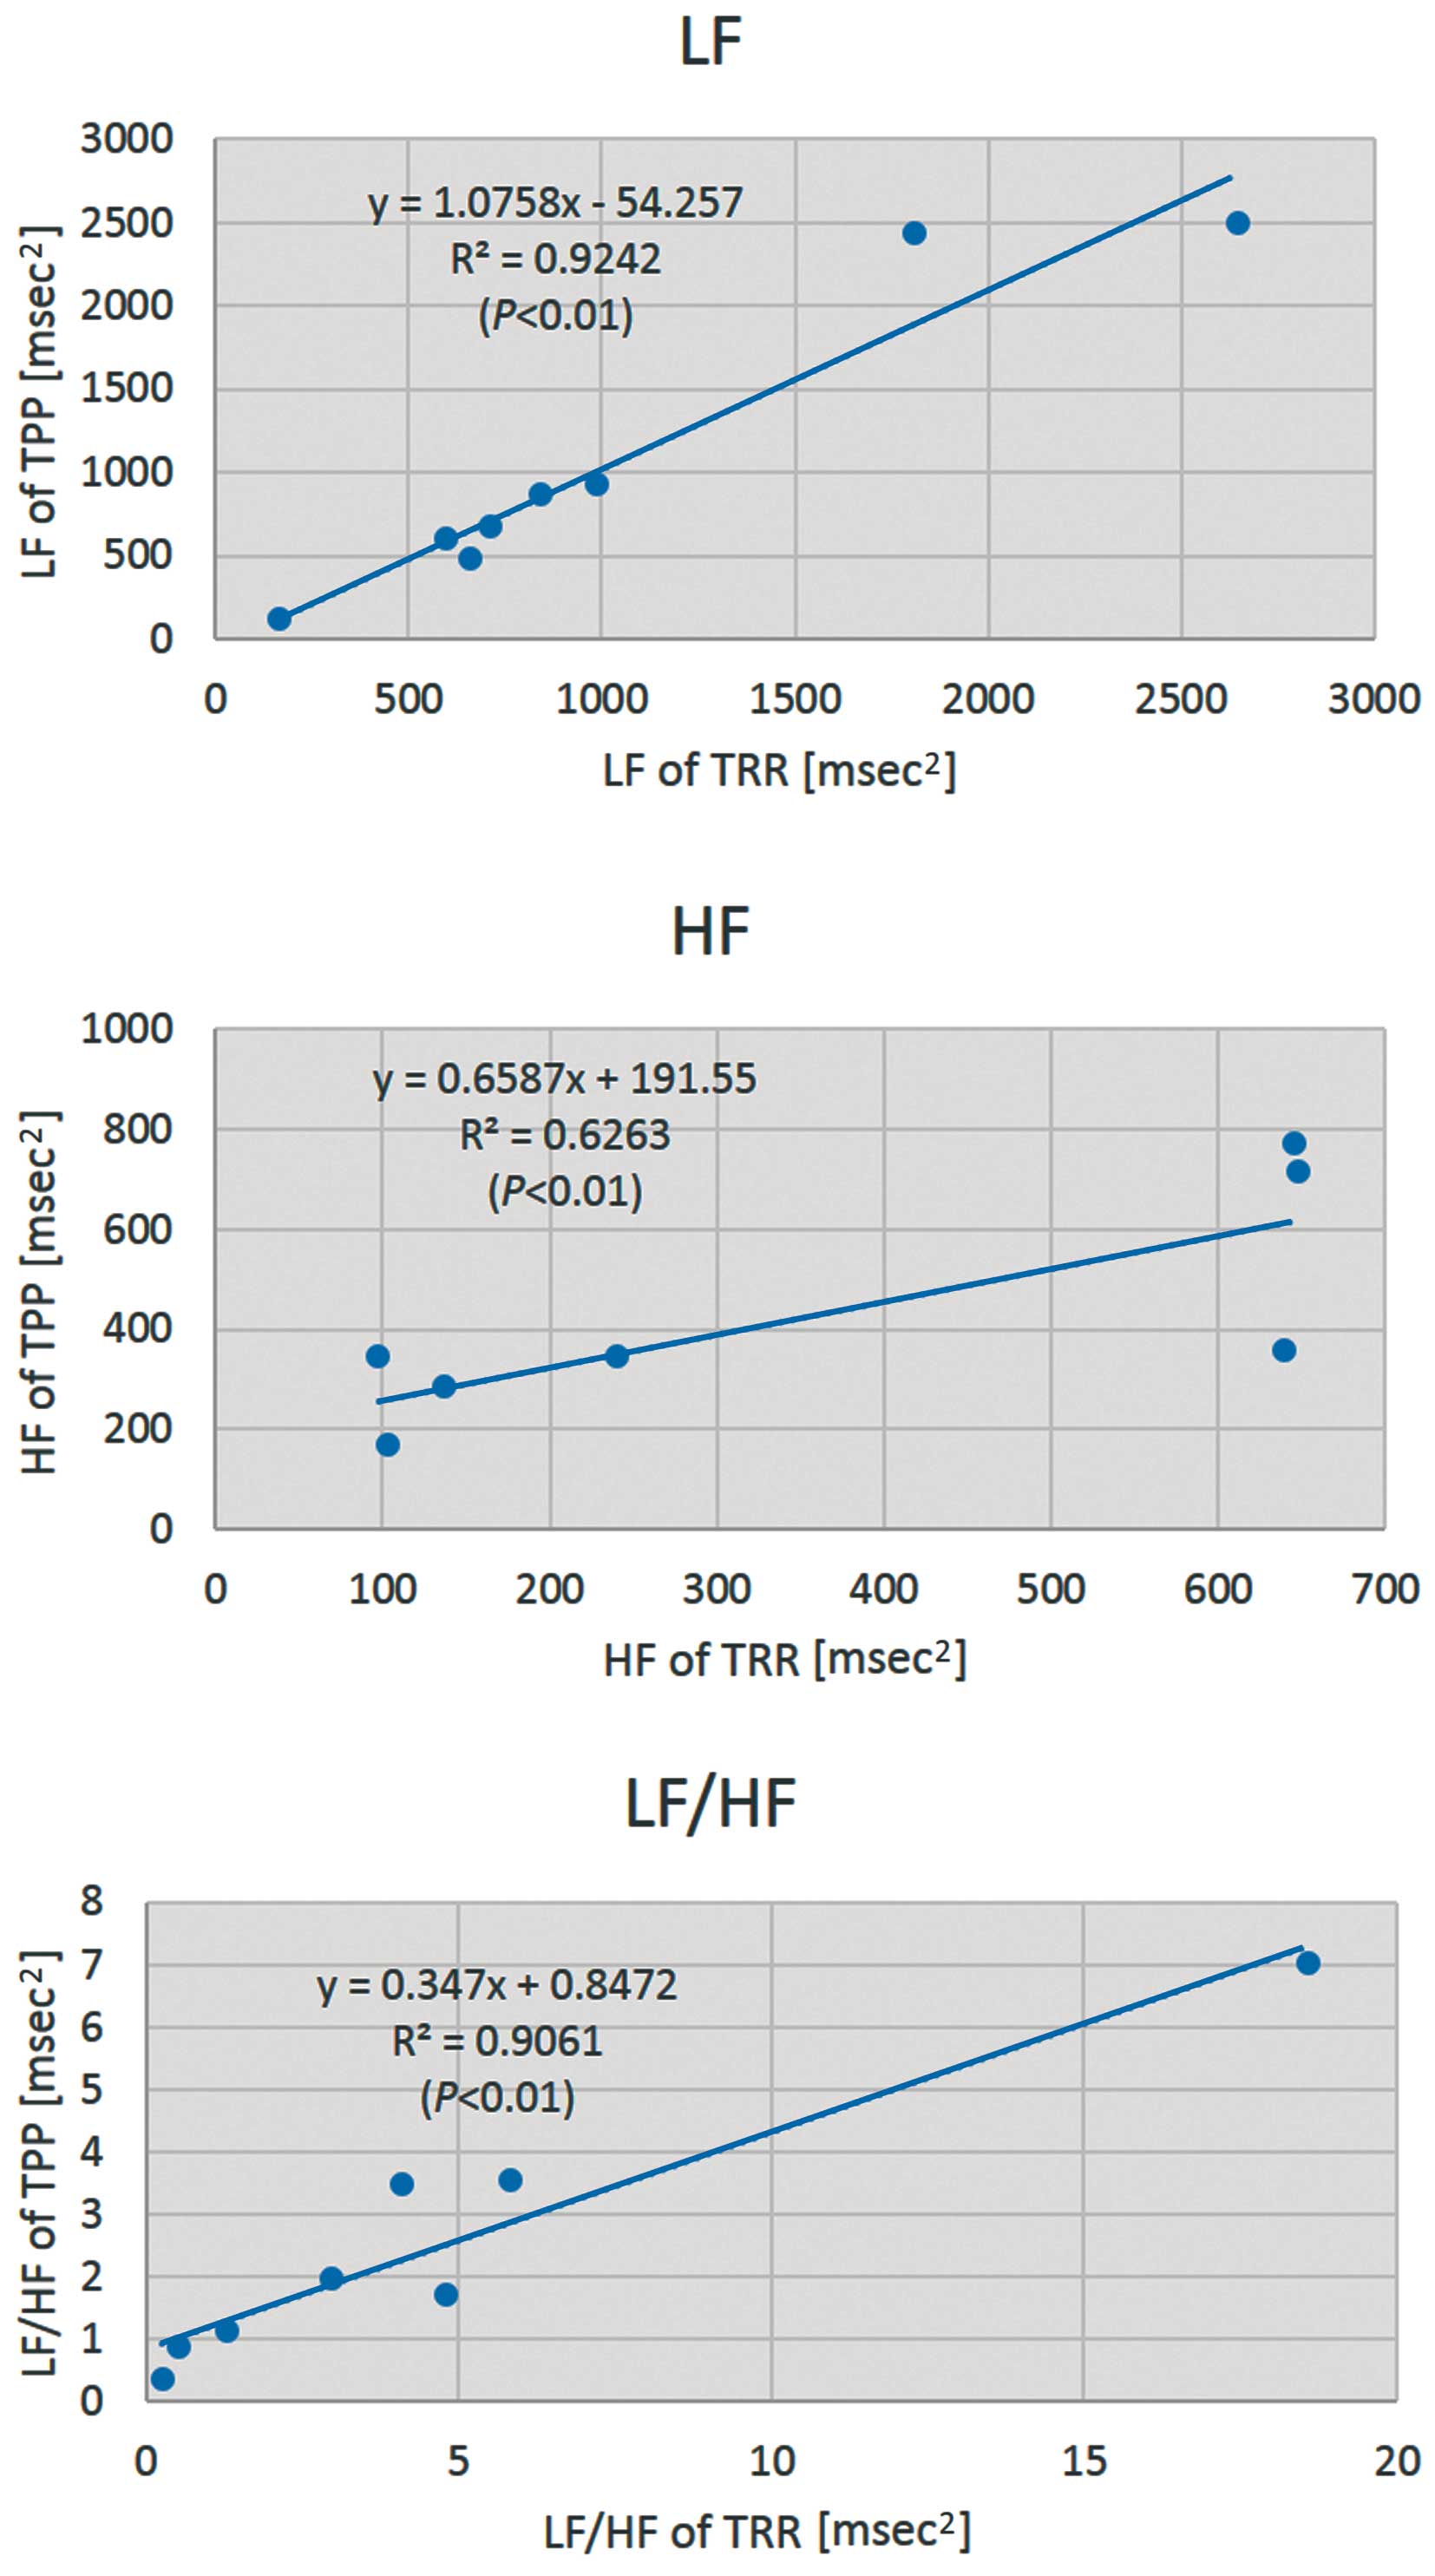
Figure 6
shows the relationship between LF, HF, and LF/HF, obtained using the CGSA method on TRR data and TPP data. The coefficients of regression for LF, HF, and LF/HF were 1.1, 0.66, and 0.35, respectively; the coefficients of intercept were −54, 190, and 0.85, respectively. The coefficients of determination for LF, HF, and LF/HF were 0.92, 0.62, and 0.91, respectively (P<0.01).
Figure 7
shows the alteration in heart rate, HF, and LF/HF caused by postural change from a supine to a standing position. After the postural change, all subjects showed a significant increase in heart rate and LF/HF, concomitant with a significant reduction in HF (P<0.05 each).
Discussion
In this study, we attempted to determine the feasibility of HRV analysis for TPP using the MEMS blood flowmeter. For this purpose, we used 2 different volunteer groups, including 8 subjects for the ECG/MEMS experiment and 6 subjects for the physiological load experiment, in order to obtain accurate results with a sample size that granted sufficient statistical power. As a consequence, the TPP R-R interval data showed comparable accuracy as similar to the TRR from the ECG, which is used as the gold standard. In addition, the indices of the HRV were also nearly identical to ECG-derived values. Furthermore, the changes of the HRV indices elicited by a postural change were reasonable.
Some other type of wearable, small and lightweight electrocardiography devices have appeared in recent years. Among them is the photoplethysmyogram of Lu et al,13
which is notable because, like the MEMS blood flow sensor, the pulse interval derived from it strongly correlates with the ECG-derived RR interval, and this type of device can be easily attached without any special training. However, the biggest comparative advantage of using a MEMS blood flow sensor in HRV analysis is its ability to obtain other data that is impossible for ECG to capture at the same time, namely the hemodynamic data. As human hemodynamics are strongly influenced by the ANS,14
evaluation of the ANS and hemodynamic responses using a MEMS blood flow sensor would be very useful to estimate over time. For example, in a previous study, we found our MEMS blood flow sensor could stably measure blood flow during exercise, and the derived hemodynamics well represented skin sympathetic activity and thermoregulation. Moreover, it could detect statistical significant reductions in average blood flow, pulse amplitude, and recovery gradient of blood flow during an arm raising test in subjects who were dehydrated by as little as 2% of their body weight.15
This type of analysis could be easily combined with analysis of ANS using HRV to give operators more comprehensive information about a subject’s physiological state.
Alteration of autonomic function caused by postural change from supine to standing is well-documented in the literature. It has been well recognized that the parasympathetic nervous system is suppressed by standing while the sympathetic nervous system is activated. All of our subjects experienced a significant increase in heart rate and LF/HF (reflecting the relative contribution of the sympathetic nervous system), and a significant decrease in HF (reflecting parasympathetic nervous system activity) after standing. From these data, we concluded that MEMS blood flowmetry has acceptable performance for HRV analysis in the evaluation of autonomic function. More detailed comparisons are necessary to compare these results with those from TRR data in the future.
We found that TPP data had some errors in comparison with TRR data. We consider that it might have occurred because TPP contains much more background noise than TRR from an ECG. This noise might primarily come from several sources before data were received by the detector: body movements, vasoconstriction and vasodilation due to sympathetic nerves in the skin, and metabolism within blood vessel endothelium. Furthermore, inaccurate peak detection from the round pulse waveform of the blood flow signal might have some influence on accurate peak detection and might become a source of some noise. However, we consider that the accuracy of peak detection can be improved by optimizing the contact pressure of a sensor. As for noise reduction, because this laser Doppler blood flowmeter can measure blood flow at most places within the body, we have already compared the blood flow data at the fingertip, forehead, and earlobe, including during exercise in past experiments (data not shown); we found that the most stable measurement of blood flow could be achieved at the forehead. As stable measurement is the most important part of this technique, the forehead may be the most suitable place to obtain measurements from, especially during exercise. However, for measurements in daily life, an earlobe would be a suitable alternative, as data obtained from this location has little trend change. Determining the optimal measurement locations for various purposes is an important topic to research in the future.
Although SDNN and RMSSD from TPP- and TRR-derived data showed good correlation, where TPP was small, RMSSD was two-fold larger when derived from TPP than when derived from TRR. We suppose that this phenomenon arose due to differences in the calculation method used: RMSSD is calculated from successive differences between individual data points, whereas SDNN is calculated in aggregate from all data in an observation region. Therefore, because RMSSD will be most accurate when peak detection has small relative error, the fact that relative error naturally increases when measuring smaller values was deemed responsible for this unusual increase.
Although LF, HF and LF/HF showed a good correlation between TPP- and TRR-derived data, the value of LF/HF was less than half of that from TPP. We believe that this was due to the difference in the noise levels in the HF and LF ranges; that is, when white noise is uniformly added to the entire frequency band, the HF power component, which comes from a much wider frequency range, must have been estimated as a large value compared with LF, resulting in a smaller LF/HF of the TPP value as compared with that of TRR.
Conclusions
The R-R interval data using TPP from MEMS blood flowmeter had comparable accuracy to data obtained from TRR from ECG recordings, and HRV indices from both techniques were almost identical. Furthermore, a reasonable change in HRV indices caused by a postural change was obtained. Hence, the evaluation of autonomic nervous function by HRV using a very small and simple system with an ECG component is feasible and furthermore, because this method can detect changes in skin blood flow, the wider application of MEMS blood flowmetry to many different fields can be expected.16–35
References
- 1.
Akselrod S, Gordon D, Ubel FA, Shannon DC, Berger AC, Cohen RJ. Power spectrum analysis of heart rate fluctuation: A quantitative probe of beat-to-beat cardiovascular control. Science 1981; 213: 220–222.
- 2.
Pomeranz B, Macaulay RJ, Caudill MA, Kutz I, Adam D, Gordon D, et al. Assessment of autonomic function in humans by heart rate spectral analysis. Am J Physiol 1985; 248(1 Pt 2): H151–H153.
- 3.
Stys A, Stys T. Current clinical applications of heart rate variability. Clin Cardiol 1998; 21: 719–724.
- 4.
Higurashi E, Sawada R, Ito T. An integrated laser blood flowmeter. J Lightwave Technol 2003; 21: 591–595.
- 5.
Kimura Y, Goma M, Onoe A, Higurashi E, Sawada R. Integrated laser Doppler blood flowmeter designed to enable wafer-level packaging. IEEE Trans Biomed Eng 2010; 57: 2026–2033.
- 6.
Takada M, Ebara T, Sakai Y. The acceleration plethysmography system as a new physiological technology for evaluating autonomic modulations. HEP 2008; 35: 373–377.
- 7.
Bonner R, Nossal R. Model for laser Doppler measurements of blood flow in tissue. Appl Opt 1981; 20: 2097–2107.
- 8.
Fredriksson I, Fors C, Johansson J. Laser Doppler flowmetry – a theoretical framework. Linköping: Department of Biomedical Engineering, Linköping University, 2007.
- 9.
Rowell LB. Human circulation: Regulation during physical stress. Oxford: University Press Oxford, 1986.
- 10.
Smith JJ. Circulatory response to the upright posture. United States: CRC Press, 1990.
- 11.
Yamamoto Y, Hughson RL. Coarse-graining spectral analysis: New method for studying heart rate variability. J Appl Physiol 1991; 71: 1143–1150.
- 12.
Penaz J. Mayer waves: History and methodology. Automedica 1978; 2: 135–142.
- 13.
Lu S, Zhao H, Ju K, Shin K, Lee M, Shelley K, et al. Can photoplethysmography variability serve as an alternative approach to obtain heart rate variability information? J Clin Monit Comput 2008; 22: 23–29.
- 14.
Soderstrom T, Stefanovska A, Veber M, Svensson H. Involvement of sympathetic nerve activity in skin blood flow oscillations in humans. Am J Physiol Heart Circ Physiol 2003; 284: H1638–H1646.
- 15.
Nogami H, Iwasaki W, Abe T, Kimura Y, Onoe A, Higurashi E, et al. Use of a simple arm-raising test with a portable laser Doppler blood flow meter to detect dehydration. Proc Inst Mech Eng Part H: J Eng Med 2011; 225: 411–419.
- 16.
Iwasaki W, Nogami H, Ito H, Gotanda T, Peng Y, Takeuchi S, et al. Useful method to monitor the physiological effects of alcohol ingestion by combination of micro-integrated laser Doppler blood flow meter and arm-raising test. Proc Inst Mech Eng Part H: J Eng Med 2012; 226: 759–765.
- 17.
Kainuma M, Furusyo N, Ando S, Mukae H, Ogawa E, Toyoda K, et al. Nocturnal difference in the ultra low frequency band of heart rate variability in patients stratified by Kampo medicine prescription. Circ J 2014; 78: 1924–1927.
- 18.
Watanabe S, Amiya E, Watanabe M, Takata M, Ozeki A, Watanabe A, et al. Simultaneous heart rate variability monitoring enhances the predictive value of flow-mediated dilation in ischemic heart disease. Circ J 2013; 77: 1018–1025.
- 19.
JCS Joint Working Group. Guidelines for clinical cardiac electrophysiologic studies (JCS 2011): Digest version. Circ J 2013; 77: 497–518.
- 20.
Ogata H, Fujimaru I, Yamada K, Kondo T. Suppression of cardiocirculatory responses to orthostatic stress by passive walking-like leg movement in healthy young men. J Physiol Anthropol 2012; 31: 24.
- 21.
Hess WR. Diencephalon, autonomic and extrapyramidal functions: Vol 3. New York: Grune & Stratton, 1954.
- 22.
Ohhashi T, Sakaguchi M, Tsuda T. Human perspiration measurement. Physiol Meas 1998; 19: 449–461.
- 23.
Homma S, Nakajima Y, Toma S, Ito T, Shibata T. Intracerebral source localization of mental process-related potentials elicited prior to mental sweating response in humans. Neurosci Lett 1998; 247: 25–28.
- 24.
Tanaka H, Yamaguchi H, Matushima R, Tamai H. Instantaneous orthostatic hypotension in children and adolescents: A new entity of orthostatic intolerance. Pediatr Res 1999; 46: 691–696.
- 25.
Wieling W. Standing, orthostatic stress, and autonomic function. Autonomic Failure, A textbook of clinical disorders of the autonomic nervous system, 2nd ed, Bannister R ed, Oxford University Press, Oxford, 1988; 308–320.
- 26.
American Autonomic Society. Consensus statement on the definition of orthostatic hypotension, pure autonomic failure and multiple system atrophy. Clin Auton Res 1996; 6: 125–126.
- 27.
Low PA, Opfer-Gehrking TL, Textor SC, Benarroch EE, Shen WK, Schondorf R, et al. Postural tachycardia syndrome (POTS). Neurology 1995; 45(4 Suppl 5): S19–S25.
- 28.
Wheeler T, Watkins PJ. Cardiac denervation in diabetes. Br Med J 1973; 4: 584–586.
- 29.
Oka H, Mochio S, Sato K, Sato H, Katayama K, Watanabe S, et al. Spectral analyses of RR interval and systolic blood pressure in diabetic autonomic neuropathy. J Auton Nerv Syst 1995; 52: 203–211.
- 30.
Bonner R, Clem T, Bowen P, Bowman R. Laser-Doppler continuous real-time monitor of pulsatile and mean blood flow in tissue microcirculation. Scattering techniques applied to supramolecular and nonequilibrium systems, Chen S, Chu B, Nossal R eds, Plenum Press, New York, 1981; 685–701.
- 31.
Kano T, Shimoda O, Higashi K, Sadanaga M, Sakamoto M. Fundamental patterns and characteristics of the laser-doppler skin blood flow waves recorded from the finger or toe. J Auton Nerv Syst 1993; 45: 191–199.
- 32.
Abe M, Ando Y, Higashi K, Kano T. Non-neurogenic periodic fluctuations in heart rate and vasomotion appearing in familial amyloid polyneuropathy (FAP) type I (Met30). J Auton Nerv Syst 1996; 60: 71–75.
- 33.
Ide J, Yamaga M, Kitamura T, Takagi K. Quantitative evaluation of sympathetic nervous system dysfunction in patients with reflex sympathetic dystrophy. J Hand Surg Br 1997; 22: 102–106.
- 34.
Ando Y, Araki S, Shimoda O, Kano T. Role of autonomic nerve functions in patients with familial amyloidotic polyneuropathy as analyzed by laser Doppler flowmetry, capsule hydrograph, and cardiographic R-R interval. Muscle Nerve 1992; 15: 507–512.
- 35.
Mano T. Sympathetic nerve mechanisms of human adaptation to environment – findings obtained by recent microneurographic studies. Environ Med 1990; 34: 1–35.