Abstract
Background:
Impaired glucose metabolism plays an important role in patients with acute myocardial infarction, but the clinical significance of glycemic variability (GV) early after the onset of ST-segment elevation myocardial infarction (STEMI) remains to be fully elucidated.
Methods and Results:
We prospectively investigated the clinical impact of GV, as determined by a continuous glucose monitoring system (CGMS), on left ventricular remodeling (LVR) assessed by cardiac magnetic resonance imaging (CMR) in 69 patients (63±13 years, 59 men) with a first reperfused STEMI within 12 h of onset. All patients were equipped with a CGMS when in a stable phase after admission and underwent repeat CMR at baseline and 7 months follow-up. Patients were divided into 2 groups according to the mean amplitude of glycemic excursions (MAGE). Patients in the upper tertile of MAGE were categorized as group High (H) and the other two-thirds as group Low (L). LVR was defined as an absolute increase in left ventricular end-diastolic volume index of ≥20%. LVR more frequently occurred in group H than in group L (56% vs. 11%, P<0.001). Multivariate analysis showed the higher MAGE group was an independent predictor of LVR in the chronic phase (odds ratio, 13.999; 95% confidence interval, 3.059 to 64.056; P=0.001).
Conclusions:
MAGE early after the onset of STEMI identified patients with LVR in the chronic phase. (Circ J 2015; 79: 1092–1099)
Coronary artery reperfusion is an established treatment for ST-segment elevation myocardial infarction (STEMI); however, some patients have either large infarct or left ventricular remodeling (LVR), both of which lead to a poor outcome accompanied by heart failure even after successful early reperfusion. Impaired glucose metabolism is also associated with heart failure1
and is a predictor of poor outcome in patients with acute myocardial infarction (AMI).2
The fasting glucose level,3
a higher glucose level on admission,4
and hypoglycemia on admission5
are established markers of short-term poor prognoses. Moreover, sustained hyperglycemia accompanied by a higher level of glycosylated hemoglobin A1c
(HbA1c)6
is an established marker of long-term poor prognosis. Because these prognostic markers are measured at only 1 time point, the measurement of glycemic variability (GV) may have specific clinical implications different from the other markers in patients with cardiovascular diseases.7
Continuous glucose monitoring system (CGMS) is an emerging technology that can continuously measure interstitial glucose levels to accurately evaluate GV.8
Cardiac magnetic resonance imaging (CMR) is considered the gold standard for evaluating volumetric parameters, infarct size, and myocardial salvage.9,10
In the present study, we prospectively investigated the clinical impact of GV, as determined by CGMS, on infarct size and LVR at 7 months as assessed by CMR in patients with a first STEMI.
Editorial p 972
Methods
Patients
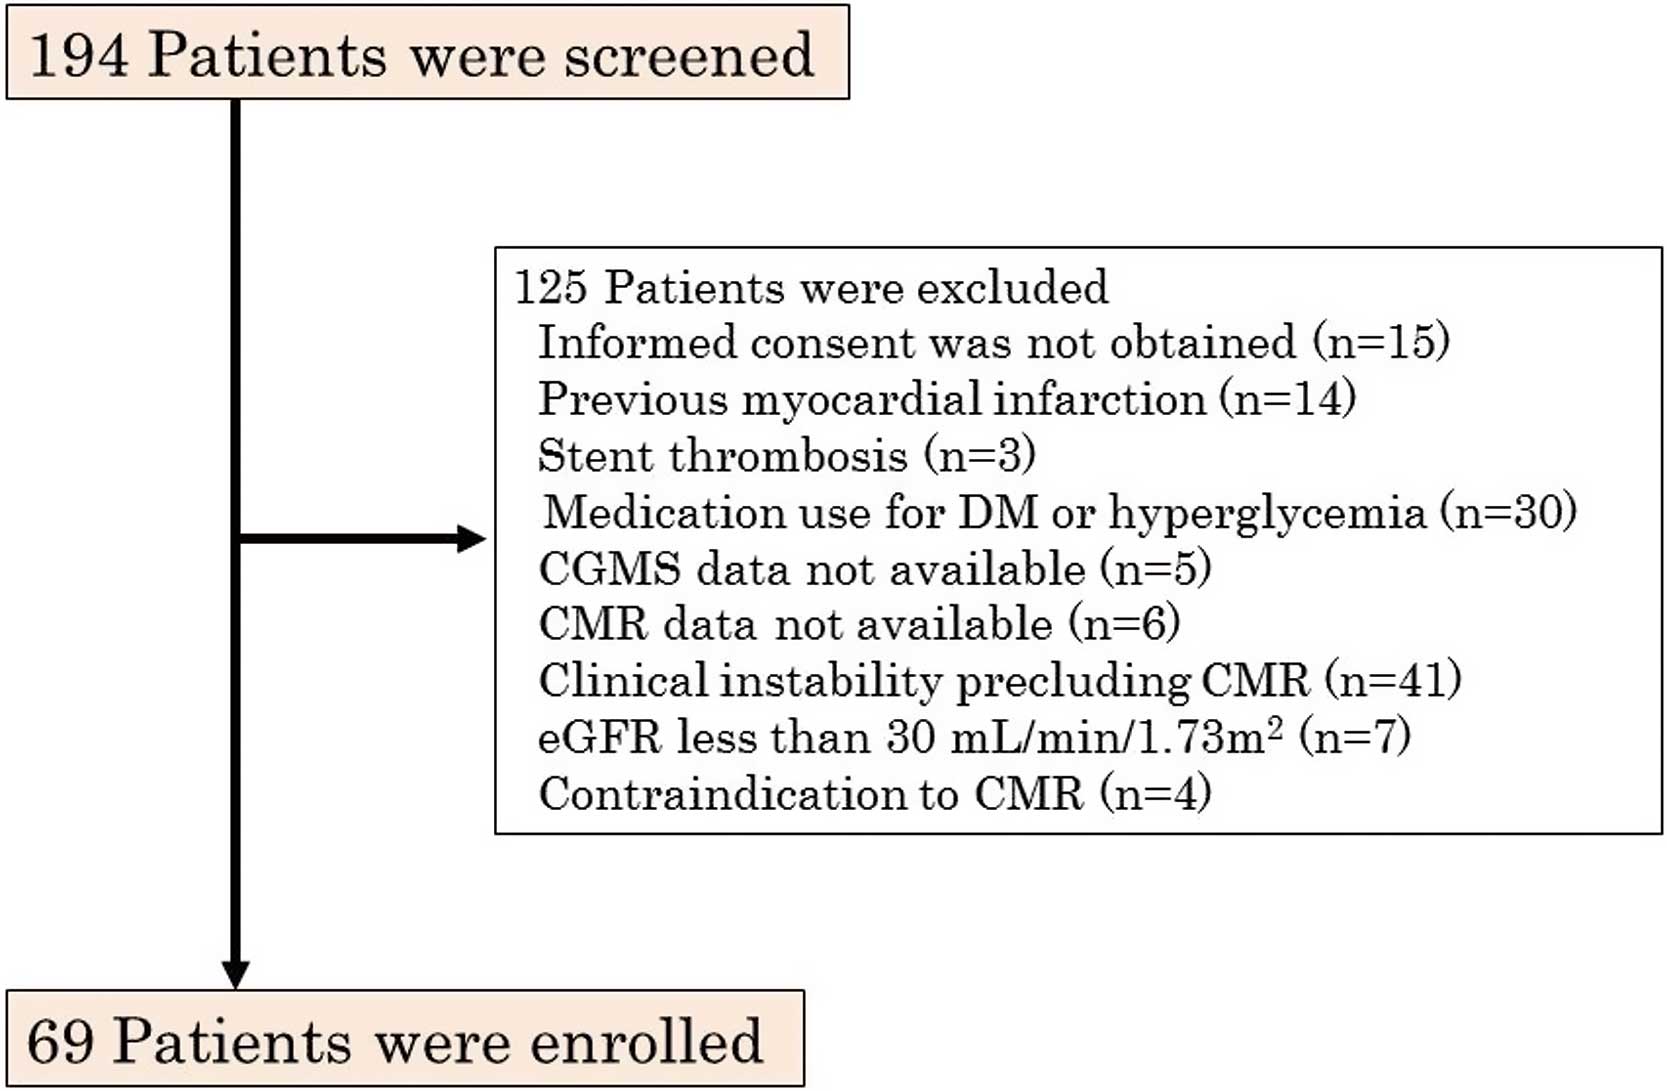
In Yokohama City University Medical Center from April 2012 through April 2014, we screened 194 consecutive patients with a first STEMI who were reperfused within 12 h of symptom onset. STEMI was defined as chest pain lasting for at least 30 min accompanied by ST-segment elevation and an increase in the serum creatine phosphokinase (CPK) level to more than twice the upper limit of normal. The following criteria were used to define ST-segment elevation: new ST elevation at the J point in at least 2 contiguous leads of 2 mm in men or 1.5 mm in women in leads V2–3, or of 1 mm in other leads, or both. New left bundle-branch block has been considered equivalent to STEMI. We excluded patients fulfilling any of the following criteria: informed consent was not obtained, previous MI, previous coronary artery bypass operation, stent thrombosis, medication use for diabetes mellitus (DM) or hyperglycemia, CGMS or CMR data not available, clinical instability precluding CMR, estimated glomerular filtration rate (eGFR) less than 30 ml/min/1.73 m2, or a contraindication to CMR. A total of 69 patients met the eligibility criteria and were enrolled (Figure 1). After admission, 5,000 U of heparin was given. All patients received aspirin (200-mg loading dose, followed by 100 mg/day) and clopidogrel (300-mg loading dose, followed by 75 mg/day). Glycoprotein IIb/IIIa inhibitors were not used because they have not been approved in Japan. All patients had a final Thrombolysis in Myocardial Infarction (TIMI) flow grade of 2 or 3. The study protocol was approved by the Yokohama City University Medical Center Institutional Review Board, and all patients gave written informed consent (UMIN-CTR ID: UMIN000012027).
Biochemical parameters, including CPK, creatine kinase MB (CK-MB), and high-sensitivity C-reactive protein (hs-CRP), were evaluated on admission and at 3-h intervals during the first 24 h, at 6-h intervals for the next 2 days, and then daily until discharge. HbA1c
levels were evaluated on admission and at 7 months. Levels of norepinephrine, eGFR, low-density lipoprotein (LDL) cholesterol, high-density lipoprotein (HDL) cholesterol and triglycerides were evaluated on admission. Brain natriuretic peptide (BNP) was evaluated on admission, 6 h after admission, daily until discharge, and at 7 months.
CGMS Protocol
All patients were equipped with a CGMS (iPro2, Medtronic, Minneapolis, MN, USA) when in a stable phase after admission and were monitored for at least 24 consecutive hours. The CGMS sensor was inserted into subcutaneous abdominal fat tissue. During CGMS monitoring, the patient’s blood glucose levels were checked at least 4 times per day with a self-monitoring of blood glucose (SMBG) device (Medisafe Mini, Terumo, Japan) to calibrate the CGMS data. We excluded patients with medication use for DM or hyperglycemia to eliminate the effect of medications on GV; therefore, none of the study patients used antidiabetic medications (including insulin) before admission, during hospitalization, or from discharge to 7-month follow-up. The data obtained by CGMS were recorded and analyzed off-line (Figure 2). Analysis was performed on a 24-h period of monitoring including 3 regular meals in the most stable phase with regard to the patient’s condition, as interpreted by 2 experienced observers (we used 24-h period of 11±6 days for analysis). The mean amplitude of glycemic excursions (MAGE) was calculated by measuring the arithmetic mean of the differences between consecutive peaks and nadirs if the differences were greater than 1 standard deviation (SD) of the mean glucose value.11
We divided 69 patients into tertiles according to MAGE level. Patients in the upper tertile of MAGE were categorized as group High (H) and the other two-thirds as group Low (L).

All patients who had not been given a diagnosis of DM underwent a standard 75-g OGTT between the 4th day and discharge, when their condition had stabilized. After an overnight fast, venous blood samples for the measurement of plasma glucose levels were taken at baseline and 30, 60 and 120 min after the glucose load. DM, impaired glucose tolerance, and normal glucose tolerance were classified according to the American Diabetes Association criteria.12
CMR Protocol
All patients underwent early CMR on day 9±4 as a baseline using a 1.5-T CMR system with an 8-element phased-array cardiac coil (MAGNETOM Avanto, Siemens Medical Solutions, Inc, Erlangen, Germany). After scout imaging, cine true fast imaging with steady precession (True-FISP) sequences were obtained. Cine images were acquired in 6–8 short-axis views and typical parameters were as follows: TR 39.2 ms, TE 1.94 ms, FA 80°, 10-mm slice thickness, matrix 115×256, and FOV 340×340 mm. At 10–15 min after infusion of 0.1 mmol/kg gadolinium-diethylenetriamine pentaacetic acid (Gd-DTPA) (Magnevist, Bayer Schering Pharma, Berlin, Germany), late gadolinium enhancement (LGE) images were acquired using a phase-sensitive inversion recovery method in 6–8 short-axis views and typical parameters were as follows: TR 943.2 ms, TE 1.33 ms, FA 40°, 10-mm slice thickness, matrix 123×192, and FOV 311.7×340 mm. All images were acquired during breath-holding at end expiration.
CMR Analysis
All CMR images were independently interpreted by 2 experienced observers using Q-MASS MR 7.5 (Medis, Leiden, the Netherlands) and blinded to the angiographic and clinical data. After review of the cine images, left ventricular (LV) volumes (end-diastolic volume index, EDVI; end-systolic volume index), ejection fraction (EF), and LV cardiac index (CI) were calculated by manually tracing the LV endocardial and epicardial borders on the short-axis images at end-diastole and end-systole. This manual tracing was also performed on the LGE images. Next, the myocardial segment containing the region of high signal intensity (SI) myocardium was outlined, and the maximum SI within this region was determined. A region of interest was then placed at the remote non-infarcted myocardium with uniform myocardial suppression. We used the full-width at half-maximum method to define the infarct core (Core).13
The Core was defined as myocardium with an SI equivalent to >50% of the maximal SI. Microvascular obstruction was defined as a dark area within the hyperenhanced area on LGE images and considered to belong to the Core. The infarct size was defined as the extent of Core. All measurements were calculated by the planimetric method and expressed as grams of myocardium. The values were normalized to LV mass and represented as % of LV mass.
Patient Follow-up
All patients underwent late CMR at 7±1 months according to the same protocol. We defined LVR as an absolute increase in the late CMR-derived LVEDVI of at least 20% as compared with the early CMR-derived LVEDVI.14
Statistical Analysis
Continuous variables are expressed as mean±SD. Student’s t-test was used to compare differences in continuous variables among groups. For categorical variables, Fisher’s exact test or chi-square test was used. Comparisons of continuous variables among 3 or more groups were performed by one-way analysis of variance (ANOVA), followed by post-hoc comparisons (Tukey HSD test, Games-Howell test).
First, a univariate linear regression analysis for the prediction of the extent of Core was performed. All baseline characteristics (age, sex, body mass index, Killip class >1, pre-infarct angina, symptom onset to reperfusion time, infarct-related artery, number of diseased vessels, initial TIMI flow grade >1, final TIMI flow grade 3, hypertension, dyslipidemia, DM, medication on discharge), MAGE, and laboratory data (glucose on admission, fasting glucose, HbA1c
on admission, LDL cholesterol, HDL cholesterol, triglycerides, admission BNP, admission hs-CRP, norepinephrine on admission, eGFR) were included as univariate variables. Variables entered a stepwise multivariate model if P<0.1 on the univariate linear regression analysis.
Second, a univariate logistic regression analysis for the prediction of LVR was performed. All baseline characteristics (age, sex, body mass index, Killip class >1, pre-infarct angina, symptom onset to reperfusion time, infarct-related artery, number of diseased vessels, initial TIMI flow grade >1, final TIMI flow grade 3, hypertension, dyslipidemia, DM, medication on discharge), group H, laboratory data (glucose on admission, fasting glucose, HbA1c
on admission, HbA1c
at 7 months, LDL cholesterol, HDL cholesterol, triglycerides, admission BNP, peak BNP, BNP at 7 months, admission hs-CRP, peak hs-CRP, norepinephrine on admission, eGFR), and early CMR parameters (LVEF, LVCI, the extent of Core) were included as univariate variables. Because we used the extent of Core as the infarct size, peak CPK and peak CK-MB were not included. In addition, LVEDVI, which was the direct constituent of LVR, was not included. We built a multivariate logistic regression model with variables that were P<0.1 on the univariate logistic regression analysis and forced inclusion variables that were considered as important predictors of LVR (culprit left anterior descending coronary artery (LAD),15
the extent of Core,15,16 and peak hs-CRP17) (model 1). Next we built a multivariate logistic regression model with forced inclusion variables (HbA1c
on admission, glucose on admission, group H) to assess the meaning of GV (model 2). All statistical tests were 2 tailed, and P<0.05 was considered to indicate statistical significance. Inter- and intraobserver variabilities were expressed by calculating an intraclass correlation coefficient (ICC) and a variation coefficient. The variation coefficient was calculated as the absolute difference between 2 measurements divided by the average of the 2 measurements as a percentage. SPSS version 18.0 (SPSS Japan Inc, Tokyo, Japan) was used for all statistical analyses.
Results
Baseline Characteristics
The baseline characteristics are shown in
Table 1. The mean age was 63±13 years. The mean time from symptom onset to reperfusion was 3.5±2.4 h. There were no significant baseline differences on admission between groups L and H except for glucose metabolism markers (Tables 1,2). Glucose values from CGMS and SMBG are shown in
Table 2. Mean glucose levels were nearly equal between CGMS and SMBG, but the maximum and minimum glucose levels were not, which showed the importance of CGMS to accurately evaluate GV.
Table 1.
Baseline Characteristics of the Patients Enrolled in a Study of GV After First STEMI
| Variable |
All patients
(n=69) |
Group L
(n=46) |
Group H
(n=23) |
P value |
| Age, years |
63±13 |
61±12 |
66±14 |
0.16 |
| Male, n (%) |
59 (86) |
39 (85) |
20 (87) |
0.56 |
| Body mass index, kg/m2 |
26±4 |
26±4 |
25±4 |
0.71 |
| Killip class >1, n (%) |
8 (12) |
3 (7) |
5 (22) |
0.08 |
| Pre-infarct angina, n (%) |
37 (54) |
24 (52) |
13 (57) |
0.73 |
| Symptom onset to reperfusion time, h |
3.5±2.4 |
3.4±2.4 |
3.6±2.5 |
0.82 |
| Infarct-related artery, n (%) |
|
|
|
0.36 |
| LAD |
35 (51) |
26 (56) |
9 (39) |
|
| Right coronary artery |
28 (40) |
16 (35) |
12 (52) |
|
| Left circumflex coronary artery |
6 (9) |
4 (9) |
2 (9) |
|
| No. of diseased vessels, n (%) |
|
|
|
0.60 |
| 1 |
53 (77) |
37 (80) |
16 (70) |
|
| 2 |
9 (13) |
5 (11) |
4 (17) |
|
| 3 |
7 (10) |
4 (9) |
3 (13) |
|
| Initial TIMI flow grade >1, n (%) |
8 (12) |
6 (13) |
2 (9) |
0.46 |
| Final TIMI flow grade 3, n (%) |
64 (93) |
41 (89) |
23 (100) |
0.12 |
| Hypertension, n (%) |
36 (52) |
21 (46) |
15 (65) |
0.13 |
| Lipid profile on admission |
| LDL cholesterol, mg/dl |
136±35 |
135±38 |
136±30 |
0.93 |
| HDL cholesterol, mg/dl |
42±11 |
40±9 |
45±12 |
0.10 |
| Triglycerides, mg/dl |
142±122 |
143±115 |
140±136 |
0.92 |
| Laboratory data |
| Peak CPK, IU/L |
2,841±2,271 |
2,751±2,128 |
3,021±2,576 |
0.65 |
| Peak CK-MB, IU/L |
250±231 |
237±223 |
277±249 |
0.49 |
| Admission BNP, pg/ml |
47±49 |
50±55 |
40±33 |
0.43 |
| Peak BNP, pg/ml |
213±151 |
202±139 |
234±173 |
0.40 |
| BNP at 7 months, pg/ml |
54±44 |
44±34 |
74±55 |
0.02 |
| Admission hs-CRP, mg/dl |
0.3±0.5 |
0.3±0.6 |
0.2±0.1 |
0.25 |
| Peak hs-CRP, mg/dl |
7.8±3.9 |
7.7±3.8 |
7.9±4.0 |
0.90 |
| Norepinephrine on admission, pg/ml |
683±544 |
633±309 |
788±852 |
0.43 |
| eGFR, ml/min/1.73 m2 |
71±21 |
71±19 |
72±25 |
0.76 |
| Medications on discharge, n (%) |
| Aspirin |
67 (97) |
44 (96) |
23 (100) |
0.44 |
| β-blocker |
45 (65) |
29 (63) |
16 (70) |
0.59 |
| ACEI or ARB |
63 (91) |
43 (93) |
20 (87) |
0.31 |
| Statin |
65 (94) |
43 (93) |
22 (97) |
0.59 |
ACEI, angiotensin-converting enzyme-inhibitors; ARB, angiotensin II receptor blockers; BNP, B-type natriuretic peptide; CK-MB, creatine phosphokinase MB; CPK, creatine phosphokinase; GV, glycemic variability; hs-CRP, high-sensitivity C-reactive protein; peak hs-CRP, peak hs-CRP during hospitalization; eGFR, estimated glomerular filtration rate; HDL, high-density lipoprotein; LAD, left anterior descending coronary artery; LDL, low-density lipoprotein; Peak BNP, peak BNP during hospitalization; STEMI, ST-segment elevation myocardial infarction; TIMI, Thrombolysis in Myocardial Infarction.
Table 2.
Glucose Metabolism in Patients Enrolled in a Study of GV After First STEMI
| Variable |
All patients
(n=69) |
Group L
(n=46) |
Group H
(n=23) |
P value |
| Glucose metabolism, n (%) |
|
|
|
0.10 |
| Diabetes mellitus |
14 (20) |
6 (13) |
8 (35) |
|
| Impaired glucose tolerance |
39 (57) |
29 (63) |
10 (43) |
|
| Normal glucose tolerance |
16 (23) |
11 (24) |
5 (22) |
|
| Glucose on admission, mg/dl |
158±47 |
153±43 |
169±53 |
0.18 |
| Fasting glucose, mg/dl |
101±9 |
99±8 |
105±11 |
0.02 |
| HbA1c on admission, % |
5.8±0.5 |
5.8±0.4 |
5.9±0.6 |
0.30 |
| HbA1c at 7 months, % |
5.9±0.5 |
5.9±0.5 |
6.0±0.5 |
0.42 |
| CGMS findings |
| MAGE, mg/dl |
39±17 |
28±8 |
59±9 |
<0.01 |
| Mean glucose level, mg/dl |
113±16 |
108±10 |
124±19 |
<0.01 |
| Max. glucose level, mg/dl |
159±30 |
143±16 |
190±27 |
<0.01 |
| Min. glucose level, mg/dl |
86±14 |
84±10 |
92±18 |
0.06 |
| SMBG findings |
| Mean glucose level, mg/dl |
112±15 |
107±10 |
121±19 |
<0.01 |
| Max. glucose level, mg/dl |
134±24 |
125±17 |
150±27 |
<0.01 |
| Min. glucose level, mg/dl |
95±12 |
92±9 |
100±16 |
0.01 |
CGMS, continuous glucose monitoring system; HbA1c, glycosylated hemoglobin A1c; MAGE, mean amplitude of glycemic excursions; SMBG, self-monitoring of blood glucose. Other abbreviations as in Table 1.
The CMR characteristics are shown in
Table 3. Volumetric parameters and the extent of Core were calculated in all patients. Inter- and intraobserver variabilities of the extent of Core were expressed by calculating ICCs and variation coefficients. ICCs approximated 0.9, and variation coefficients were within 10%. Of all 69 patients, LVR was observed in 18 patients (26%).
Table 3.
CMR Findings in Patients Enrolled in a Study of GV After First STEMI
| Variable |
All patients
(n=69) |
Group L
(n=46) |
Group H
(n=23) |
P value |
| CMR at baseline (early CMR) |
| LVEF, % |
46±11 |
46±10 |
47±11 |
0.62 |
| LVEDVI, ml/m2 |
78±20 |
79±18 |
75±25 |
0.43 |
| LVCI, L·min−1·m−2 |
2.5±0.7 |
2.5±0.6 |
2.5±0.8 |
0.95 |
| CMR at 7 months (late CMR) |
| LVEF, % |
47±9 |
47±8 |
48±11 |
0.77 |
| LVEDVI, ml/m2 |
80±20 |
77±17 |
85±24 |
0.08 |
| LVCI, L·min−1·m−2 |
2.6±0.6 |
2.6±0.6 |
2.6±0.7 |
0.70 |
| % ΔLVEDVI |
4.1±18.4 |
−1.6±17.8 |
15.6±14.0 |
<0.001 |
CI, cardiac index; CMR, cardiac magnetic resonance imaging; EDVI, end-diastolic volume index; EF, ejection fraction; LV, left ventricular; % ΔLVEDVI, percentage of an absolute increase in the late CMR-derived LVEDVI as compared with the early CMR-derived LVEDVI. Other abbreviations as in Table 1.
Effect of MAGE on Infarct Size
Univariate analysis showed that predictors of the extent of Core were culprit LAD, and the HDL cholesterol level (all P<0.05) (Table 4). On the stepwise multivariate linear regression analysis, the predictor of the extent of Core was culprit LAD (β coefficient: 8.787, P<0.001) (Table 4). MAGE level was not a predictor of the extent of Core. There was no significant difference between group L and group H in regard to the mean extent of Core (P=0.518) (Figure 3A).
Table 4.
Univariate and Stepwise Multivariate Linear Regression Analyses for the Prediction of the Extent of the Infarct Core in Patients Enrolled in a Study of GV After First STEMI
| Variable |
Univariate |
Multivariate |
| B |
95% CI for β |
P value |
B |
95% CI for β |
P value |
| Culprit LAD |
8.787 |
4.423 to 13.152 |
<0.001 |
8.787 |
4.423 to 13.152 |
<0.001 |
| Initial TIMI flow grade >1 |
7.326 |
−0.054 to 14.705 |
0.052 |
|
|
0.070 |
| HDL cholesterol, per 1 mg/dl |
0.235 |
0.009 to 0.461 |
0.041 |
|
|
0.344 |
Only univariate variables with a value of P<0.1 are shown. 95% CI, 95% confidence interval. Other abbreviations as in Table 1.

Effect of MAGE on LVR
Although there was no significant difference between group L and group H in regard to HbA1c
levels on admission and at 7 months (Table 2), LVR occurred more frequently in group H than in group L (56% vs. 11%, P<0.001) (Figure 3B). Despite no significant difference between the groups in terms of the mean admission BNP and peak BNP levels, the mean BNP level at 7 months was higher in group H than in group L (P=0.021) (Table 1). Univariate analysis showed higher MAGE group was a strong predictor of LVR (P<0.001) (Table 5). In the multivariate logistic regression analysis by forced inclusion model, higher MAGE group was shown to be an independent predictor of LVR (odds ratio, 13.999; 95% confidence interval, 3.059–64.056; P=0.001) (model 1 in
Table 5). In the multivariate logistic regression analysis by the forced inclusion model, higher MAGE group was a predictor of LVR independently of HbA1c
on admission and glucose on admission (model 2 in
Table 5).
Table 5.
Univariate and Multivariate Logistic Regression Analyses by the Forced Inclusion Model for the Prediction of LV Remodeling in Patients Enrolled in a Study of GV After First STEMI
| Variable |
Univariate |
Multivariate (model 1) |
Multivariate (model 2) |
| OR |
95% CI |
P value |
OR |
95% CI |
P value |
OR |
95% CI |
P value |
| Culprit LAD |
0.962 |
0.328–2.817 |
0.943 |
1.994 |
0.334–11.897 |
0.449 |
|
– |
|
| β-blocker on discharge |
3.500 |
0.899–13.626 |
0.071 |
1.973 |
0.373–10.441 |
0.424 |
|
– |
|
| Admission BNP, per 1 pg/ml |
0.977 |
0.955–0.999 |
0.045 |
0.978 |
0.951–1.007 |
0.136 |
|
– |
|
Infarct core, per 1% of LV
mass |
0.974 |
0.920–1.031 |
0.365 |
0.948 |
0.859–1.047 |
0.291 |
|
– |
|
| LVCI, per 1 L·min−1·m−2 |
0.265 |
0.087–0811 |
0.020 |
0.317 |
0.089–1.124 |
0.075 |
|
– |
|
| Peak hs-CRP, per 1 mg/dl |
1.019 |
0.887–1.171 |
0.787 |
1.038 |
0.835–1.291 |
0.736 |
|
– |
|
| HbA1c on admission, per 1% |
0.710 |
0.232–2.174 |
0.549 |
|
– |
|
0.178 |
0.031–1.035 |
0.055 |
Glucose on admission, per
1 mg/dl |
1.007 |
0.996–1.018 |
0.196 |
|
– |
|
1.016 |
0.999–1.034 |
0.065 |
| Group H |
10.660 |
3.080–36.897 |
<0.001 |
13.999 |
3.059–64.056 |
0.001 |
13.330 |
3.419–51.973 |
<0.001 |
Univariate variables with a value of P<0.1 and forced inclusion variables (culprit LAD, the extent of infarct core, peak hs-CRP, HbA1c
on admission, and glucose on admission) are shown. Group H, the upper tertile of the mean amplitude of glycemic excursions; OR, odds ratio. Other abbreviations as in Tables 1–4.
Discussion
The principal finding of the present study was that MAGE as determined by CGMS is an independent predictor of LVR in the chronic phase in patients with a first STEMI. To our best knowledge, this is the first study to demonstrate MAGE as associated with LVR.
Utility of GV
Impaired glucose metabolism plays an important role in the development of macrovascular complications.18
Monnier et al showed that MAGE had a more specific triggering effect on oxidative stress than sustained hyperglycemia and that oxidative stress was reduced by blunting GV.19
Oxidative stress causes complications related to impaired glucose metabolism through 4 molecular mechanisms.20
In addition, Quagliaro et al showed that intermittent hyperglycemia induces a higher degree of apoptosis in endothelial cells than does sustained hyperglycemia.21
All these findings suggest that GV plays an important role in the development of complications related to impaired glucose metabolism. Moreover, a higher glucose level on admission4
and hypoglycemia on admission,5
which represent one aspect of GV, have been reported to be predictors of poor outcomes in patients with AMI as mentioned earlier. However, according to guidelines for secondary prevention of MI, the only goal value for glycemic control is HbA1c
level <7.0%.22
Thus the clinical significance of GV itself remains to be fully elucidated in patients with AMI.
Although previous studies have assessed GV on the basis of SMBG levels,23
a CGMS must be used to detect glycemic excursions that cannot be detect with SMBG.24
Because MAGE calculated from CGMS data is considered the most important index of GV, we used that variable in the present study.
Our results showed that MAGE was a predictor of LVR independently of the levels of HbA1c
and glucose on admission. Prolonged GV during the follow-up period influenced LVR more strongly than did either glucose on admission as a 1-point marker of GV in the acute phase, or HbA1c
level as a marker of sustained hyperglycemia.
Recently, Teraguchi et al showed that MAGE correlates not with the extent of Core but MSI.25
Their findings are consistent with our results, although they did not examine the relationship of MAGE to LVR.
Mechanisms of the Association Between GV and LVR
Previous studies showed that a larger Core, anterior AMI, and CRP level were predictors of LVR,15,17
but not in the present study. Instead, our univariate analysis for the prediction of LVR showed LVCI as a predictor of LVR, although it did not reach significance on the multivariate analysis (Table 5). One reason of this result may be the small sample size and another reason may be the timing of early CMR. In a previous study using echocardiography, baseline LVEDVI was evaluated within 24 h of admission;26
however, in the present study it was difficult to perform CMR within that time frame. Because LV dilatation might be largely completed during this time lag before CMR in patients with a large infarct, the infarct size might have had a low impact on LVR during follow-up in the present study. However, it is also important during follow-up to identify the patients with LVR. To know the predictor of LVR during follow-up, we conducted the present study with CMR and demonstrated that MAGE was a strong predictor of LVR during follow-up independent of the traditional predictors, accompanied by higher BNP level in the chronic phase. Despite significant difference in the 2 groups with regard to infarct size (Figure 3A) and group H having the right coronary artery more often as culprit vessel than did group L (although it was not significant as shown in
Table 1), LVR was more often observed in group H than in group L (Figure 3B). It is possible that this result was an effect of GV itself on LVR.
Impaired glucose metabolism is associated with coronary microvascular dysfunction,27
poor collateral development,28
prevention of ischemic preconditioning,29
inflammation,30
and decreased mitochondrial ATP,31
all of which may lead to LVR. Because MAGE has a more specific triggering effect on oxidative stress than sustained hyperglycemia,19
it may be associated with these factors more strongly and thus have an effect on LVR. Therefore we might be able to demonstrate that MAGE is an independent predictor of LVR despite a small sample size.
MAGE early after the onset of STEMI had a strong effect on LVR in the chronic phase. More aggressive treatment against LVR, such as renin-angiotensin system inhibitors, is needed for patients in the higher MAGE group early after the onset of STEMI. In addition, Rizzo et al showed that blunting GV reduces oxidative stress and inflammation,32
suggesting that blunting GV might be additionally beneficial in terms of LVR after STEMI. Further studies are needed to confirm such potential benefits.
Study Limitations
Our study had several potential limitations. First, the study group comprised a relatively small number of patients enrolled in a single center. However, we enrolled only patients without medication (including insulin) for DM or hyperglycemia to eliminate the effect of medications on GV so that we could clearly reveal the significance of GV. Second, we did not measure oxidative stress markers in the present study, but it is widely recognized that GV causes much higher oxidative stress than does chronic sustained hyperglycemia.19,25
Third, we excluded high-risk patients such as those with severe chronic kidney disease or clinical instability. It remains uncertain if our results apply to these subgroups of patients. Fourth, β-blockers were used in only 45 patients (65%) on discharge, because of the frequency of vasospasm in Japanese and low evidence of β-blocker benefit in the primary percutaneous coronary intervention era.33
However, we used β-blockers for patients with reduced EF or high risk for coronary events, which is the reason why β-blocker on discharge had a tendency to be a predictor for LVR in the univariate analysis (Table 5).
Conclusions
MAGE early after the onset of STEMI identified patients with LVR in the chronic phase. Therefore, evaluation of MAGE enables effective identification of patients requiring more aggressive treatment against LVR. In addition, it may be beneficial to blunt GV, as estimated by MAGE, for improved clinical outcomes in patients with reperfused STEMI.
Disclosures
Grant Support: None
References
- 1.
Bando YK, Murohara T. Diabetes-related heart failure. Circ J 2014; 78: 576–583.
- 2.
Zuanetti G, Latini R, Maggioni AP, Santoro L, Franzosi MG. Influence of diabetes on mortality in acute myocardial infarction: Data from the GISSI-2 study. J Am Coll Cardiol 1993; 22: 1788–1794.
- 3.
Suleiman M, Hammerman H, Boulos M, Kapeliovich MR, Suleiman A, Agmon Y, et al. Fasting glucose is an important independent risk factor for 30-day mortality in patients with acute myocardial infarction: A prospective study. Circulation 2005; 111: 754–760.
- 4.
Kosiborod M, Rathore SS, Inzucchi SE, Masoudi FA, Wang Y, Havranek EP, et al. Admission glucose and mortality in elderly patients hospitalized with acute myocardial infarction: Implications for patients with and without recognized diabetes. Circulation 2005; 111: 3078–3086.
- 5.
Yang SW, Zhou YJ, Hu DY, Nie XM, Liu YY, Hua Q, et al. Association between admission hypoglycaemia and in-hospital and 3-year mortality in older patients with acute myocardial infarction. Heart 2010; 96: 1444–1450.
- 6.
Timmer JR, Hoekstra M, Nijsten MW, van der Horst IC, Ottervanger JP, Slingerland RJ, et al. Prognostic value of admission glycosylated hemoglobin and glucose in nondiabetic patients with ST-segment-elevation myocardial infarction treated with percutaneous coronary intervention. Circulation 2011; 124: 704–711.
- 7.
Wang X, Zhao X, Dorje T, Yan H, Qian J, Ge J. Glycemic variability predicts cardiovascular complications in acute myocardial infarction patients with type 2 diabetes mellitus. Int J Cardiol 2014; 172: 498–500.
- 8.
D’Archangelo MJ. New guideline supports the development and evaluation of continuous interstitial glucose monitoring devices. J Diabetes Sci Technol 2008; 2: 332–334.
- 9.
Kim RJ, Fieno DS, Parrish TB, Harris K, Chen EL, Simonetti O, et al. Relationship of MRI delayed contrast enhancement to irreversible injury, infarct age, and contractile function. Circulation 1999; 100: 1992–2002.
- 10.
Aletras AH, Tilak GS, Natanzon A, Hsu LY, Gonzalez FM, Hoyt RF, et al. Retrospective determination of the area at risk for reperfused acute myocardial infarction with T2-weighted cardiac magnetic resonance imaging: Histopathological and displacement encoding with stimulated echoes (DENSE) functional validations. Circulation 2006; 113: 1865–1870.
- 11.
Service FJ, Molnar GD, Rosevear JW, Ackerman E, Gatewood LC, Taylor WF. Mean amplitude of glycemic excursions, a measure of diabetic instability. Diabetes 1970; 19: 644–655.
- 12.
American Diabetes Association. Diagnosis and classification of diabetes mellitus. Diabetes Care 2013; 36(Suppl 1): S67–S74.
- 13.
Yan AT, Shayne AJ, Brown KA, Gupta SN, Chan CW, Luu TM, et al. Characterization of the peri-infarct zone by contrast-enhanced cardiac magnetic resonance imaging is a powerful predictor of post-myocardial infarction mortality. Circulation 2006; 114: 32–39.
- 14.
Kitabata H, Kubo T, Ishibashi K, Komukai K, Tanimoto T, Ino Y, et al. Prognostic value of microvascular resistance index immediately after primary percutaneous coronary intervention on left ventricular remodeling in patients with reperfused anterior acute ST-segment elevation myocardial infarction. JACC Cardiovasc Interv 2013; 6: 1046–1054.
- 15.
Lund GK, Stork A, Muellerleile K, Barmeyer AA, Bansmann MP, Knefel M, et al. Prediction of left ventricular remodeling and analysis of infarct resorption in patients with reperfused myocardial infarcts by using contrast-enhanced MR imaging. Radiology 2007; 245: 95–102.
- 16.
Springeling T, Kirschbaum SW, Rossi A, Baks T, Karamermer Y, Schulz C, et al. Late cardiac remodeling after primary percutaneous coronary intervention-five-year cardiac magnetic resonance imaging follow-up. Circ J 2013; 77: 81–88.
- 17.
Takahashi T, Anzai T, Yoshikawa T, Maekawa Y, Asakura Y, Satoh T, et al. Serum c-reactive protein elevation in left ventricular remodeling after acute myocardial infarction: Role of neurohormones and cytokines. Int J Cardiol 2003; 88: 257–265.
- 18.
Stettler C, Allemann S, Juni P, Cull CA, Holman RR, Egger M, et al. Glycemic control and macrovascular disease in types 1 and 2 diabetes mellitus: Meta-analysis of randomized trials. Am Heart J 2006; 152: 27–38.
- 19.
Monnier L, Mas E, Ginet C, Michel F, Villon L, Cristol JP, et al. Activation of oxidative stress by acute glucose fluctuations compared with sustained chronic hyperglycemia in patients with type 2 diabetes. JAMA 2006; 295: 1681–1687.
- 20.
Brownlee M. Biochemistry and molecular cell biology of diabetic complications. Nature 2001; 414: 813–820.
- 21.
Quagliaro L, Piconi L, Assaloni R, Martinelli L, Motz E, Ceriello A. Intermittent high glucose enhances apoptosis related to oxidative stress in human umbilical vein endothelial cells: The role of protein kinase C and NAD(P)H-oxidase activation. Diabetes 2003; 52: 2795–2804.
- 22.
JCS Joint Working Group. Guidelines for secondary prevention of myocardial infarction (JCS 2011): Digest version. Circ J 2013; 77: 231–248.
- 23.
Lipska KJ, Venkitachalam L, Gosch K, Kovatchev B, Van den Berghe G, Meyfroidt G, et al. Glucose variability and mortality in patients hospitalized with acute myocardial infarction. Circ Cardiovasc Qual Outcomes 2012; 5: 550–557.
- 24.
Sampaio CR, Franco DR, Goldberg DJ, Baptista J, Eliaschewitz FG. Glucose control in acute myocardial infarction: A pilot randomized study controlled by continuous glucose monitoring system comparing the use of insulin glargine with standard of care. Diabetes Technol Ther 2012; 14: 117–124.
- 25.
Teraguchi I, Imanishi T, Ozaki Y, Tanimoto T, Ueyama M, Orii M, et al. Acute-phase glucose fluctuation is negatively correlated with myocardial salvage after acute myocardial infarction. Circ J 2013; 78: 170–179.
- 26.
Carrabba N, Valenti R, Parodi G, Santoro GM, Antoniucci D. Left ventricular remodeling and heart failure in diabetic patients treated with primary angioplasty for acute myocardial infarction. Circulation 2004; 110: 1974–1979.
- 27.
Iwakura K, Ito H, Ikushima M, Kawano S, Okamura A, Asano K, et al. Association between hyperglycemia and the no-reflow phenomenon in patients with acute myocardial infarction. J Am Coll Cardiol 2003; 41: 1–7.
- 28.
Werner GS, Richartz BM, Heinke S, Ferrari M, Figulla HR. Impaired acute collateral recruitment as a possible mechanism for increased cardiac adverse events in patients with diabetes mellitus. Eur Heart J 2003; 24: 1134–1142.
- 29.
Ishihara M, Inoue I, Kawagoe T, Shimatani Y, Kurisu S, Nishioka K, et al. Diabetes mellitus prevents ischemic preconditioning in patients with a first acute anterior wall myocardial infarction. J Am Coll Cardiol 2001; 38: 1007–1011.
- 30.
Choi KM, Lee KW, Kim SG, Kim NH, Park CG, Seo HS, et al. Inflammation, insulin resistance, and glucose intolerance in acute myocardial infarction patients without a previous diagnosis of diabetes mellitus. J Clin Endocrinol Metab 2005; 90: 175–180.
- 31.
Suarez J, Hu Y, Makino A, Fricovsky E, Wang H, Dillmann WH. Alterations in mitochondrial function and cytosolic calcium induced by hyperglycemia are restored by mitochondrial transcription factor A in cardiomyocytes. Am J Physiol Cell Physiol 2008; 295: C1561–C1568.
- 32.
Rizzo MR, Barbieri M, Marfella R, Paolisso G. Reduction of oxidative stress and inflammation by blunting daily acute glucose fluctuations in patients with type 2 diabetes: Role of dipeptidyl peptidase-IV inhibition. Diabetes Care 2012; 35: 2076–2082.
- 33.
Ozasa N, Kimura T, Morimoto T, Hou H, Tamura T, Shizuta S, et al. Lack of effect of oral beta-blocker therapy at discharge on long-term clinical outcomes of ST-segment elevation acute myocardial infarction after primary percutaneous coronary intervention. Am J Cardiol 2010; 106: 1225–1233.

