Abstract
Background:
Relative apical sparing pattern of longitudinal strain (RapSP-LS) was suggested in advanced cardiac amyloidosis (CA). It is unclear whether it is present in less advanced CA.
Methods and Results:
Patients with presumptive diagnosis of CA and mean left ventricular wall thickness (LVWT) ≤14 mm were recruited. Apart from RapSP-LS visually identified, relative apical longitudinal strain index (RapLSI) was defined as [average apical LS/(average basal LS+average mid-ventricle LS)]. Among 119 patients included, 47 were finally diagnosed with CA. RapLSI was higher in the CA group compared to other causes of increased mean LVWT (P<0.001), but with a significant range of overlap noted. In contrast, RapSP-LS visually assessed was noted in most CA patients (31/47, 66.0%) except in those with preserved LV ejection fraction, normal LVWT, and mildly decreased global LS, suggesting least advanced CA. On multivariate analysis of the added diagnostic role of RapSP-LS or RapLSI on top of clinical, electrocardiographic, and conventional echocardiographic parameters, addition of RapLSI produced only borderline increase in area under the curve of the multivariate model (P=0.05), whereas addition of RapSP-LS significantly increased it (P<0.001).
Conclusions:
Visual identification of RapSP-LS is useful in terms of added diagnostic value compared with quantitative calculation of RapLSI. Its clinical application, however, should be used with caution in patients with less advanced CA. (Circ J 2015; 79: 1575–1584)
Cardiac amyloidosis (CA) is a representative infiltrative cardiomyopathy caused by the abnormal extracellular deposition of insoluble β-pleated sheet fibrils.1
Although rare, CA usually portends a dismal prognosis, and thus early diagnosis is crucial for successful management.2
Unfortunately, however, detection of early CA is still challenging. Although advances in cardiac magnetic resonance (CMR) allowed early, non-invasive diagnosis, its use is still limited due to high cost and variable clinical situations including arrhythmia, hemodynamic instability, and renal failure. Two-dimensional (2-D) speckle tracking echocardiography has also shown some promise in the early diagnosis of CA in patients with Amyloid-Light chain (AL) amyloidosis using left ventricular (LV) longitudinal strain (LS) analysis,3
but a decrease in LS is not specific for CA.4–6
Recently, the application of LS has been extended for etiologic diagnosis of increased LV wall thickness (LVWT) by analyzing LS pattern across the LV segments. The apicobasal gradient of LS, or relative apical sparing pattern of LS (RapSP-LS), is a representative example that has been described in patients with “advanced” stage CA, characterized by median LVWT ≥14 mm.7–9
If RapSP-LS could be detected in the earlier stage of CA, it would be more useful for early and non-invasive diagnosis, and finally be helpful to improve prognosis by establishing timely management. Nonetheless, there is a paucity of data on the presence of RapSP-LS in the earlier stages of CA. Therefore, this study investigated the usefulness of RapSP-LS in less advanced CA.2
Methods
Subjects
All patients with borderline or mildly increased mean LVWT (≤14 mm) on routine echocardiography and suspected of CA were enrolled between February 2009 and May 2014. CA in this group was initially suspected based on comprehensive conventional echocardiography suggesting potential diagnosis of restrictive cardiomyopathy and/or clinical findings such as multiple myeloma and unexplained exertional dyspnea. Patients with similar degree of LVWT due to other causes were identified for comparison using the echocardiography database. These included 36 patients with severe aortic stenosis, 12 patients with hypertrophic cardiomyopathy, and 9 patients with hypertensive heart disease. Medical records of all patients were carefully reviewed to confirm the diagnosis. All patients were recruited from 2 tertiary referral academic centers (45 patients from Samsung Medical Center and 74 patients from Seoul National University Hospital). Some patients were pre-excluded when echocardiography was unsuitable for speckle tracking strain analysis due to poor image quality (defined as ≥2 non-visualized segments) or significant arrhythmia, including atrial fibrillation and frequent premature beats.
Diagnostic confirmation of CA was made using 2 established methods: endomyocardial biopsy (EMB) and/or late gadolinium enhancement (LGE) on CMR. Identification of amyloid deposition on EMB specimen with Congo red or amyloid P stain and/or typical patterns of LGE on CMR was a prerequisite for diagnosis of CA.10,11
Because nulling out normal myocardium through optimal inversion time was sometimes technically challenging in CA, it was also considered that CA was highly probable if >50% of LV myocardium went through the nulling time point earlier than LV cavity did.12
In those patients diagnosed with CA only by LGE on CMR, pathological confirmation of amyloid deposition in at least 1 other organ outside the heart was absolutely necessary.2,9
Amyloidosis subtype was determined on immunohistochemistry of the biopsy specimen, including kappa, lambda, transthyretin, and amyloid A. When transthyretin was positive, genetic study for transthyretin gene mutation was additionally performed to discriminate wild-type from hereditary transthyretin amyloidosis. In the case of inconclusive immunohistochemistry, patients were categorized as unclassifiable type. In the enrolled patients with severe aortic stenosis, the possibility of concomitant CA was ruled out by the pattern of LGE on CMR.
Echocardiography
All echocardiography was conducted using Vivid 7 or Vivid 9 ultrasound equipment (GE Medical Systems, Horten, Norway) to minimize potential variability of strain and its pattern analysis. Echocardiography was performed according to the American Society of Echocardiography guidelines as follows: LV ejection fraction (LVEF) was calculated using biplane Simpson’s method, left atrial volume index by the area-length formula, mean LVWT by calculating the average of end-diastolic interventricular septal wall and LV posterior wall thickness, and mitral inflow/mitral annular velocity was determined on pulsed-wave Doppler.13,14
Tissue Doppler imaging was used to measure peak early diastolic mitral annular velocity at the septal mitral annulus (e’) in apical 4-chamber view, which was combined with the early mitral inflow velocity (E) to produce non-invasive calculation of LV filling pressure (E/e’). Apart from conventional echocardiographic measurements, 2-D speckle tracking technique was used to analyze 3 types of LV strain (LS; radial strain [RS], and circumferential strain [CS]) with dedicated software (EchoPAC version 5.0.1, GE Medical Systems, Horten, Norway), based on the method previously described.15–17
For LV LS measurements, LS was separately obtained in apical 2-, 3-, and 4-chamber views. After each segmental LS value was procured in the 3 apical views, a bull’s eye plot of segmental LS was automatically constructed.16
Peak global LS was calculated for the whole LV myocardium as 1 big segment, not an average of each segmental strain.15,16
Frame rate for speckled tracking was maintained at 60−100 frames/s. All images were digitally stored and analyzed off-line by an independent observer blinded to clinical and other echocardiographic information. Intra-class correlation coefficient between the 2 centers was estimated to be 0.96 (95% CI: 0.95−0.98) from 8 randomly selected patients (136 segmental and 8 global LS values). Two independent cardiologists visually assessed the presence or absence of RapSP-LS based on the LS polar map. The presence of RapSP-LS by visual assessment was defined as visual reduction of LS in the basal and middle segment LS (light red or blue) relative to apical LS (red;
Figure S1).9,18
Apart from visual interpretation, relative apical LS index (RapLSI) was calculated as follows:9
RapLSI=mean apical LSmean basal LS + mean mid LS
Electrocardiography
A standard 12-lead electrocardiogram (ECG) was recorded in each patient. Low voltage was defined as QRS voltage <5 mm in all limb leads.19
LV hypertrophy (LVH) by voltage criteria was defined as the sum of S wave in V1 and R wave in V5 or V6 ≥35 mm.8
Pseudoinfarct pattern was defined as a QS wave in 2 consecutive anterior leads in the absence of old myocardial infarction.8
CMR
CMR was conducted using 1.5-T systems (Magnetom Avanto®
and Sonata Magnetom®, Siemens Medical Systems, Erlangen, Germany) gated with ECG. LGE images were obtained using multiple short-axis views (slice thickness of 6 mm, inter-slice gap of 4 mm) and 3 long-axis views 10 min after injection of intravenous contrast agents (0.15 mmol/kg of gadobutrol in Samsung Medical Center and 0.2 mmol/kg of gadopentetate dimeglumine in Seoul National University Hospital). LGE was acquired using the inversion recovery segmented spoiled-gradient echo sequences and phase-sensitive inversion recovery sequences.
Statistical Analysis
Data are expressed as mean±SD or median (IQR) for continuous variables and as number (percentage) for categorical variables. After Shapiro-Wilk test was used to assess normality for continuous variables, independent t-test or Mann-Whitney test was used. Categorical variables were compared using chi-squared test or Fisher’s exact test, where appropriate. To evaluate the usefulness of RapLSI for the early diagnosis of CA, the receiver operating characteristic (ROC) curve was generated to identify the best cut-off to maximize the sum of sensitivity and specificity. Correlation of RapLSI with other echocardiographic parameters was tested with Pearson correlation analysis.
To investigate the added diagnostic value of visual identification of RapLSI or RapSP-LS to that of ECG and conventional echocardiographic findings, we created 3 separate multivariate models. For multivariate model 1, ECG and echocardiographic variables with P<0.10 on univariate analysis (low voltage/LVH/pseudoinfarct pattern for ECG-related variables, presence of pericardial effusion/LVEF/deceleration time [DT] for echocardiography-related variables) were included. Multivariate models 2 and 3 included RapLSI and RapSP-LS by visual assessment (ie, presence or absence) in addition to the variables in model 1, respectively. The area under the curve (AUC) of each multivariate model was calculated and compared for statistical significance.
Hierarchical clustering of the regional LS arrays was conducted to identify different patterns of LS in CA. Regional LS vectors with similar patterns are grouped together by minimizing the squared Euclid distance between them according to a distance metric and linkage rule irrespective of any particular hypotheses. This approach is frequently used in the analysis of microarray data, and can be applied to any multidirectional dataset.20
Regional LS were standardized by their z-score. The hierarchical clusters were visually assessed to determine the optimal number of clusters, based on how the CA patients were grouped together. Clinical and echocardiographic characteristics were compared among the different clusters of LS pattern using 1-way analysis of variance followed by pairwise multiple comparisons with Bonferroni correction. Because of the possibility of an inflation of type I error that can be derived from multiple comparisons among the 4 groups, P<0.008 was adopted for statistical significance. In the remaining statistical analysis, P<0.05 was used. Concordance between 2 readers for the presence or absence of RapSP-LS in patients with CA was assessed using κ coefficient. All statistical analysis was performed using SPSS Statistics version 21 (SPSS, Chicago, IL, USA) and Medcalc Version 13.3.
Results
Clinical Characteristics and Echocardiographic Parameters
Of 83 patients with a presumptive diagnosis of CA, EMB alone was performed in 18 patients for diagnostic confirmation, CMR alone in 15, and both EMB and CMR in 50. As a result, 47 patients were diagnosed with CA, and the other patients were identified as having other causes of LVH (Figure 1).

Baseline subject characteristics are listed in
Table 1. CA patients were younger, had a lower incidence of hypertension and diabetes mellitus, higher heart rate, lower systolic blood pressure, and lower hemoglobin as compared with patients with other causes of LVH. The New York Heart Association (NYHA) class was not different. On ECG, low-voltage QRS and pseudoinfarct pattern were observed more frequently in CA. The absolute prevalence of these findings, however, was not high in both groups. On conventional echocardiography, CA patients had a slightly lower LVEF compared with their non-CA counterparts (P=0.003). Mean LVWT was only 12 mm in CA patients, suggesting an early stage of disease. The prevalence of pericardial effusion was significantly higher in CA patients. CA patients had typical features of advanced LV diastolic dysfunction suggested by lower DT and higher E/e’. DT and E/e’, however, seemed to be clinically less helpful for differential diagnosis, due to significant overlap between the 2 groups (Figures 2A,B).
Table 1.
Subject Characteristics vs. Diagnosis
| |
With CA
(n=47) |
Other causes of LVH
(n=72) |
P-value |
| Clinical factors |
| Age |
60 (48–66) |
70 (56–74) |
<0.001 |
| Male |
28 (59.6) |
43 (59.7) |
0.99 |
| History of hypertension |
6 (12.8) |
46 (66.7) |
<0.001 |
| History of diabetes mellitus |
4 (8.5) |
22 (33.3) |
0.002 |
| NYHA class |
| II |
21 (44.7) |
28 (38.9) |
0.81 |
| III or IV |
10 (21.2) |
15 (20.9) |
|
| HR (beats/min) |
78 (70–88) |
69 (60–73) |
<0.001 |
| SBP (mmHg) |
107±17 |
125±20 |
<0.001 |
| DBP (mmHg) |
68±9 |
69±10 |
0.93 |
| Hemoglobin (g/dl) |
11.3±1.9 |
12.6±2.2 |
<0.001 |
| Sodium (mmol/L) |
139 (137–141) |
139 (137–141) |
0.44 |
| BUN (mg/dl) |
22.0 (15.4–30.3) |
20.0 (16.0–26.0) |
0.34 |
| Creatinine (mg/dl) |
1.15 (0.79–1.79) |
0.94 (0.74–1.27) |
0.27 |
| Electrocardiography |
| Low voltage in limb leads |
23 (48.9) |
10 (13.9) |
<0.001 |
| LVH by voltage criteria |
4 (8.5) |
30 (41.7) |
<0.001 |
| Pseudoinfarct pattern |
15 (31.9) |
4 (5.6) |
<0.001 |
| Echocardiography |
| LVEF (%) |
57.0 (49.5–63.0) |
62.0 (56.0–65.3) |
0.003 |
| Mean LVWT (mm) |
12.0 (11.5–13.0) |
12.0 (11.0–12.5) |
0.046 |
| PE |
30 (63.8) |
14 (19.4) |
<0.001 |
| LAVI (ml/m2) |
47.0 (39.3–59.4) |
51.7 (40.0–64.1) |
0.30 |
| E/A |
1.3 (0.8–2.2) |
0.8 (0.6–1.1) |
<0.001 |
| e’ (cm/s) |
4.2 (3.2–5.0) |
4.0 (3.3–5.1) |
0.99 |
| E/e’ |
18.8 (13.9–23.3) |
15.9 (12.8–20.0) |
0.043 |
| DT (ms) |
173 (150–203) |
204 (170–258) |
0.004 |
Data given as n (%), mean±SD or median (IQR). A, late diastolic mitral inflow velocity; CA, cardiac amyloidosis; DT, deceleration time; e’, peak early diastolic velocity of the septal mitral annulus; E, early diastolic mitral inflow velocity; HR, heart rate; LAVI, left atrial volume index; LVEF, left ventricular ejection fraction; LVH, left ventricular hypertrophy; LVWT, left ventricular wall thickness; NYHA, New York Heart Association; PE, pericardial effusion; S(D)BP, systolic (diastolic) blood pressure.

LV global LS was significantly worse in patients with CA than in those with other causes of LVH (Table 2). When analyses were performed separately according to the level of segments, averaged LS was significantly worse at the basal and mid-ventricular levels in CA patients, but it was similar at the apical level between the 2 groups. With the exception of apical averaged CS, averaged RS and CS also appeared worse in CA patients than in patients with other causes of LVH.
Table 2.
Strain Analysis According to the Group With Amyloidosis and Other Causes of LVH
| |
CA
(n=47) |
Other causes of LVH
(n=72) |
P-value |
| Global LS (%) |
−11.2±3.6 |
−14.0±3.6 |
<0.001 |
| Averaged regional LS (%) |
| Base |
−7.2 (−11.0 to −5.8) |
−12.8 (−16.0 to −9.8) |
<0.001 |
| Mid ventricle |
−10.0 (−13.3 to −7.5) |
−14.6 (−18.8 to −11.3) |
<0.001 |
| Apex |
−14.2 (−17.8 to −9.8) |
−15.8 (−19.8 to −12.2) |
0.24 |
| Relative apical LS index |
0.73 (0.61–0.85) |
0.57 (0.49–0.67) |
<0.001 |
| Averaged regional RS (%) |
| Base |
20.7 (15.8–31.2) |
35.8 (21.6–46.0) |
<0.001 |
| Mid ventricle |
29.1 (18.4–41.1) |
38.8 (25.5–55.0) |
0.010 |
| Apex |
20.4 (12.3–30.8) |
28.0 (16.2–44.5) |
0.005 |
| Averaged regional CS (%) |
| Base |
−15.8 (−19.8 to −11.7) |
−20.8 (−24.1 to −17.7) |
<0.001 |
| Mid ventricle |
−17.2 (−19.9 to −11.4) |
−19.6 (−22.2 to −15.6) |
0.009 |
| Apex |
−22.1 (−27.5 to −16.9) |
−24.2 (−28.5 to −18.6) |
0.34 |
Data given as mean±SD or median (IQR). CS, circumferential strain; LS, longitudinal strain; RS, radial strain. Other abbreviation as in Table 1.
RapLSI was significantly higher in patients with CA (median, 0.73; IQR, 0.61−0.85 vs. 0.57, 0.49−0.67, P<0.001;
Figure 2C). According to the ROC curve analysis, the optimal cut-off point of RapLSI to differentiate patients with CA from those with other causes of LVH was 0.65 (sensitivity, 72.3%; specificity, 77.8%; AUC, 0.75; P<0.001). Despite being statistically significant, RapLSI alone was insufficient to discriminate CA from other causes of LVH because significant overlap was evident between the 2 groups (Figure 2C).
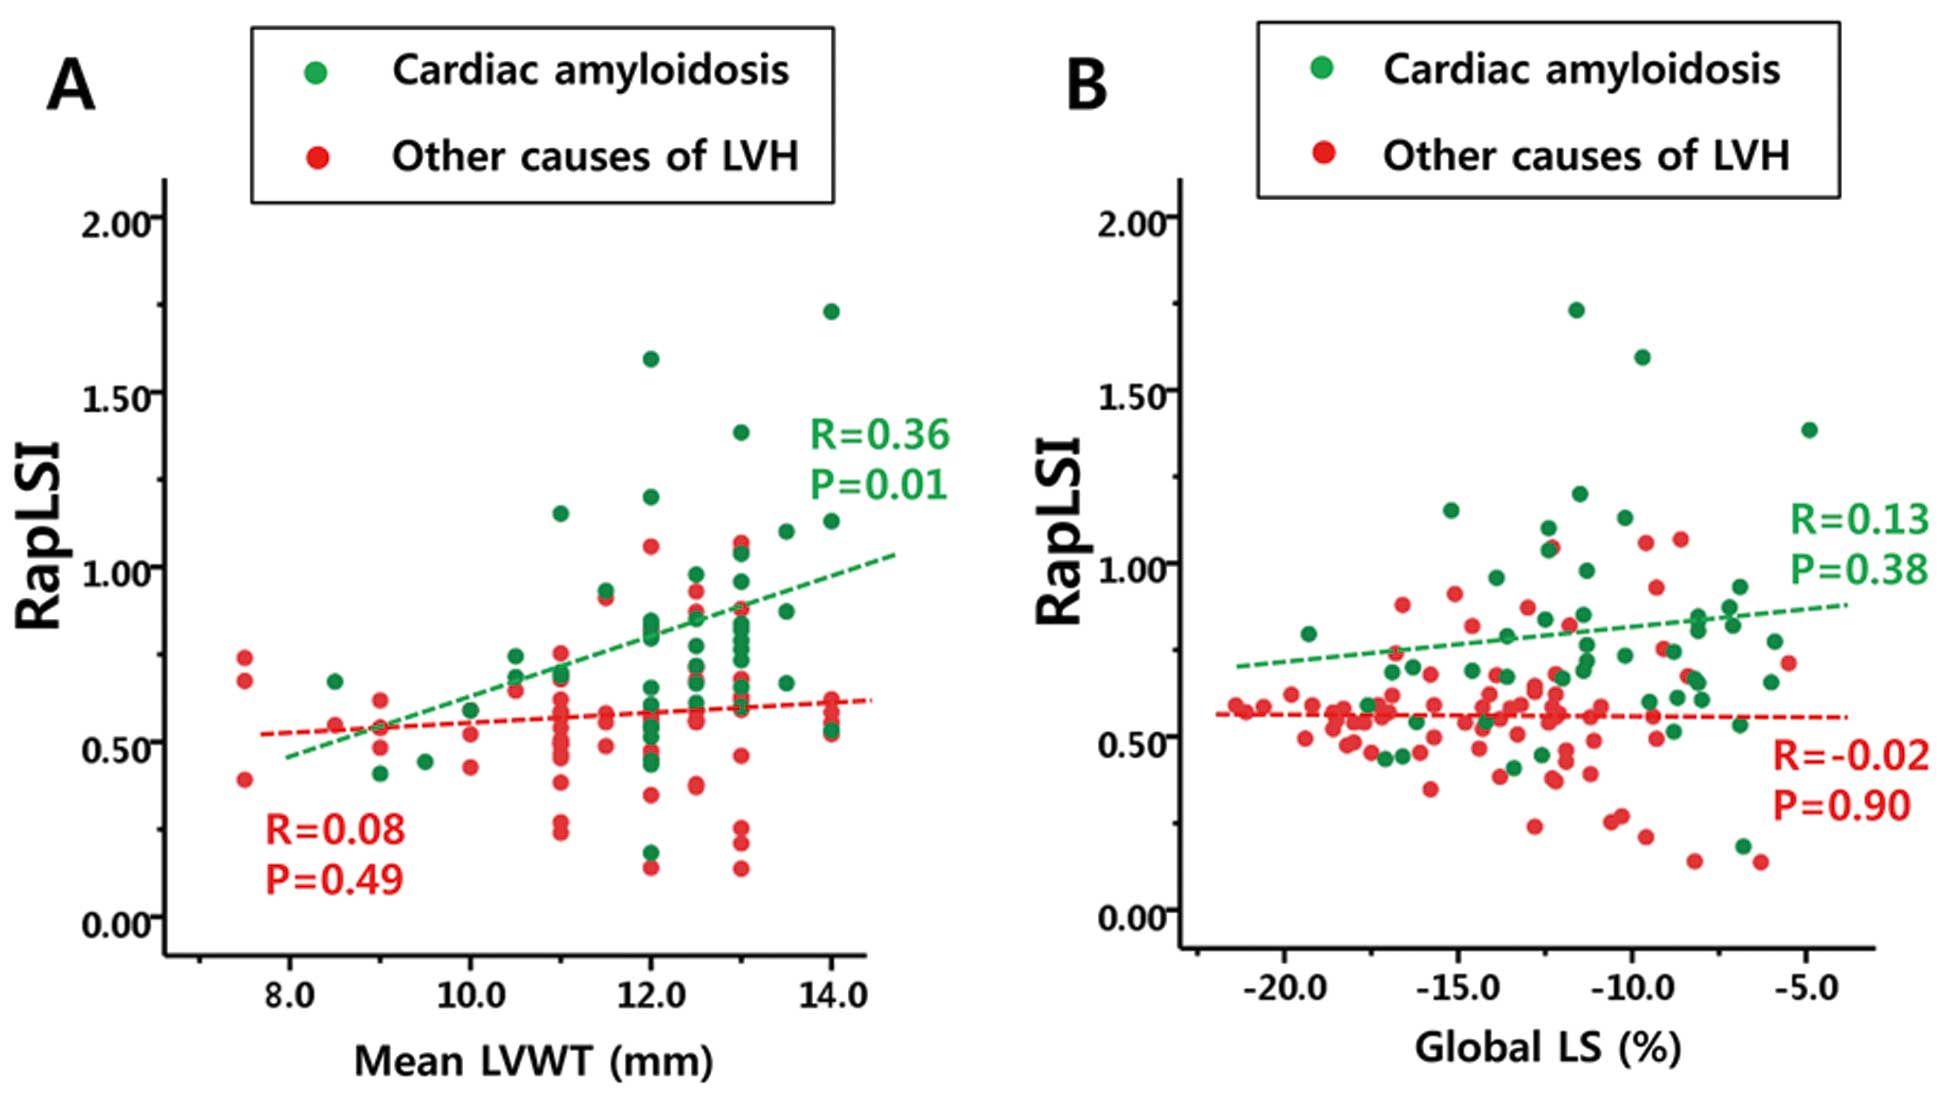
RapLSI had a weak but positive correlation with mean LVWT in patients with CA, which was not true for patients with other causes of LVH (Table S1). RapLSI had no correlation with E/e’, DT, or global LS in both groups (Figure 3;
Table S1).
LS Distribution Patterns in Amyloidosis Patients
On hierarchical cluster analysis, 4 distinct clusters were identified in 47 CA patients (Figure 4;
Table 3). Cluster 1 was characterized by essentially normal averaged apical LS but decreased averaged basal and mid-ventricle LS, resulting in a decrease in global LS. Cluster 2 included patients with decreased LS at all levels from base to apex, and thus the worst LVEF and global LS among the 4 groups. Cluster 2 had a relatively smaller decrease in LS of the apex compared with the base, while the absolute values of both apical and basal LS were similarly decreased. Cluster 3 included patients with a significant loss of LS only at the basal level but with relative preservation at the mid-ventricle and apical levels. Cluster 4 featured well-preserved LVEF, less impaired LV diastolic function, normal mean LVWT, only mildly decreased global and regional LS, and less elevation in RapLSI, implying the earliest stage of CA. RapSP-LS could be identified in 6 patients (85.7%) of cluster 1, 14 (82.4%) of cluster 2, and 10 (90.9%) of cluster 3. This unique RapSP-LS was observed in only 1 patient (8.3%) in cluster 4. RapLSI, however, had limited ability to differentiate the 4 clusters due to its significant overlap (Figure S2). Concordance between 2 readers for the presence or absence of RapSP-LS was good (κ=0.82, P<0.001).

Table 3.
Subject Characteristics According to Cluster
| |
Cluster |
| 1 (n=7) |
2 (n=17) |
3 (n=11) |
4 (n=12) |
P-value§ |
| Clinical parameters |
| Age (years) |
62.6±8.4 |
57.0±10.2 |
57.5±12.7 |
53.1±18.5 |
0.52 |
| NYHA class |
2±1 |
1.8±0.8 |
1.9±0.9 |
2.0±0.6 |
0.81 |
| Hypertension |
1 (14.3) |
1 (5.9) |
2 (18.2) |
2 (16.7) |
0.69 |
| Diabetes mellitus |
0 (0) |
1 (5.9) |
2 (18.2) |
1 (8.3) |
0.68 |
| HR (beats/min) |
82 (70–90) |
80 (76–89) |
81 (67–90) |
70 (62–84) |
0.24 |
| SBP (mmHg) |
118±19 |
101±14 |
103±13 |
114±21 |
0.15 |
| DBP (mmHg) |
73±8 |
65±10 |
68±8 |
71±10 |
0.34 |
| ECG parameters |
| Low voltage in limb leads |
3 (42.9) |
9 (52.9) |
4 (36.4) |
7 (58.3) |
0.78 |
| LVH by voltage |
0 (0) |
3 (17.6) |
1 (9.1) |
0 (0) |
0.42 |
| Pseudoinfarct pattern |
4 (57.1) |
6 (35.3) |
2 (18.2) |
3 (25.0) |
0.37 |
| Echocardiographic parameters |
| LVEF (%) |
57.9±8.7 |
50.0±10.3‡ |
56.3±6.8 |
61.2±5.4 |
0.012 |
| E/A |
1.4 (0.7–2.4) |
1.8 (1.0–3.1) |
1.2 (0.9–2.0) |
0.9 (0.8–2.0) |
0.21 |
| DT (ms) |
187.0±24.2 |
158.3±36.4 |
189.3±60.9 |
198.8±21.5 |
0.029 |
| e’ (cm/s) |
4.1 (3.2–5.0) |
3.3 (3.0–4.4) |
4.3 (3.7–4.9) |
5.0 (3.6–5.9) |
0.10 |
| E/e’ |
21.0±5.5 |
21.5±7.0 |
19.1±7.5 |
17.7±8.1 |
0.47 |
| Mean LVWT (mm) |
12.6±1.0‡ |
12.4±0.8‡ |
12.7±0.8‡ |
10.8±1.3 |
0.001 |
| Presence of PE |
4 (57.1) |
11 (64.7) |
8 (72.7) |
7 (58.3) |
0.90 |
| Global LS (%) |
−12.6±1.8* |
−7.6±1.3†,‡ |
−11.5±2.1‡ |
−15.3±2.3 |
<0.001 |
| Averaged base LS (%) |
−6.1±2.9‡ |
−5.8±1.6‡ |
−7.3±1.4‡ |
−14.2±2.3 |
<0.001 |
| Averaged mid-ventricle LS (%) |
−10.6±2.2*,‡ |
−7.1±1.6†,‡ |
−11.0±1.4‡ |
−16.5±1.6 |
<0.001 |
| Averaged apical LS (%) |
−19.2±2.4* |
−9.0±2.2†,‡ |
−15.0±2.2 |
−17.7±4.0 |
<0.001 |
| Averaged apical RS (%) |
24.6±10.5* |
12.5±7.8†,‡ |
18.5±8.0‡ |
33.1±13.2 |
<0.001 |
| Averaged apical CS (%) |
−23.2±4.9 |
−17.4±6.7†,‡ |
−26.3±6.5 |
−25.3±5.6 |
0.001 |
| RapLSI |
1.2±0.3*,†,‡ |
0.7±0.2 |
0.8±0.2 |
0.6±0.1 |
<0.001 |
| Presence of RapSP-LS |
6 (85.7%) |
14 (82.4%) |
10 (90.9%) |
1 (8.3%) |
<0.001 |
Data given as n (%), mean±SD or median (IQR). §1-way analysis of variance. *P<0.008 vs. cluster 2; †P<0.008 vs. cluster 3; ‡P<0.008 vs. cluster 4. RapLSI, relative apical LS index; RapSP-LS, relative apical sparing pattern of LS. Other abbreviations as in Tables 1,2.
We created 3 separate models to investigate the added value of RapLSI and RapSP-LS when used in addition to ECG and conventional echocardiographic parameters (Table 4). In model 1, the presence of pseudoinfarct pattern, pericardial effusion, and DT of mitral inflow had independent diagnostic value on multivariate analysis (χ2=45.1, AUC, 0.85; 95% CI: 0.77−0.91, P<0.0001). When RapLSI was added to model 1 to create model 2, the presence of pericardial effusion, DT of mitral inflow, and RapLSI had independent diagnostic value (χ2=60.5, AUC, 0.89; 95% CI: 0.82−0.94, P<0.0001). Nevertheless, the addition of RapLSI produced only borderline increase in AUC in model 2 (AUC, 0.89) compared with model 1 (AUC, 0.85; z statistic, 1.98; P=0.05). In model 3, however, which included RapSP-LS instead of RapLSI, then low voltage on ECG, pericardial effusion, DT of mitral inflow, and RapSP-LS appeared as independent variables (χ2=67.4; AUC, 0.91; 95% CI: 0.86−0.96, P<0.0001), and AUC of model 3 (AUC, 0.91) was significantly higher than that of model 1 (AUC, 0.85; z statistic, 2.13; P=0.033;
Figure S3).
Table 4.
Predictors of CA
| |
Univariate |
Multivariate |
AUC |
| OR |
95% CI |
P-value |
OR |
95% CI |
P-value |
Model 1 with ECG and conventional
echocardiographic findings |
|
|
|
|
|
|
0.85 |
| Low voltage on ECG |
5.94 |
2.47–14.32 |
<0.001 |
2.68 |
0.88–8.19 |
0.08 |
|
| LVH on ECG |
0.13 |
0.04–0.40 |
<0.001 |
0.33 |
0.09–1.16 |
0.08 |
|
| Pseudoinfarct pattern on ECG |
7.97 |
2.45–25.94 |
0.001 |
5.17 |
1.02–26.05 |
0.047 |
|
| Presence of PE |
7.31 |
3.18–16.82 |
<0.001 |
3.78 |
1.38–10.4 |
0.01 |
|
| LVEF (%) |
0.96 |
0.92–0.99 |
0.024 |
0.99 |
0.94–1.05 |
0.79 |
|
| DT (ms) |
0.988 |
0.980–0.996 |
0.002 |
0.99 |
0.99–0.999 |
0.03 |
|
Model 2 with RapLSI additional to
model 1 |
|
|
|
|
|
|
0.89 |
| Low voltage on ECG |
5.94 |
2.47–14.32 |
<0.001 |
3.67 |
1.07–12.6 |
0.06 |
|
| LVH on ECG |
0.13 |
0.04–0.40 |
<0.001 |
0.33 |
0.08–1.26 |
0.06 |
|
| Pseudoinfarct pattern on ECG |
7.97 |
2.45–25.94 |
0.001 |
1.97 |
0.31–12.5 |
0.33 |
|
| Presence of PE |
7.31 |
3.18–16.82 |
<0.001 |
5.42 |
1.75–16.8 |
0.008 |
|
| LVEF (%) |
0.96 |
0.92–0.99 |
0.024 |
1.01 |
0.95–1.07 |
0.26 |
|
| DT (ms) |
0.988 |
0.980–0.996 |
0.002 |
0.99 |
0.98–0.998 |
0.015 |
|
| RapLSI |
68.04 |
8.21–563.89 |
<0.001 |
83.2 |
5.78–1198.5 |
0.001 |
|
Model 3 with RapSP-LS additional
to model 1 |
|
|
|
|
|
|
0.91 |
| Low voltage on ECG |
5.94 |
2.47–14.32 |
<0.001 |
4.64 |
1.28–16.84 |
0.020 |
|
| LVH on ECG |
0.13 |
0.04–0.40 |
<0.001 |
0.38 |
0.09–1.62 |
0.19 |
|
| Pseudoinfarct pattern on ECG |
7.97 |
2.45–25.94 |
0.001 |
3.88 |
0.72–21.07 |
0.12 |
|
| Presence of PE |
7.31 |
3.18–16.82 |
<0.001 |
3.61 |
1.10–11.87 |
0.034 |
|
| LVEF (%) |
0.96 |
0.92–0.99 |
0.024 |
1.01 |
0.96–1.07 |
0.64 |
|
| DT (ms) |
0.988 |
0.980–0.996 |
0.002 |
0.99 |
0.98–1.00 |
0.048 |
|
| RapSP-LS |
13.6 |
5.4–34.1 |
<0.001 |
14.5 |
4.23–49.47 |
<0.001 |
|
AUC, area under receiver operating characteristic curve; CI, confidence interval; ECG, electrocardiogram. Other abbreviations as in Tables 1–3.
Discussion
We recruited patients with borderline or mildly increased mean LVWT (≤14 mm; mean LVWT, 12 mm) to evaluate the usefulness of RapSP-LS in the diagnosis of CA at an earlier stage. The main findings include the following: (1) RapSP-LS was identifiable with good concordance between readers even in CA patients with borderline or mildly increased mean LVWT; and (2) quantitative analysis of RapLSI did not provide additional diagnostic value to conventional ECG and echocardiographic evidence in less advanced CA.
RapSP-LS on 2-D speckle tracking echocardiography was first reported by Phelan et al to be both sensitive and specific for the diagnosis of CA.9
Thereafter, the presence of apicobasal LS gradient has been reported in a few subsequent studies.7,8,21
With regard to the study populations in the earlier studies, however, “advanced” stage CA patients were exclusively recruited (ie, mean LVWT ≥14 mm).7–9
Because CA patients enrolled in the previous studies had typical echocardiographic and/or ECG features, those studies provided evidence of the diagnostic usefulness of RapSP-LS in advanced CA. From a clinical viewpoint, however, the true diagnostic dilemma usually lies in differentiating CA patients from others with only mildly or even borderline increased LVWT. Given that RapSP-LS has been suggested as both a sensitive and specific tool to differentiate CA in the advanced stage, confirming the presence of RapSP-LS in CA patients with borderline or mildly increased LVWT would extend its clinical utility.
The present study exclusively recruited patients with mean LVWT ≤14 mm to include patients with less advanced CA. Intuitively, RapSP-LS was well-demonstrated in a large proportion of CA patients (35/47, 74.5%), although the proportion seems to be lower than in previous studies.7,9
RapLSI calculation in the present study appeared to be less useful for differential diagnosis than had been shown in previous studies.7–9,21
The optimal cut-off of RapLSI for predicting CA in the present study was different from that of the Phelan et al study, and the mean varied among the 4 clusters classified on hierarchical cluster analysis.9
The finding that lower RapLSI is correlated with less increased mean LVWT suggests that RapLSI should change over the disease course of CA, maybe depending on the extent of extracellular deposition of abnormal proteins.
Although the aim was to exclusively recruit patients at the early stage of disease based on the upper limit of predefined mean LVWT, 4 different clusters could be identified on hierarchical cluster analysis. Of these, patients in cluster 4 had profiles suggesting the earliest stage of CA, that is, normal LVEF, preserved DT and E/e’, and the highest global LS. In contrast, findings in cluster 2 alluded to the most advanced stage of CA. Nevertheless, no differences could be found in ECG parameters, NYHA class, or prevalence of hypertension or diabetes mellitus among clusters. All clinical, ECG, and conventional echocardiographic parameters failed to differentiate each cluster, as well. Although RapLSI was the only parameter showing diagnostic promise, statistical significance was found only in the comparison between cluster 1 and each of clusters 2, 3, or 4. In addition, RapLSI had only insignificantly increased diagnostic value when used in addition to conventional ECG and echocardiographic parameters in 2 separate multivariate models. Instead, simple visual assessment of RapSP-LS seems to be more practical and easier than quantitative analysis of RapLSI, and this characteristic pattern was identified in most patients in clusters 1–3 (Table 4). Moreover, concordance between 2 readers was excellent for determining the presence or absence of RapSP-LS. Therefore, visual interpretation of RapSP-LS might be more clinically practical in echocardiographic laboratories than the adherence to 1 cut-off value. This approach is supported by the recent observation that RapSP-LS pattern can be easily recognized without significant reader variability.18
Although plausible mechanisms to explain RapSP-LS in CA have not been confirmed, evidence suggesting possible regional differences of extracellular amyloid deposition in CA has been reported. As previously demonstrated in advanced stages of CA on CMR, LV apical wall thickness was relatively smaller compared with the almost doubling of LVWT at the basal and middle level.9
LGE extent appeared to be decreasing from base to apex, as well.7
Segmental differences in amyloid involvement, however, need to be confirmed on histology, which was not yet properly performed. There may be another plausible explanation for RapSP-LS. As shown in
Figure S4, apical segmental LS might be more related to the short-axis component of LV contraction compared with mid-ventricle or basal LS. LV short-axis function in CA is known to be preserved even when LV long-axis function is significantly impaired. In this regard, LV apical LS might be least compromised due to the contribution of the preserved short-axis function in the apex. In cluster 4, including patients with very early stage CA, RapLSI was less distinguishable because impairment of averaged basal and middle segment LS was not as significant as in other clusters. In contrast, despite mean LVWT not being different compared with other clusters, RapLSI of cluster 2 (the most advanced CA patients with lowest LVEF and worst global LS) was low mainly due to the more prominently decreased apical LS. Because LV ejection fraction is usually more related to LV short-axis function, the low RapLSI value in cluster #2 may be partially explained by very reduced short-axis function (averaged apical RS and CS), finally resulting in a low apical LS value and a low RapLSI. These findings support the relative contribution of short-axis function to apical LS compared with mid-ventricle and basal LS in generating RapSP-LS.
Several limitations should be acknowledged. First, this was an observational study enrolling a small number of CA patients. This study, however, was conducted in 2 large academic centers, and the data were analyzed in a blinded fashion. Second, patients with atrial fibrillation or other frequent arrhythmia were systematically excluded, and thus the current observation may not be extrapolated to these patients. Given a higher prevalence of atrial fibrillation in CA, investigation in patients with atrial fibrillation should be performed in the near future.7,8
Third, patients with other causes of LVH were heterogeneous. Less advanced myocardial morphology on echocardiography, however, has a wide range of etiology, and thus we believe that this study reflects real-world practice. Given that the major clinical challenge is the correct identification of CA among patients with increased LVWT, comparison of CA patients and those with diverse diseases could be helpful. Fourth, because other infiltrative cardiomyopathies were not included in this study, we should consider other diseases causing infiltrative cardiomyopathy as potential diagnoses when RapSP-LS in bull’s eye plot is noted. Last, approximately 16.7% of CA patients were unable to be classified into any specific amyloidosis subtype. RapSP-LS, however, had been reported in CA patients regardless of the pathogenesis of CA,22
and the aim of this study was mainly to compare CA patients with non-CA patients.
Conclusions
RapSP-LS can be observed even in CA patients with borderline or mildly increased LVWT, but the absence of RapSP-LS cannot completely exclude the diagnosis of CA in patients with relatively normal LVWT and preserved global LS. Quantitative calculation of RapLSI did not seem to be the best strategy, given that the optimal cut-off can vary depending on the stage of CA.
Funding Source
This work was supported by the Research Program funded by the Korea Centers for Disease Control and Prevention (2013-E63011-11).
Supplementary Files
Supplementary File 1
Figure S1.
Examples of relative apical sparing longitudinal strain pattern in the parametric polar map (A–D).
Figure S2.
Relative apical longitudinal strain index (RapLSI) in each cluster.
Figure S3.
Receiver operating characteristic curves.
Figure S4.
Left ventricular (LV) longitudinal strain (LS).
Table S1.
Correlation between RapLSI and other echocardiographic variables in each group with or without CA
Please find supplementary file(s);
http://dx.doi.org/10.1253/circj.CJ-14-1328
References
- 1.
Selkoe DJ. Folding proteins in fatal ways. Nature 2003; 426: 900–904.
- 2.
Falk RH. Diagnosis and management of the cardiac amyloidoses. Circulation 2005; 112: 2047–2060.
- 3.
Koyama J, Ray-Sequin PA, Falk RH. Longitudinal myocardial function assessed by tissue velocity, strain, and strain rate tissue Doppler echocardiography in patients with AL (primary) cardiac amyloidosis. Circulation 2003; 107: 2446–2452.
- 4.
Sato K, Seo Y, Ishizu T, Takeuchi M, Izumo M, Suzuki K, et al. Prognostic value of global longitudinal strain in paradoxical low-flow, low-gradient severe aortic stenosis with preserved ejection fraction. Circ J 2014; 78: 2750–2759.
- 5.
Nakamura A, Horigome H, Seo Y, Ishizu T, Sumazaki R. Right ventricular remodeling due to pulmonary regurgitation is associated with reduced left ventricular free wall strain in surgically repaired tetralogy of Fallot. Circ J 2014; 78: 1960–1966.
- 6.
Inoue K, Okayama H, Nishimura K, Nagai T, Suzuki J, Ogimoto A, et al. Impact of septal curvature on regional strain in patients with hypertrophic cardiomyopathy. Circ J 2013; 77: 1040–1045.
- 7.
Baccouche H, Maunz M, Beck T, Gaa E, Banzhaf M, Knayer U, et al. Differentiating cardiac amyloidosis and hypertrophic cardiomyopathy by use of three‐dimensional speckle tracking echocardiography. Echocardiography 2012; 29: 668–677.
- 8.
Liu D, Hu K, Niemann M, Herrmann S, Cikes M, Störk S, et al. Effect of combined systolic and diastolic functional parameter assessment for differentiation of cardiac amyloidosis from other causes of concentric left ventricular hypertrophy. Circ Cardiovasc Imaging 2013; 6: 1066–1072.
- 9.
Phelan D, Collier P, Thavendiranathan P, Popović ZB, Hanna M, Plana JC, et al. Relative apical sparing of longitudinal strain using two-dimensional speckle-tracking echocardiography is both sensitive and specific for the diagnosis of cardiac amyloidosis. Heart 2012; 98: 1442–1448.
- 10.
Karamitsos TD, Francis JM, Myerson S, Selvanayagam JB, Neubauer S. The role of cardiovascular magnetic resonance imaging in heart failure. J Am Coll Cardiol 2009; 54: 1407–1424.
- 11.
Vogelsberg H, Mahrholdt H, Deluigi CC, Yilmaz A, Kispert EM, Greulich S, et al. Cardiovascular magnetic resonance in clinically suspected cardiac amyloidosis: Noninvasive imaging compared to endomyocardial biopsy. J Am Coll Cardiol 2008; 51: 1022–1030.
- 12.
Mahrholdt H, Wagner A, Judd RM, Sechtem U, Kim RJ. Delayed enhancement cardiovascular magnetic resonance assessment of non-ischaemic cardiomyopathies. Eur Heart J 2005; 26: 1461–1474.
- 13.
Lang RM, Bierig M, Devereux RB, Flachskampf FA, Foster E, Pellikka PA, et al. Recommendations for chamber quantification: A report from the American Society of Echocardiography’s Guidelines and Standards Committee and the Chamber Quantification Writing Group, developed in conjunction with the European Association of Echocardiography, a branch of the European Society of Cardiology. J Am Soc Echocardiogr 2005; 18: 1440–1463.
- 14.
Nagueh SF, Appleton CP, Gillebert TC, Marino PN, Oh JK, Smiseth OA, et al. Recommendations for the evaluation of left ventricular diastolic function by echocardiography. Eur J Echocardiogr 2009; 10: 165–193.
- 15.
Cho GY, Marwick TH, Kim HS, Kim MK, Hong KS, Oh DJ. Global 2-dimensional strain as a new prognosticator in patients with heart failure. J Am Coll Cardiol 2009; 54: 618–624.
- 16.
Lee SP, Kim YJ, Kim JH, Park K, Kim KH, Kim HK, et al. Deterioration of myocardial function in paradoxical low-flow severe aortic stenosis: Two-dimensional strain analysis. J Am Soc Echocardiogr 2011; 24: 976–983.
- 17.
Ahn HS, Chang SA, Kim HK, Kim SJ, Lee SP, Park SJ, et al. Determinants of pulmonary hypertension development in moderate or severe aortic stenosis. Int J Cardiovasc Imaging 2014; 30: 1519–1528.
- 18.
Phelan D, Thavendiranathan P, Popovic Z, Collier P, Griffin B, Thomas JD, et al. Application of a parametric display of two-dimensional speckle-tracking longitudinal strain to improve the etiologic diagnosis of mild to moderate left ventricular hypertrophy. J Am Soc Echocardiogr 2014; 27: 888–895.
- 19.
Lee MH, Lee SP, Kim YJ, Sohn DW. Incidence, diagnosis and prognosis of cardiac amyloidosis. Korean Circ J 2013; 43: 752–760.
- 20.
Gollub J, Sherlock G. Clustering microarray data. Methods Enzymol 2006; 411: 194–213.
- 21.
Bostan C, Sinan UY, Canbolat P, Kucukoglu S. Cardiac amyloidosis cases with relative apical sparing of longitudinal strain. Echocardiography 2014; 31: 241–244.
- 22.
Quarta CC, Solomon SD, Uraizee I, Kruger J, Longhi S, Ferlito M, et al. Left ventricular structure and function in TTR-related versus AL cardiac amyloidosis. Circulation 2014; 129: 1840–1849.