Abstract
Background:
Quantification of geometric changes of the stent graft (SG) in abdominal aortic aneurysm has been required for follow up of endovascular aneurysm repair (EVAR). The aim was to develop an image-based modeling system (V-Modeler) to investigate these changes over time.
Methods and Results:
V-Modeler was applied to investigate the migration of the SG. Three sets of computed tomography images were taken at 3 different times: (1) 5 days after the implantation; (2) 7 months later when the unilateral leg migrated upward; and (3) 10 months later when the limb had migrated into the common iliac aneurysm resulting in a type 1b endoleak. A spline function was used to represent the center lines of the SG to track its evolutional geometric changes in a three-dimensional manner. The characteristics of vascular geometry, as well as the SG geometry using geometric parameters such as length, curvature, torsion, angle of tangent vector (ATV), and migrated length, was evaluated. It was observed that the strong peak of the curvature in the distal area appeared, and a conversion of the torsion disappeared chronologically.
Conclusions:
The V-Modeler was developed, which not only can extract vascular geometry but also can identify geometric parameter, such as curvature, torsion, and ATV, to predict adverse events following EVAR. (Circ J 2015; 79: 1534–1541)
Endovascular aneurysm repair (EVAR) for an abdominal aortic aneurysm (AAA) has been widely accepted, owing to its superior short-term results compared with conventional open surgery.1,2
Given that anatomical factors greatly influence EVAR results, device companies have provided instructions for use (IFU) to address their limitations. However, endovascular surgeons sometimes need to disregard the IFU for AAA patients with a high comorbid risk who are not candidates for conventional open surgery. Recent studies have shown that the application of EVAR beyond the guidelines of the IFU can cause EVAR-related adverse events due to aneurysmal neck factors such as short and severe angulation, presence of massive atheroma, or large diameter.3–6
These studies recommended careful long-term follow up, especially in AAA cases with challenging anatomy.
EVAR-related adverse events may be predicted based on morphological changes that are sometimes encountered during the follow-up period, such as AAA sac enlargement and drastic changes in stent graft (SG) structure. The most objective and reliable geometric parameters for evaluating these morphological changes are the sac diameter, followed by the neck angulation. However, the use of neck angulation is limited in this evaluation, due to an ambiguous definition. Although we have previously suggested a method for neck angulation measurement and reported chronological changes in AAA morphology and SG,7
this 2-dimensional (2-D) method does not allow the movement of the implanted SG to be measured with sufficient accuracy.
Thus, it is important to keep track of the evolution of morphological changes in the vascular lumen as well as in the SG in a 3-dimensional (3-D) manner. A 3-D method for neck angulation measurement is available in several commercially based software packages to detect the lumen center line semi-automatically from computed tomography (CT) imaging data. The lumen center line detection method is reported to be useful for accurate SG sizing, appropriate device selection, and optimal SG placement.8–10
Furthermore, van Keulen et al attempted to quantify the neck angulation objectively using a new standardized, semi-automatic center line detection method.11,12
However, this 3-D method for measuring post-EVAR changes has only been evaluated in a limited number of studies, and is limited by a lack of definition in evaluating such 3-D morphological parameters as curvature and torsion.
The objective of the current study was to develop an image-based modeling system (V-Modeler) with an interactive graphical user interface (GUI) for clinical use in evaluating 3-D morphological parameters, including curvature and torsion, of the SG in addition to 2-D parameters through digitization and visualization.
Methods
Clinical Case Presentation
Figure 1
shows contrast-enhanced CT imaging data of a patient who underwent EVAR with a Cook Zenith SG (Zenith; Cook Incorporated, Bloomington, IN, USA). EVAR was successfully performed on an 82-year-old female patient with AAA, with no evidence of an endoleak at 5 days after the operation (Figure 1A). The AAA had an antero-posterior diameter of 73 mm and a severely angulated neck. Seven months post-operatively, a CT scan revealed a dramatic regression of the aortic diameter from 73 mm to 47 mm; however, it demonstrated upward migration of the right limb of the SG (Figure 1B). Ten months postoperatively, the patient was admitted to hospital with acute abdominal pain. A contrast-enhanced CT scan revealed that the distal edge of the right limb of the SG had migrated into the right common iliac aneurysm, resulting in a type 1b endoleak and impending rupture (Figure 1C). As a result of the SG migration, the aneurysm diameter expanded to 76 mm, requiring immediate re-intervention with coil embolization on the right internal iliac artery and addition of a SG limb. The patient provided informed consent, and the ethics committee at our institute approved the use of anonymized image data for this study.

The key issue in this paper was to quantify the evolution of 3-D morphological changes over the course of follow up from EVAR, which might be useful for predicting such adverse events as migration of the SG. In order to obtain the 3-D images, we developed a modeling system, V-Modeler, which is an effective modeling method for constructing the 3-D geometry of both the aortic lumen and the SG. Its advantages include the ability to construct arterial networks as center lines, represent the center lines as spline functions, and quantify morphological changes over time based on the spline functions.
The development environment of V-Modeler is based on Visual Studio 2010 Professional (C++ programming language) on a Windows 7 Professional 64 bit computer. The image processing libraries are MIST (Media Integration Standard Toolkit, Nagoya University, Japan) and OpenCV 2.2, and the visualization library is OpenGL.
The GUI of V-Modeler is designed to perform each process interactively and to visualize the graphical results of the processes. It contains 3 components: an operation panel, a process tree, and a visualization area. It enables users to recognize visually the multiple images derived from the modeling process at the same time and to confirm that their work has been appropriately performed.
V-Modeler was applied to the 3 sets of medical images described above (Figure 1), which clearly demonstrated morphological changes of the SG at different timeframes. Each set of medical images was obtained from contrast-enhanced CT, acquired by a 64-slice CT scanner (Philips Brilliance 64 CT scanner; Philips Healthcare, Amsterdam, The Netherlands). The in-plane resolution was 0.650 mm and the slice thickness was 3.0 mm. The volume of CT images was resampled to iso-cubic voxels (0.650×0.650×0.650 mm) to make the program development simple. The resampling method is based on a bicubic interpolation method.
The schematic diagram of the V-Modeler is illustrated in
Figure 2. It consists of 5 processes:
Figure 2-I
segmentation of the arterial lumen;
Figure 2-II
extraction of the luminal center lines;
Figure 2-III
reconstruction of surfaces;
Figure 2-IV
calculation of geometrical parameters; and
Figure 2-V
registration and tracking of center lines and surfaces.

First, we conducted segmentation of the arterial lumen from each slice of the medical CT images
Figure 2-I, and extracted the center lines after recognizing (mapping) the aortic bifurcation, renal arteries, etc
Figure 2-II. The center lines were converted into spline functions for smoothing. These 2 steps are illustrated in
Figure 3. As each set of CT images was taken at different times with different body alignment, several reference points with minimal anatomic movement along the center line were set in the GUI of V-Modeler, as follows: (1) celiac, supra-mesenteric, and renal arteries; (2) aortic and iliac bifurcations in the native arteries; and (3) the proximal and distal edges in the SG. Then, we performed segmentation by using the 3-D region growing method13
that examines neighboring voxels of initial seed points to determine whether the voxel neighbors should be added to the segmented region. The extraction of the SG center line was performed by the 3-D thinning algorithm,13
which is based on Euclidean distance transformation. A sequence of the points on the center line of the SG were selected based on the segmentation (Figure 3C), and were converted into the spline curve with the spline fitting method14
using the least squares method with cubic spline base functions to fit a sequence of points with a B-spline curve. The 3-D surfaces of the lumen were constructed in the process
Figure 2-III. Then, the geometric parameters in the lumen and its center lines were calculated
Figure 2-IV. The parameters included the length of the center line, the curvature along the center line, the torsion along the center line, the angle of the tangent vector along the center line projecting onto the transverse plane (ATV), and the migrated distance of the distal end of the center line of the SG with the right limb.
The four geometric parameters, except the migrated distance, are calculated based on spline function:

the length of the center line:

the curvature:

the torsion:

ATV:

where t is a parameter of the curve and s´ is defined as follows:

From these definitions, the value of curvature is the degree of flexion in the present study. The torsion is a value to quantify helical motion, which is a combination of revolution and translation. ATV was our original parameter for understanding the helical motion from another point of view.
Finally, we performed the registration of geometric reference points in the images among different time points
Figure 2-V. In this process, we calculated the rotated matrix and translated vectors to minimize the distance between corresponding reference points at the different time frames using the least squares method15
with singular value decomposition.
Figure 3F
shows a schematic example of process
Figure 2-V. After the center lines were aligned so that each set of reference points at the different time frames were allocated at the same positions, the geometric parameter (equation 5) was calculated.
Results
With this modeling system, we performed the segmentation and center line extraction process
Figure 2-I
and
Figure 2-II
for each time point (Figure 3). The segmentation was performed both for the native arterial lumen and the SG (Figures 3E,F). The center line was extracted from the arterial lumen with the 3-D thinning algorithm (Figure 3G). The SG center line was separately extracted (Figure 3H).
Length Along the Center Line
In
Figure 4A, the center lines are converted into spline curves at the 3 time points and have not been aligned yet. In
Figure 4B, the center lines are aligned to conduct registration (Figure 4B). Thereafter, we can evaluate the length or degree of migration (Figure 4C). To confirm the accuracy of measurement in the present model, the total length of the SG was measured bilaterally at various intervals (Table). The length of the left side of the SG whose distal edge was not migrated did not show differences at any interval: 227.8 mm (Figure 1A), 227.0 mm (Figure 1B), and 227.0 mm (Figure 1C). The length of the right side whose distal edge migrated showed minimal difference: 189.1 mm (Figure 1A), 189.4 mm (Figure 1B), and 185.4 mm (Figure 1C). Thus, the negligible differences between SG lengths at various intervals served to validate our modeling system.

Table.
Total Length of the Stent Graft and the Distance of the Migration at 3 Time Points
| Time points |
Total length of the stent graft (mm) |
Migration (mm) |
| Left limb side |
Right limb side |
| 5 days after (F1-A) |
227.8 |
189.1 |
0.0 |
| 7 months later (F1-B) |
227.0 |
189.2 |
13.2 |
| 10 months later (F1-C) |
227.0 |
185.4 |
20.6 |
We identified the 3-D coordinates of the distal end of the SGs at each time point after the registration. We estimated the extent of the stent migration by calculating the magnitude of each displacement from the distal edge in
Figure 1A
to the one in
Figures 1B
and
1C: 13.2 mm (Figure 1B) and 20.6 mm (Figure 1C) (Table).
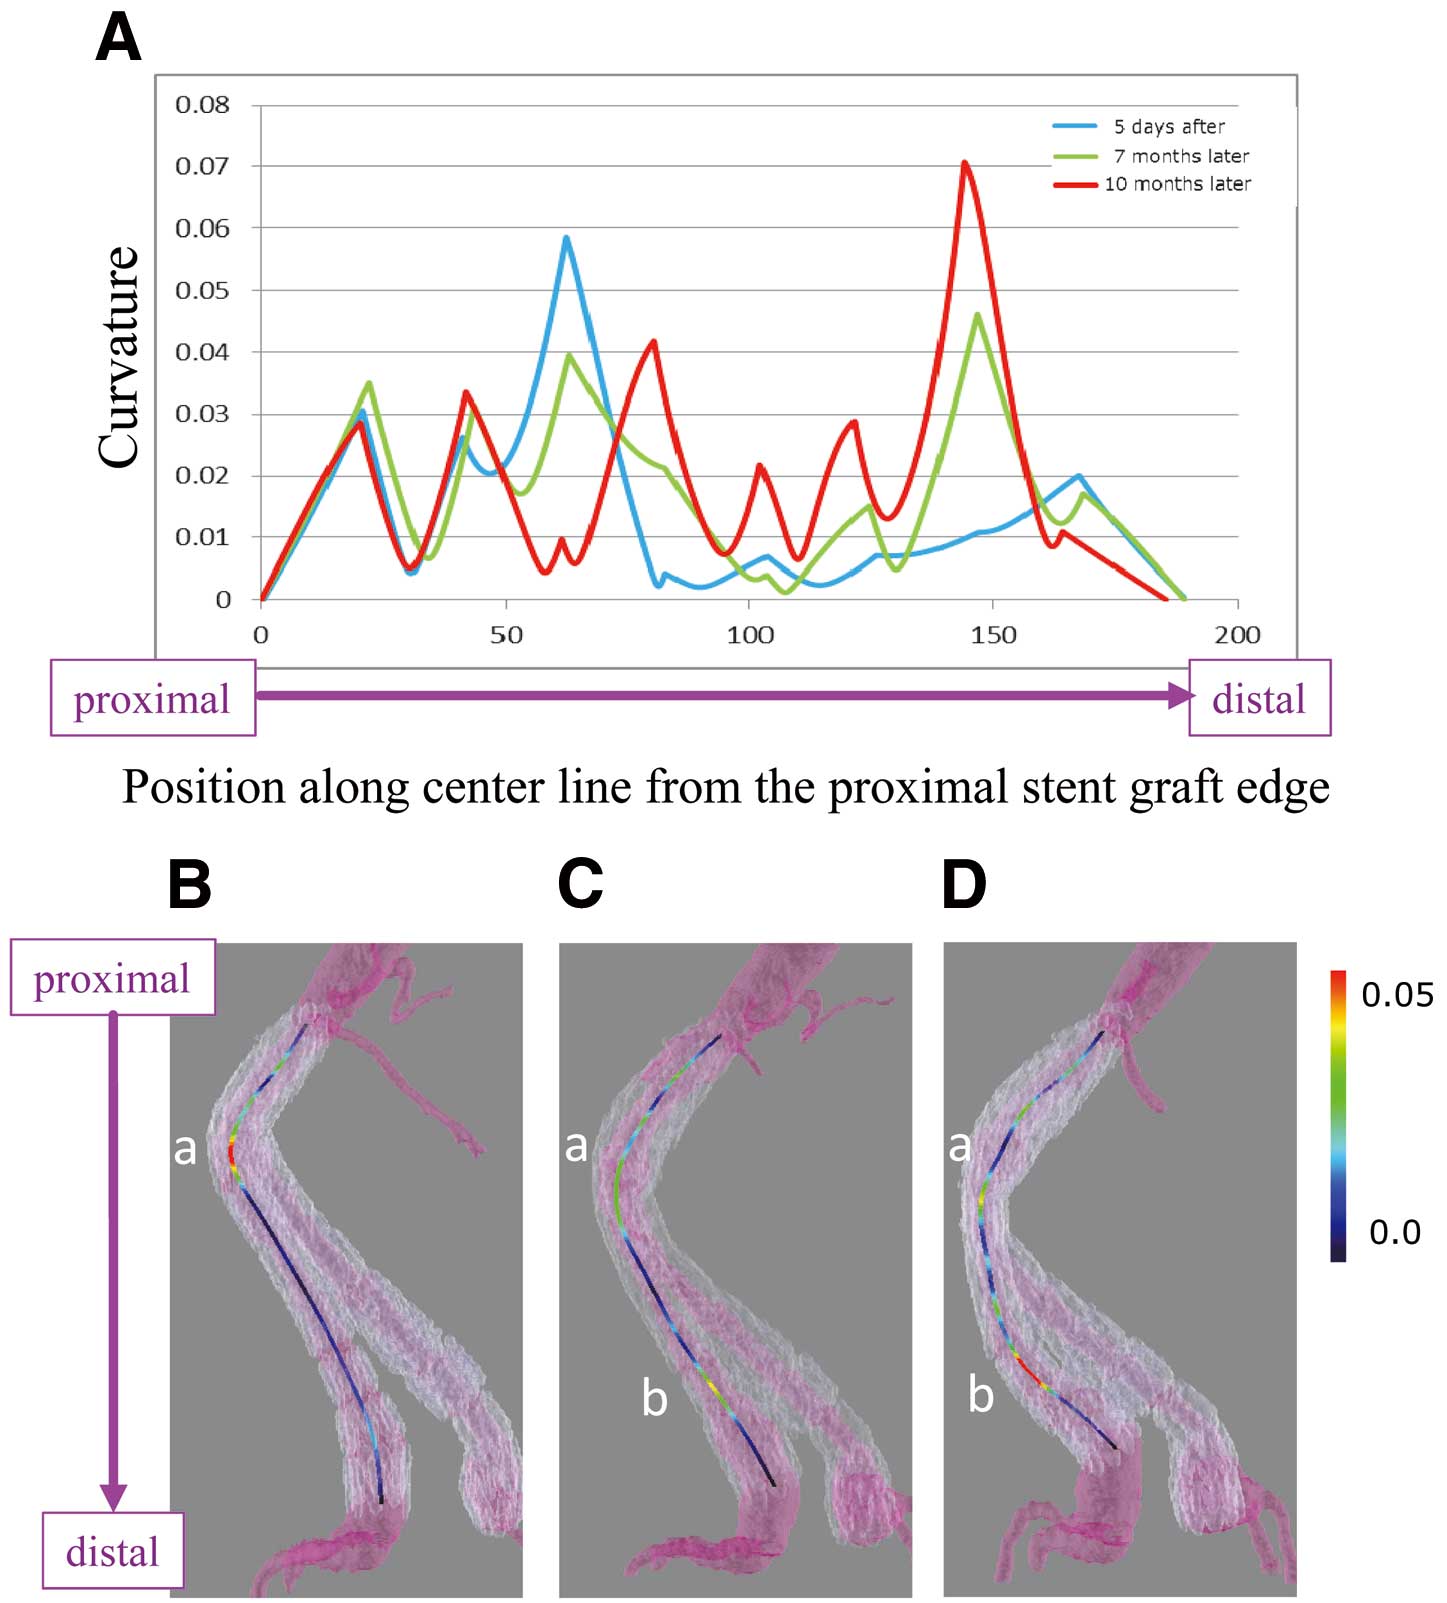
Curvature
The degree of the curvature along the center line was assessed numerically at each time point (Figure 5A). Initially (Figure 1A), the graph of the curvature was unimodal: the peak value was located on the proximal side. Seven months later (Figure 1B), the graph was bimodal and shifted to unimodal again but with the peak located on the distal side (Figure 1C). The curvature was visualized with the color of the center line (Figures 5B–D). The bright color represents the severity of the angulation, and in our case, we can recognize that the most angulated site shifted from the proximal to the distal site.
Torsion
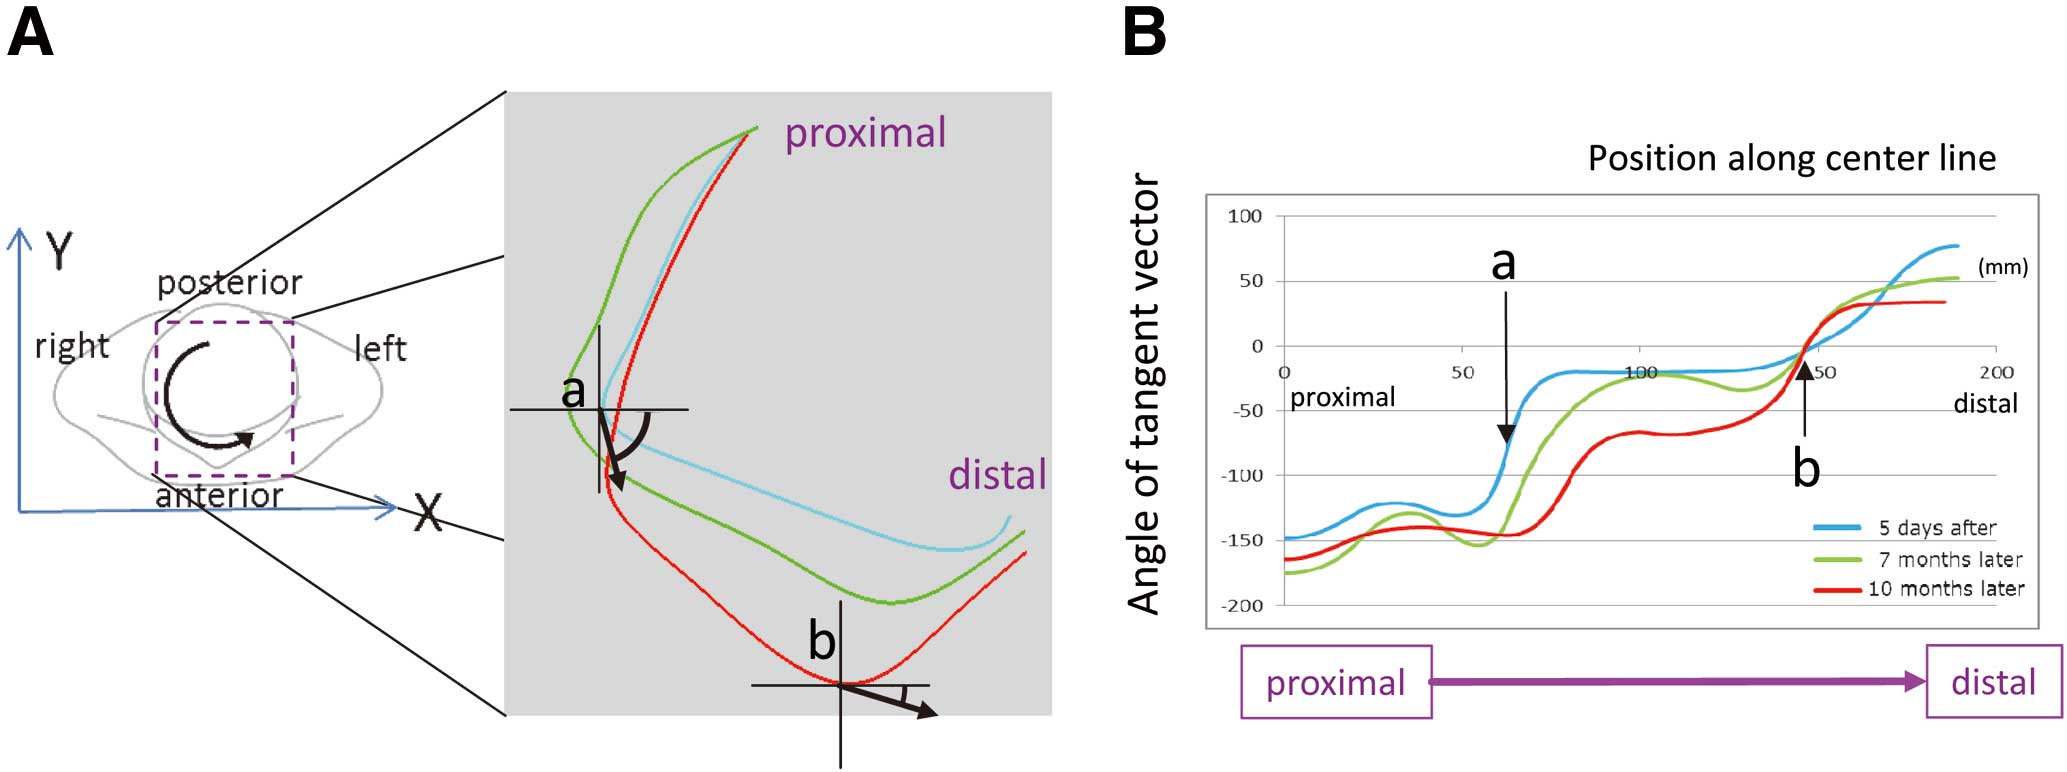
The torsion was also identified based on the helical direction of the center line (Figure 6).
Figure 6A
shows a schematic image of the torsion. If a center line has counterclockwise direction on transverse plane viewed from the head, then the value of the torsion becomes negative, and vice versa. The center lines projected onto the transverse plane at 3 time points showed counterclockwise rotation (Figure 6B). The value of the torsion is shown in
Figure 6C, which had negative values except for the following areas: 41 mm to 62 mm from the proximal SG edge; 83 mm to 103 mm, and from 126 mm to 147 mm in
Figure 1A, 44 mm to 63 mm in
Figure 1B. The helical direction locally reversed in the areas where the torsion was positive. The chronological change of the torsion was visualized with colored center lines based on the torsion value (Figures 6D–F). The reversed helical direction, displayed as a red center line, moved from the proximal to the distal site over time, which might indicate that the helical direction at the proximal site had changed to counterclockwise within 10 months (Figure 1C).

To determine the significance of the torsion, we projected the torsion — the vector using the points on the center line — to the axial plane and constructed a graph of the total length (Figure 7A). The graph demonstrated the most angulated site along the center line at each time point; for example, the peak was 62 mm from the proximal edge in
Figure 1A, and 144 mm in
Figure 1C
(Figure 7B). The initial “wave-like” form tended to become “linear” (averaged) over time.
Discussion
The last decade has seen a rapid development of the SGs that emerged in the 1990s, with the current focus being on the thin-walled design required for minimally invasive procedures. With approximately 100,000 pulses of blood per day, the interaction between such a thin wall and the attached bare stent structure may result in adverse long-term events. For instance, several complications have been reported in the literature: fabric tears, type Ib and III endoleaks, graft limb occlusions, and migrations.16–19
Therefore, it is important to understand the behavior of the implanted SG after EVAR, especially in cases with challenging anatomy.
We have previously examined the configuration changes after SG implantation in AAA cases with a severely angulated neck and found device-specific recoil and straightening tendency.7
Similar neck angulation changes post-implantation were reported by van Keulen et al.12
One of the critical limitations of their study was the manual determination of neck angulation, which was associated with inter-observer variability. In addition, their measurement method was based on a lumen center line, which excluded the intra-sac thrombus. The use of a modeling system in our case-specific study allowed us to conduct a non-biased, post-implantation evaluation of the accuracy and various properties of the SG.
In our model, we first had to confirm the accuracy of the length measurement. At first, the entire SG length could not be optimized; however, by excluding the “noise” (fine-scale structure) derived from the lumen thrombus and smoothing the center line, we were able to obtain a negligible margin of error. The slight shortening of the migrated site should be due to the infolding of the graft fabric, or to the telescoping of the SGs.
After optimizing the SG length, we were able to evaluate accurately the migration length. In past reports, a threshold of approximately 10 mm was used to determine whether a significant migration necessitated a second intervention.3,20
Furthermore, the length measurement method was also unclearly determined. With our method, we can evaluate the degree of migration with its value.
“Curvature” is an ambiguous term when used by endovascular surgeons, as it is mostly used as another word for “angulation”. The aneurysm neck angulation has been defined in various ways,7,18,21,22
which were too ambiguous to evaluate the slight chronological changes post-EVAR, and therefore a 3-D approach was required.7
Furthermore, severe neck angulation is known to be a risk factor for EVAR-related short-term adverse events.3,5,21
Using our successful visualization of the shift in the extreme curvature values and their numeric representation, we might now be able to provide a mechanism explaining the association between severe neck angulation and post-EVAR adverse events.
Torsion is defined as the twisting of an object due to an applied torque in solid mechanics, and the term “torsion” is hardly to be understood from the clinical perspective. In past studies, the tortuosity index had been the only indicator for representing the total aortic torsion and was defined as the lumen center line measurement minus the 3-D straight distance.10,21,23
Although it is simple, it does not necessarily reflect the real tortuosity. Although we were able to calculate the torsion values accurately, their clinical significance was difficult to determine. However, the graph showed that a negative conversion had occurred as the migration developed (after recoiling). The shape of the graph could at least be useful for understanding the trend in SG torsion over time.
Given the torsional stiffness of the SG, we hypothesized that the torsion was unevenly distributed along the SG and would become uniform over time. By projecting the torsion to the axial plane, a transformation of the graph shape from “wavelike” to “linear” was observed over time. This visual representation of the torsional stiffness of the SG may contribute to better understanding of SG behavior.
Regarding the case presented in this study, we are reflecting on overlooking and underestimating the migration at 7 months after the surgery. If the CT images were analyzed with our modeling system, and the changes of migration length and other parameters were revealed numerically, we might be able to perform the re-intervention before the rupture.
Our results may provide a mechanism for the procedures performed intuitively by skilled endovascular surgeons to ensure long-term durability of SGs used in EVAR, such as the flowering technique (delivering the SG along the angulated aneurysmal shape by slow deployment).24
Our report confirms previously reported findings on the critical importance of the positional stability of the SG for ensuring successful long-term outcomes post-EVAR.25
In conclusion, we developed V-Modeler as a versatile model for investigating geometric changes of both arteries and SGs over time, by applying it to an AAA case that was associated with SG limb migration and chronological changes in total device morphology with associated CT imaging data. After optimizing the SG length variability, we evaluated curvature, torsion, and projection. We observed a shift of the peak curvature and torsion over time.
Disclosures
The authors report no conflicts of interest. This research was funded by a Grant-in-Aid for Scientific Research.
References
- 1.
Greenhalgh RM, Brown LC, Kwong GP, Powell JT, Thompson SG; EVAR trial participants. Comparison of endovascular aneurysm repair with open repair in patients with abdominal aortic aneurysm (EVAR trial 1), 30-day operative mortality results: Randomised controlled trial. Lancet 2004; 364: 843–848.
- 2.
Prinssen M, Verhoeven EL, Buth J, Cuypers PW, van Sambeek MR, Balm R, et al. A randomized trial comparing conventional and endovascular repair of abdominal aortic aneurysms. N Engl J Med 2004; 351: 1607–1618.
- 3.
United Kingdom EVAR Trial Investigators,
Greenhalgh RM, Brown LC, Powell JT, Thompson SG, Epstein D, Sculpher MJ. Endovascular versus open repair of abdominal aortic aneurysm. N Engl J Med 2010; 362: 1863–1871.
- 4.
AbuRahma AF, Campbell J, Stone PA, Nanjundappa A, Jain A, Dean LS, et al. The correlation of aortic neck length to early and late outcomes in endovascular aneurysm repair patients. J Vasc Surg 2009; 50: 738–748.
- 5.
Sternbergh WC 3rd, Carter G, York JW, Yoselevitz M, Money SR. Aortic neck angulation predicts adverse outcome with endovascular abdominal aortic aneurysm repair. J Vasc Surg 2002; 35: 482–486.
- 6.
Abbruzzese TA, Kwolek CJ, Brewster DC, Chung TK, Kang J, Conrad MF, et al. Outcomes following endovascular abdominal aortic aneurysm repair (EVAR): An anatomic and device-specific analysis. J Vasc Surg 2008; 48: 19–28.
- 7.
Hoshina K, Hosaka A, Takayama T, Kato M, Ohkubo N, Okamoto H, et al. Outcomes after open surgery and endovascular aneurysm repair for abdominal aortic aneurysm in patients with massive neck atheroma. Eur J Vasc Endovasc Surg 2012; 43: 257–261.
- 8.
Ghouri M, Krajcer Z. Endoluminal abdominal aortic aneurysm repair. Tex Heart Inst J 2010; 37: 19–24.
- 9.
Hoshina K, Kato M, Hosaka A, Miyahara T, Mikuriya A, Ohkubo N, et al. Middle-term results of endovascular aneurysm repair in Japan: Does intraoperative endovascular management against the hostile aneurysmal neck prevent the proximal type I endoleak? Int Angiol 2011; 30: 467–473.
- 10.
Ohrlander T, Sonesson B, Ivancev K, Resch T, Dias N, Malina M. The chimney graft: A technique for preserving or rescuing aortic branch vessels in stent-graft sealing zones. J Endovasc Ther 2008; 15: 427–432.
- 11.
Hoshina K, Akai T, Takayama T, Kato M, Nakazawa T, Okamoto H, et al. Outcomes and morphologic changes after endovascular repair for abdominal aortic aneurysms with a severely angulated neck: A device-specific analysis. Circ J 2013; 77: 1996–2002.
- 12.
van Keulen JW, Moll FL, Arts J, Vonken EP, van Herwaarden JA. Aortic neck angulations decrease during and after endovascular aneurysm repair. J Endovasc Ther 2010; 17: 594–598.
- 13.
Saito T, Toriwaki J. Reverse distance transformation and skeletons based upon the Euclidean metric for n-dimensional digital binary pictures. IEICE Trans Inf Syst 1994; 9: 1005–1016.
- 14.
Rogers DF. An introduction to NURBS: With historical perspective. San Francisco, CA, Morgan Kaufmann Publishers Inc, 2001.
- 15.
Arun KS, Huang TS, Blostein SD. Least-squares fitting of two 3-D point sets. IEEE Trans Pattern Anal Mach Intell 1987; 9: 698–700.
- 16.
O’Flynn PM, O’Sullivan G, Pandit AS. Methods for three-dimensional geometric characterization of the arterial vasculature. Ann Biomed Engineer 2007; 35: 1368–1381.
- 17.
Hobo R, Kievit J, Leurs LJ, Buth J; EUROSTAR Collaborators. Influence of severe infrarenal aortic neck angulation on complications at the proximal neck following endovascular AAA repair: A EUROSTAR Study. J Endovasc Ther 2007; 14: 1–11.
- 18.
Whittaker DR, Dwyer J, Fillinger MF. Prediction of altered endovascular path during endovascular abdominal aortic aneurysm repair with the Gore excluder. J Vasc Surg 2005; 41: 575–583.
- 19.
Handa N, Yamashita M, Takahashi T, Onohara T, Okamoto M, Yamamoto T, et al. Impact of introducing endovascular aneurysm repair on treatment strategy for repair of abdominal aortic aneurysm: National Hospital Organization network study in Japan. Circ J 2014; 78: 1104–1111.
- 20.
Velazquez OC, Woo EY, Carpenter JP, Golden MA, Barker CF, Fairman RM. Decreased use of iliac extensions and reduced graft junctions with software-assisted centerline measurements in selection of endograft components for endovascular aneurysm repair. J Vasc Surg 2004; 40: 222–227.
- 21.
Higashiura W, Kichikawa K, Sakaguchi S, Tabayashi N, Taniguchi S, Uchida H. Accuracy of centerline of flow measurement for sizing of the Zenith AAA endovascular graft and predictive factor for risk of inadequate sizing. Cardiovasc Intervent Radiol 2009; 32: 441–448.
- 22.
Torii R, Oshima M. An integrated geometric modeling framework for patient-specific computational haemodynamic study on wide-range vascular network. Comput Methods Biomech Biomed Engin 2012; 15: 615–625.
- 23.
Albertini J, Kalliafas S, Travis S, Yusuf SW, Macierewicz JA, Whitaker SC, et al. Anatomical risk factors for proximal perigraft endoleak and graft migration following EVAR. Eur J Vasc Endovasc Surg 2000; 19: 308–312.
- 24.
van Keulen JW, Moll FL, Tolenaar JL, Verhagen HJ, van Herwaarden JA. Validation of a new standardized method to measure proximal aneurysm neck angulation. J Vasc Surg 2010; 51: 821–828.
- 25.
O’Flynn PM, O’Sullivan G, Pandit AS. Geometric variability of the abdominal aorta and its major peripheral branches. Ann Biomed Eng 2010; 38: 824–840.