Abstract
Background:
The purpose of this study was to apply an artificial neural network (ANN) in patients with coronary artery disease (CAD) and to characterize its diagnostic ability compared with conventional visual and quantitative methods in myocardial perfusion imaging (MPI).
Methods and Results:
A total of 106 patients with CAD were studied with MPI, including multiple vessel disease (49%), history of myocardial infarction (27%) and coronary intervention (30%). The ANN detected abnormal areas with a probability of stress defect and ischemia. The consensus diagnosis based on expert interpretation and coronary stenosis was used as the gold standard. The left ventricular ANN value was higher in the stress-defect group than in the no-defect group (0.92±0.11 vs. 0.25±0.32, P<0.0001) and higher in the ischemia group than in the no-ischemia group (0.70±0.40 vs. 0.004±0.032, P<0.0001). Receiver-operating characteristics curve analysis showed comparable diagnostic accuracy between ANN and the scoring methods (0.971 vs. 0.980 for stress defect, and 0.882 vs. 0.937 for ischemia, both P=NS). The relationship between the ANN and defect scores was non-linear, with the ANN rapidly increased in ranges of summed stress score of 2–7 and summed defect score of 2–4.
Conclusions:
Although the diagnostic ability of ANN was similar to that of conventional scoring methods, the ANN could provide a different viewpoint for judging abnormality, and thus is a promising method for evaluating abnormality in MPI. (Circ J 2015; 79: 1549–1556)
The role of nuclear medicine in cardiology practice has been detection of induced ischemia with respect to diagnosis and optimal treatment strategy.1–3
In particular, identification of physiological ischemia with exercise or limited flow reserve by vasodilator stress has been a unique feature of nuclear cardiology using myocardial perfusion imaging (MPI). In the initial stages of nuclear cardiac imaging, the purpose was to detect ischemia in patients with unknown coronary artery disease (CAD), leading to coronary angiography (CAG) and intervention. However, today there are many subjects with multiple sites of coronary stenosis, which may potentially induce ischemia, and modification of ischemia by medical treatment and coronary interventions should also be examined to evaluate hemodynamic changes of the coronary flow reserve. Important indications of MPI included determination of the possibilities of ischemia in the distal site of stenosis, residual ischemia after coronary intervention, and restenosis in the follow-up studies. Therefore, classical diagnostic criteria for detection of abnormality using coronary stenosis as the gold standard (eg, ≥75% or 50%) are apparently insufficient.
Although visual evaluation of the perfusion defect and ischemia is the first step in image interpretation, a semiquantitative approach using a 17-segment model has been most commonly utilized.4
The most widely used quantification has been the summed stress score (SSS), summed rest score (SRS), and summed differences score (SDS), which reflect the amount of ischemia and infarction.5–7
These perfusion abnormalities are still the best predictors of cardiac events even when they are compared with a complete diagnostic work-up and with more recent prognostic indicators.8
For quantification using scoring, statistical average and deviation of each segment have been used, and the Japanese Society of Nuclear Medicine working group databases were created to provide common diagnostic criteria.9
Recently, artificial intelligence, such as the artificial neural network (ANN), has been used as a new approach in nuclear medicine.10,11
Unlike the scoring methods, artificial intelligence mimics and learns interpretation of the experts, and diagnostic suggestion is made by probability of abnormality.12
The ANN approach is still in its initial stage, and few studies have used ANN for clinical cardiology practice.
The purpose of this study was to evaluate the diagnostic ability of an ANN system for identifying stress defect and ischemia. The diagnostic ability was compared with the conventional defect scoring methods using expert interpretation of ischemia as the gold standard.
Methods
Subjects
A total of 106 patients who underwent CAG within 1 month of MPI were consecutively enrolled in 3 hospitals; Matto Ishikawa Central Hospital, Kanazawa Cardiovascular Hospital, and Kanazawa University Hospital. Patient demographics are shown in
Table 1. The mean age was 70±10 years and males comprised 61% of patients. CAG was performed according to the clinical practice of each hospital, even for initial diagnostic evaluation and follow-up studies after therapeutic interventions. When the number of vessels for coronary stenosis ≥50% was defined as abnormal, 25, 29, 30, and 22 patients had 0, 1-, 2-, and 3-vessel disease, respectively, so multivessel disease was diagnosed in 49% of the patients. There was a history of myocardial infarction (MI) in 27% of the patients, and percutaneous coronary intervention (PCI) and coronary artery bypass grafting (CABG) were performed in 28% and 2% of the patients, respectively. Patients with left bundle branch block and arrhythmia that caused inappropriate electrocardiographic gating were excluded.
Table 1.
Demographics of Patients With CAD Studied With Myocardial Perfusion Imaging
| |
Mean±SD (range), n (%) |
| Age (years) |
70±10 (44–87) |
| Male sex |
65 (61%) |
| Height, weight (male) |
165±7 cm, 65±11 kg |
| Body mass index (male) |
24.0±3.3 kg/cm2 |
| Height, weight (female) |
152±7 cm, 53±8 kg |
| Body mass index (female) |
23.4±3.8 kg/cm2 |
| Exercise stress |
93 (89%) |
| No. of vessels (0,1,2,3VD) |
| ≥75% stenosis |
35:35:27:9 (MVD 34%) |
| ≥50% stenosis |
25:29:30:22 (MVD 49%) |
| Hypertension |
61 (58%) |
| Diabetes mellitus |
35 (33%) |
| Dyslipidemia |
38 (36%) |
| History of MI |
29 (27%) |
| History of PCI/CABG |
30 (28%), 2 (2%) |
| ANN value of stress defect |
0.65±0.40 (0–1) |
| Consensus of stress defect |
74 (70%) |
| ANN value of ischemia |
0.35±0.45 (0–1) |
| Consensus of ischemia |
39 (37%) |
| SSS |
8.0±8.7 (0–34) |
| SRS |
5.5±7.5 (0–35) |
| SDS |
3.2±3.6 (0–17) |
| End-diastolic volume (ml) |
104±27 (58–186) |
| Ejection fraction (%) |
68.8±9.1 (38–86) |
ANN, artificial neural network; CABG, coronary artery bypass grafting; MI, myocardial infarction; MVD, multivessel disease; PCI, percutaneous coronary intervention; SDS, summed differences score; SRS, summed rest score; SSS, summed stress score; VD, vessel disease.
Patients’ clinical information, including the latest CAG, results of baseline left ventricular (LV) function, complications, and status of PCI and CABG (stenosis/restenosis in coronary arteries, stents and bypass graft), was registered in each hospital. All the clinical data were completely anonymized, and nuclear images were sent to the core laboratory of Kanazawa University in Digital Imaging and Communications in Medicine (DICOM) format. The ethics committee of Kanazawa University approved the study, and institutional review boards at the 2 other hospitals also approved participation in the study.
MPI
MPI with either 99mTc-MIBI or tetrofosmin was performed with a stress-rest protocol using 300–400 MBq for the first study and 600–800 MBq for the second study. The indications and stress protocols followed the guidelines of the Japanese Circulation Society.13
Exercise stress was used for 89% of the patients with symptom-limited ergometer exercise. The remaining patients (11%) underwent adenosine stress with standard continuous injection protocols of 0.12 mg·kg−1·min−1. All 3 hospitals used a dual-headed single-photon emission computed tomography (SPECT) system equipped with low-energy collimators. ECG-gated images were obtained in 16 frames per cardiac cycle. Acquisition energy setting was 140 keV with a 20% window fitted for 99mTc. Attenuation correction and scatter correction were not utilized. Standard short-axis and vertical and horizontal long-axis images were reconstructed and short-axis images were sent to the core laboratory.
Scoring Methods and LV Function
The scoring method used a software algorithm developed by EXINI Diagnostics (Lund, Sweden) with the collaboration of FUJIFILM RI Pharma (Tokyo, Japan) and Kanazawa University (cardioREPO/EXINI heart). The scoring method was based on a 17-segment model and 5-grade points (0, normal; 1, slight decrease; 2, moderate decrease; 3, severe decrease; and 4, complete defect). The Japanese Society of Nuclear Medicine working group databases were utilized to classify the severity of the defects.9
The scoring was based on a threshold method using the average segmental counts and variations. The best-fitted thresholds were decided upon by incorporating optimal maximum-count normalization and subsegmental scores using a Japanese patient group at Kanazawa University.14
The scoring method in this study was compared with the conventional scoring method using QPS software (Cedars Sinai Medical Center, Los Angeles, CA, USA).
LV functional evaluation was performed, including ejection fraction (EF), and the end-diastolic and end-systolic volumes. The edge-detection algorithm used an active shape model for delineating ventricular edges and a small heart algorithm fitted for Japanese subjects.15,16
ANN for Detecting Ischemia
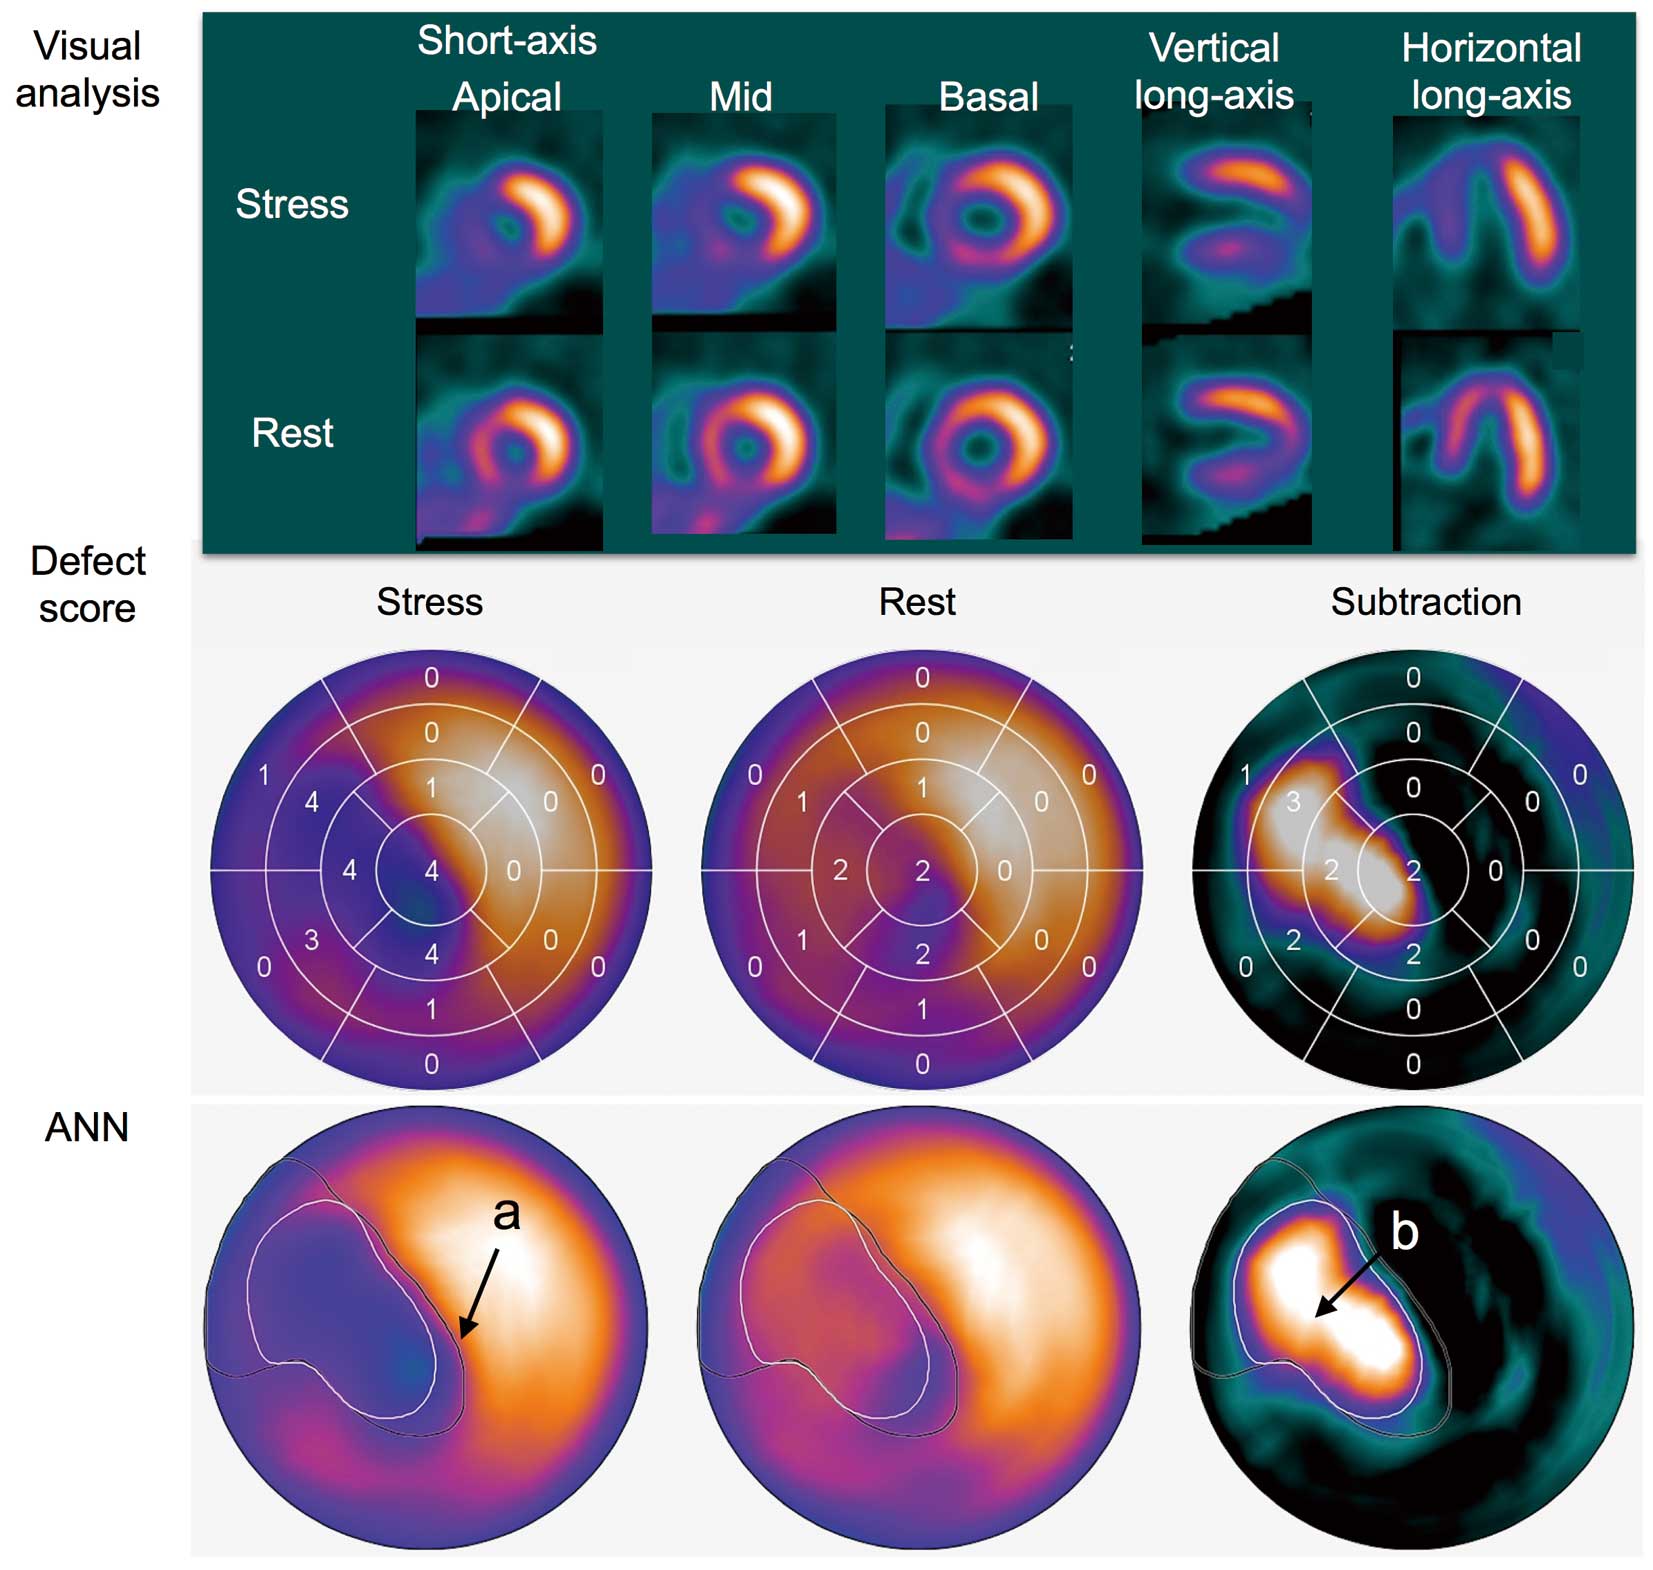
The first step of the analysis was segmentation of the LV, which was performed using a 3D heart-shaped model and the short-axis slice images. Detection of ischemia was performed in 2 ways.11
The area of possible perfusion abnormality in the stress images (stress defect) was segmented using a method mimicking the analysis of physicians who perform visual interpretation of defects. The subtraction image of stress and rest images was created to detect and localize stress-induced ischemia. Features judging the possible perfusion abnormality were analyzed, and included extent, shape, localization, and comparison of count levels with normal stress perfusion databases. The features describing the size and severity of stress defects were calculated in the 3D segmentation of the LV and not in the polar maps in order to avoid the geometrical distortion of these plots. These features were used as input for the ANN system. The training group for SPECT-MPI cases included normal and perfusion defects and was classified by experienced physicians, in which 1,051 patients (498 male and 553 female subjects, 62±10 years, range 29–89 years) were included. In the final output, the ANN value indicated the probability of abnormality; namely, abnormalities of stress defect and ischemia based on stress image and subtraction images, respectively.
Reference of Ischemia and Abnormality in Stress Condition
Final visual judgment of stress abnormality and ischemia was based on the consensus of ≥3 experienced nuclear medicine physicians. In the first evaluation, original short-axis images and polar map were presented with only information of age and sex. Then LV function, including volumes and EF, was added, and subsequently all information of the CAG stenosis, presence of restenosis, and location of stents or bypass grafts was added. The judgment was made in order to classify the information into 4 grades: definitely normal, probably normal, probably abnormal, and definitely abnormal. Existence of stress abnormality and stress-induced ischemia was thus based on an integrated understanding of the coronary stenosis and existence of MI, which was similar to clinical diagnostic procedures for the existence of ischemia.
Apart from the expert visual evaluation, diagnostic accuracy based on coronary stenosis ≥50% as the diagnostic gold standard was also examined in a group of patients without MI and PCI (n=53). In a subgroup of patients with 1-vessel disease who had neither MI nor PCI, detectability of abnormality based on consensus, defect score, and ANN was compared.
Statistical Analysis
All values are expressed as mean±standard deviation (SD). The difference among groups was examined by 1-way analysis of variance with F test and t-test. Nonparametric analysis in multiple comparisons using the Wilcoxon method was also utilized to support the significant differences for each pair. Correlation coefficient and linear regression lines were calculated to compare scores between software programs. Receiver-operating characteristic (ROC) analysis was performed and the area under the curve (AUC) was calculated to evaluate diagnostic ability. A P value <0.05 was considered significant. Statistical analysis was performed using JMP 10.0.2 software (SAS Institute Inc, Cary, NC, USA).
Results
Evaluation of Scores in Comparison With QPS
When the SSS of cardioREPO (y) was compared with that of QPS (x), good correlation was observed between both methods: y=0.099+1.059*x (R2=0.86, P<0.0001). When the SRS and SDS with cardioREPO (y) were compared with those with QPS (x), the correlation of both methods was also good: y=0.465+1.109*x (R2=0.84, P<0.0001) and y=0.458+0.927*x (R2=0.71, P<0.0001), respectively. Classification into 2 groups of SSS ≥8 and SSS <8 resulted in complete agreement in 81 (76%) of 106 patients. Similarly, classification into 2 groups of SDS ≥4 and SDS <4 showed complete agreement in 87 (82%) of the patients.
Consensus for Stress Defect
Regarding the stress defect, groups with definitely normal, probably normal, probably abnormal, and definitely abnormal groups were compared for ANN and SSS values (Table 2A). The ANN values differed significantly among the 4 groups (F ratio 283, P<0.0001), and the SSS also differed significantly (F ratio 59, P<0.0001).
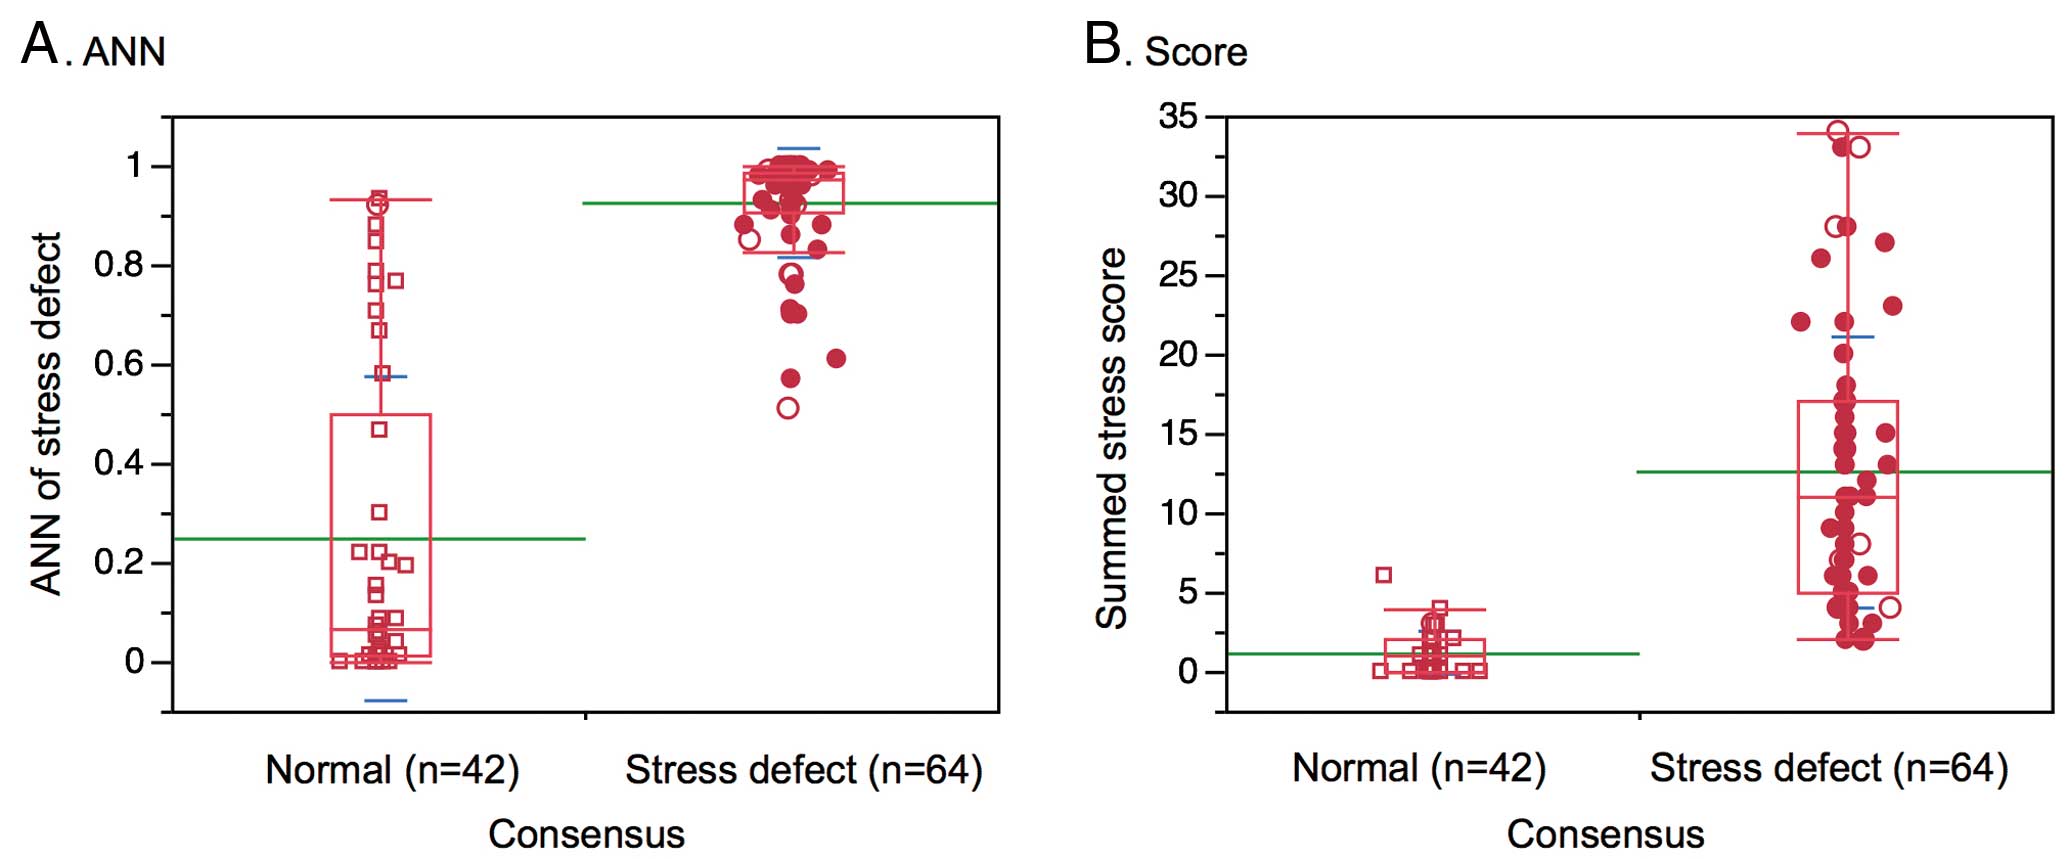
Figure 1
shows the results when patients were classified as normal (n=42) or abnormal (n=64). Regarding the ANN value, the normal and abnormal groups showed 0.25±0.32 and 0.92±0.11 (F ratio 237, P<0.0001) and for the SSS value, the 2 groups showed 1.1±1.4 and 12.5±8.6 (F ratio 73, P<0.0001), respectively.
Table 2.
ANN Values and Defect Scores in 4 Groups of Expert Visual Evaluation of Ischemia
| Expert interpretation |
n |
ANN (mean±SD) |
Defect score* |
| A. Stress defect |
| Definitely normal |
29 |
0.064±0.11 |
0.48±0.83 |
| Probably normal |
13 |
0.65±0.27 |
2.4±1.4 |
| Probably abnormal |
30 |
0.86±0.14 |
7.0±4.5 |
| Definitely abnormal |
40 |
0.98±0.03 |
17.4±8.4 |
| B. Stress-induced ischemia |
| Definitely normal |
39 |
0.0±0.0 |
0.36±0.58 |
| Probably normal |
15 |
0.016±0.062 |
1.9±1.0 |
| Probably abnormal |
21 |
0.59±0.41 |
4.4±2.6 |
| Definitely abnormal |
31 |
0.78±0.39 |
6.4±4.1 |
*Defect scores are SSS for stress defect and SDS for stress-induced ischemia. Abbreviations as in Table 1.
With respect to stress-induced ischemia detected by the subtraction images, groups with definitely normal, probably normal, probably ischemia, and definitely ischemia were compared (Table 2B). Both the ANN value (F ratio 56, P<0.0001) and the SDS (F ratio 34, P<0.0001) differed significantly among the groups.
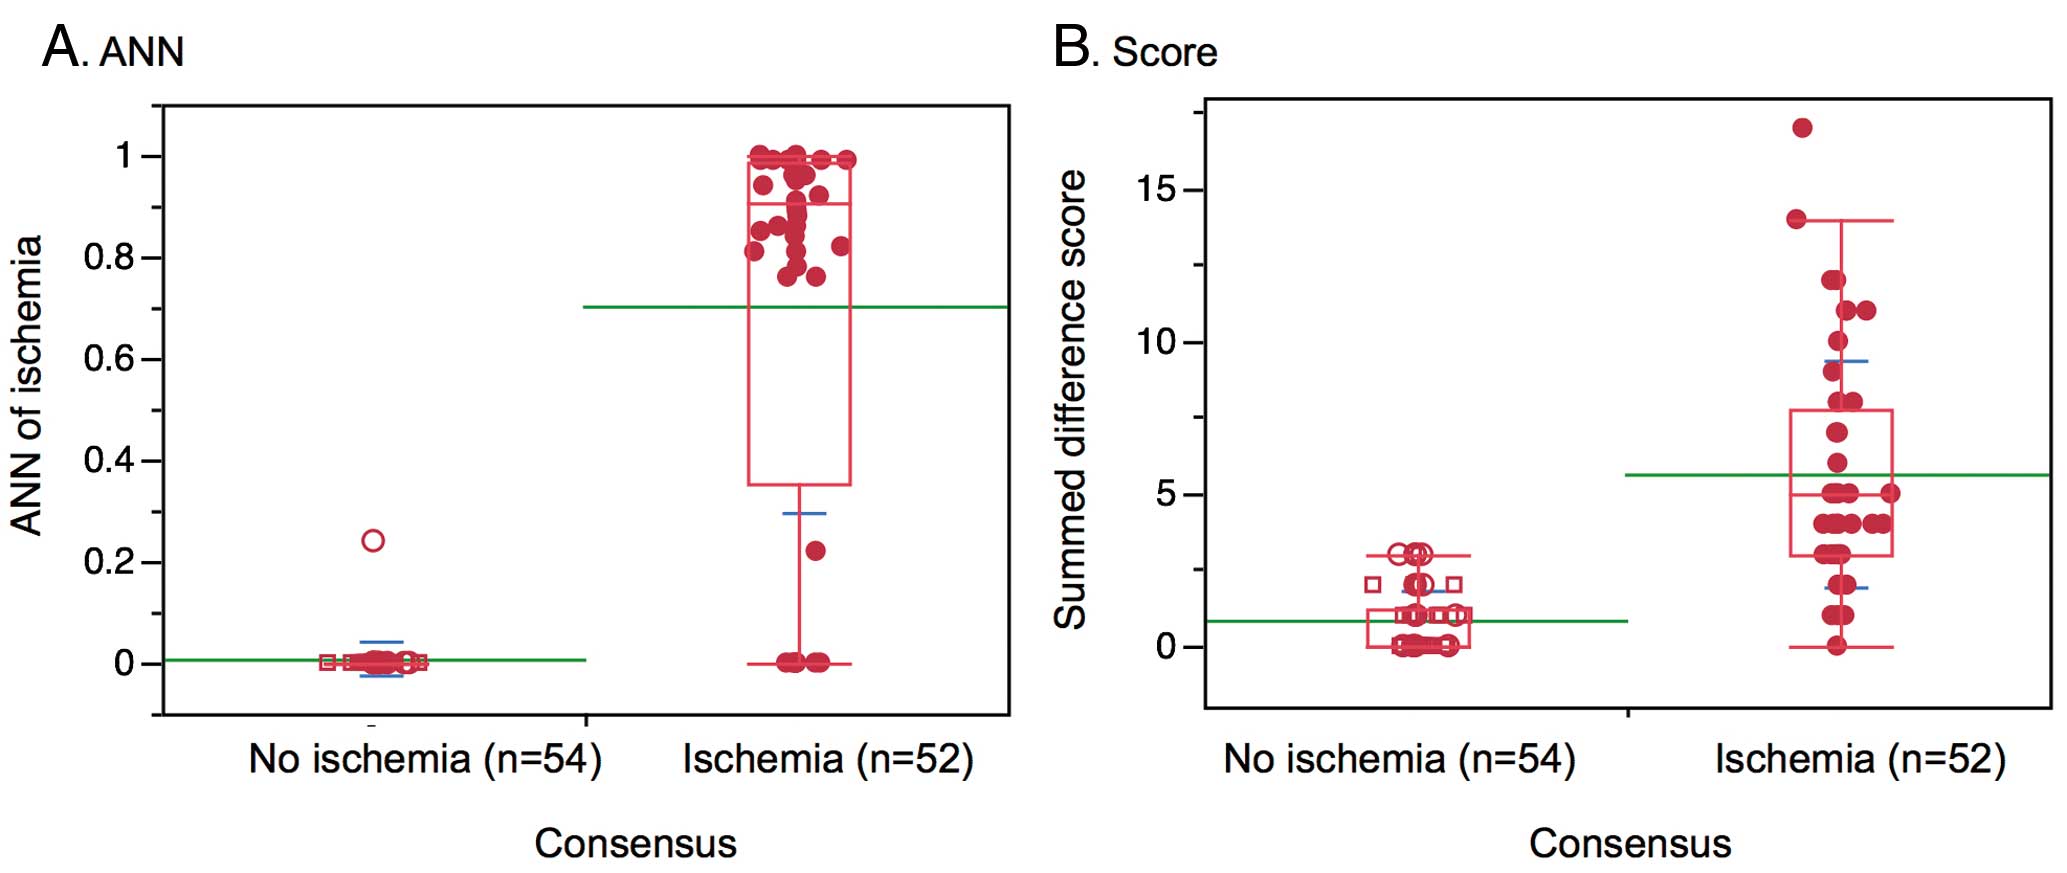
Figure 2
shows results when the patients were classified as normal (n=54) or abnormal (n=52). The normal and abnormal groups showed ANN values of 0.004±0.033 and 0.70±0.40 (F ratio 159, P<0.0001) and for the SDS values, the 2 groups showed 0.80±1.02 and 6.0±3.7 (F ratio 84, P<0.0001), respectively.
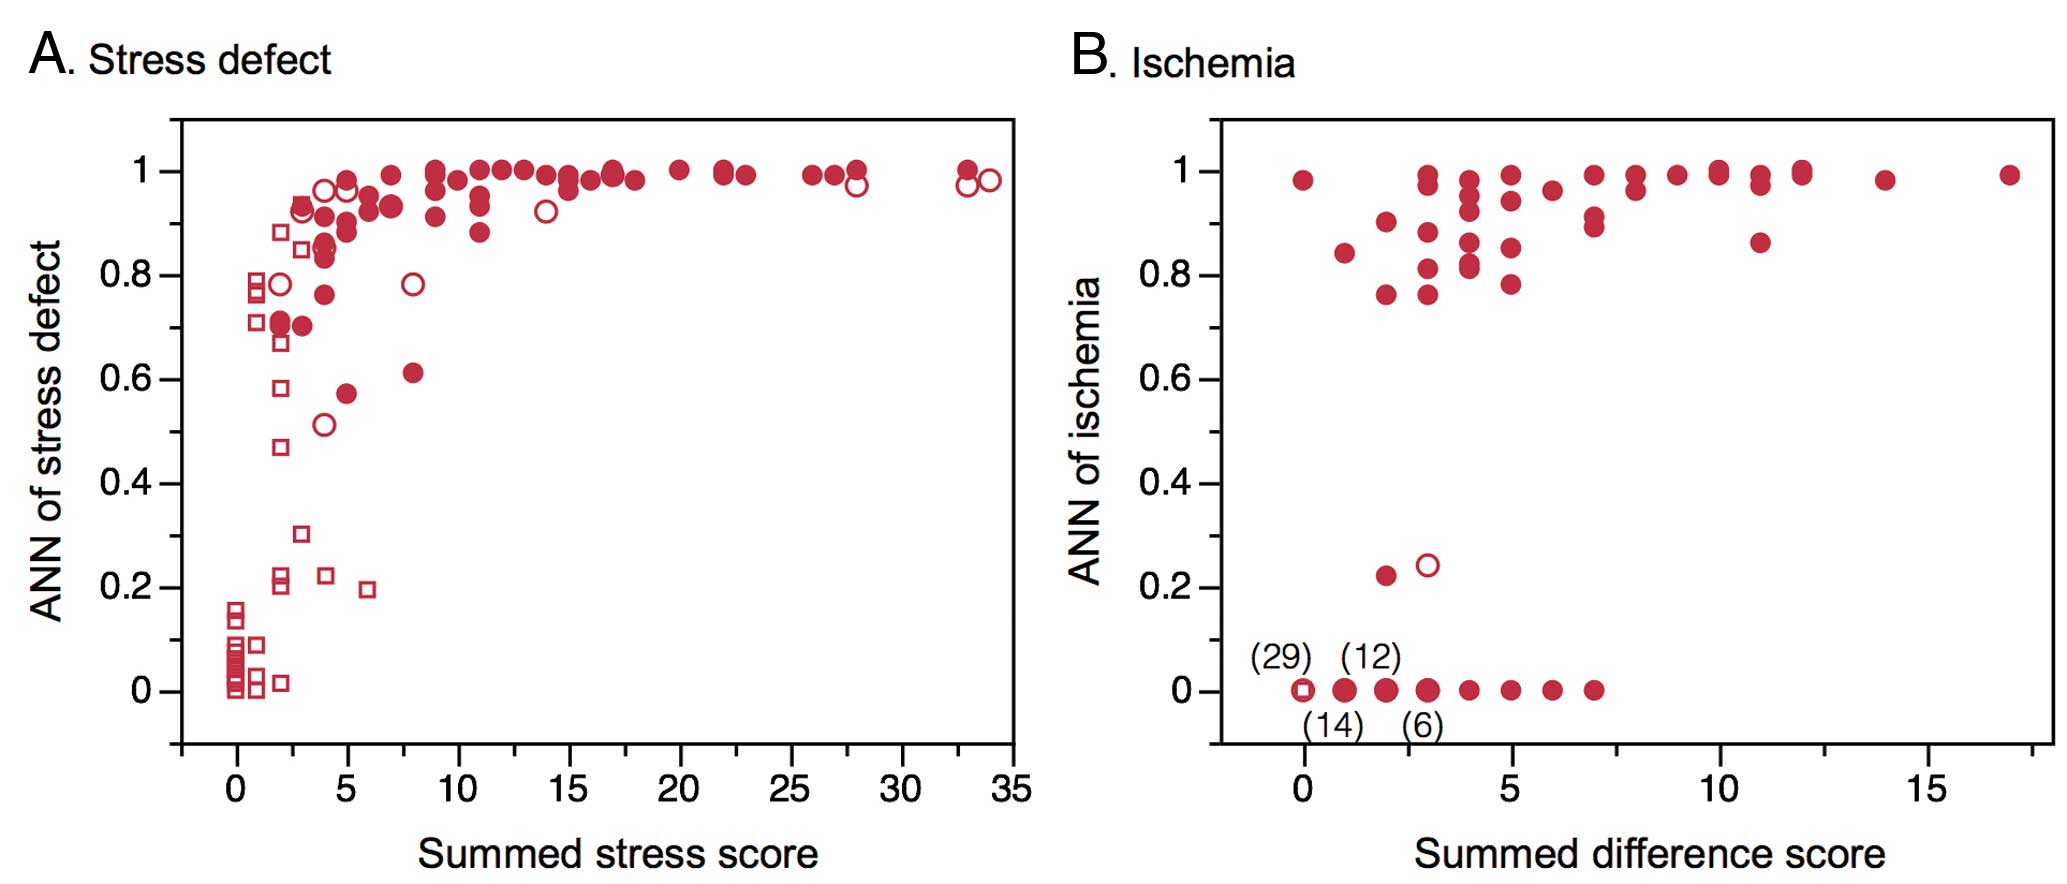
The relationship between the ANN and stress defect is shown in
Figure 3. The ANN value increased steeply from SSS=2–7 and reached plateau when SSS was ≥8. However, 55 data points were clustered on SDS=0–3 and ANN=0.0, while high ANN values >0.8 were distributed in a range of SDS ≥4. When QPS and cardioREPO were compared for the 2 groups of SSS ≥8 and <8, agreement of scores between both software programs was obtained in 91 of 106 (86%) patients, including 57 (54%) for SSS <8, and 34 (32%) for SSS ≥8. Similarly, when the 2 groups of SDS ≥4 and <4 were compared, complete agreement of scores was observed in 87 patients (82%), including 61 (58%) for SDS <4 and 26 (25%) for SDS ≥4.
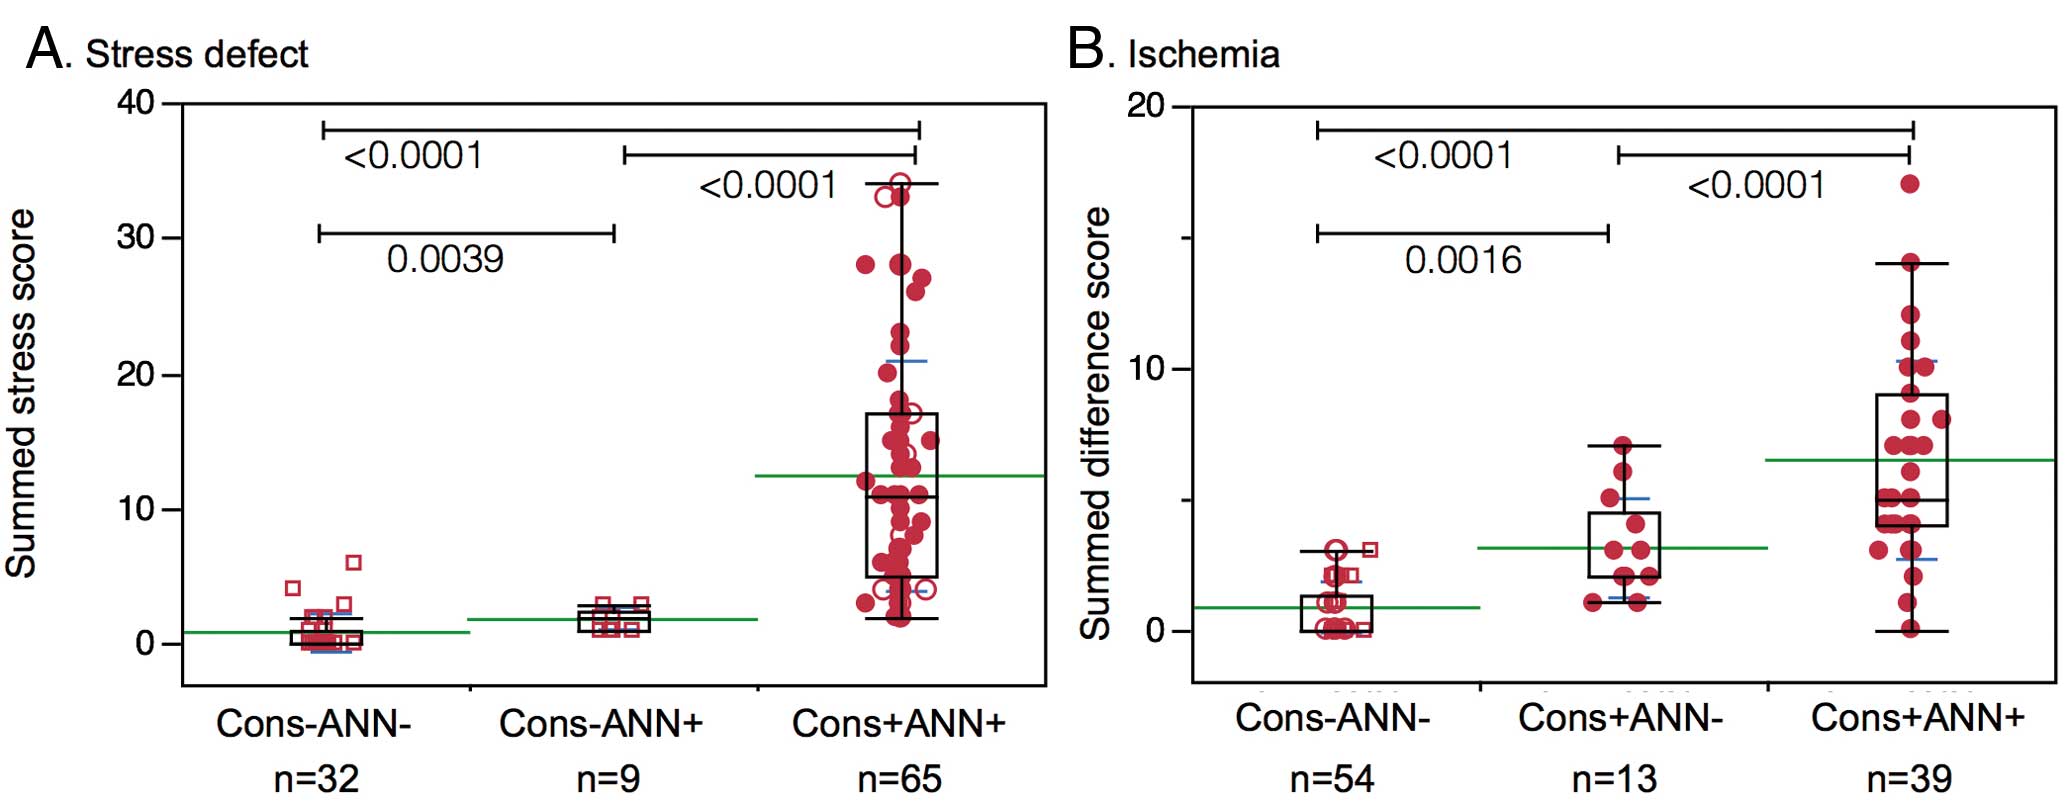
Disagreement between consensus reading and ANN value was examined.
Figure 4
shows the relationship among groups of results based on consensus and the ANN or defect scores. In groups of agreement of no stress defect (n=32) and stress defect (n=65), SSS was 0.81±1.40 and 12.4±8.6 (P<0.0001), respectively. However, the discrepant group of positive ANN with negative consensus showed SSS of 1.8±0.8, and the SSS was comparable to that for the group of agreement in the no-ischemia group. In groups of agreement of no-ischemia (n=54) and ischemia (n=39), SDS was 0.80±1.02 and 6.4±3.8, while the discrepant group of the negative ANN with positive consensus showed SDS of 3.1±1.9.
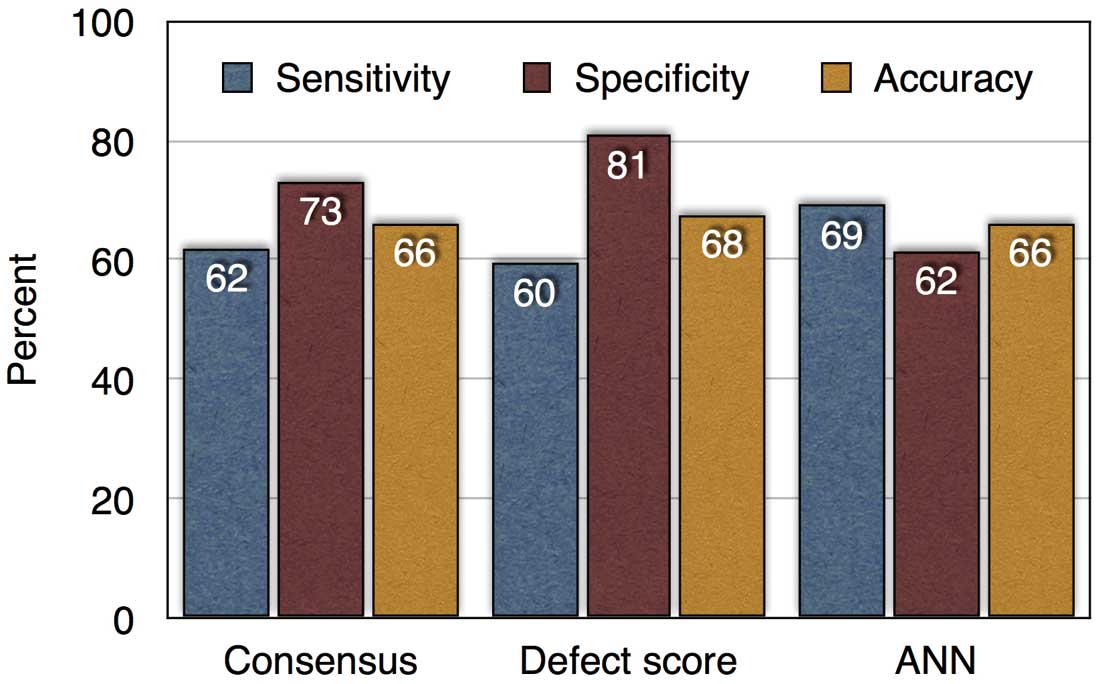
An additional analysis was performed based on conventional diagnostic criteria using ≥50% coronary stenosis as the gold standard in patients who had neither MI nor PCI (n=68). The patient-based sensitivity and specificity for the expert visual diagnosis, for the defect score of SSS ≥4, and for ANN >0.5 were compared (Figure 5). The overall diagnostic accuracy was 66%, 68%, and 66% for the consensus judgment, defect score, and ANN methods, respectively (P=NS). In the subgroup of 1-vessel disease (n=21), the detectability of abnormality for ≥50% stenosis was 48%, 48%, and 57% for the consensus judgment, defect score, and ANN method, respectively (P=NS). Similarly, the detectability of abnormality for ≥75% stenosis was 58%, 54%, and 63%, respectively (P=NS). Thus, the ANN approach showed comparable diagnostic accuracy to conventional methods using coronary stenosis as the gold standard.
ROC analysis was performed for stress defect and ischemia using the consensus agreement as the gold standard. The ROC AUC for stress defect was 0.971 by ANN and 0.980 by SSS (P=NS), whereas it was 0.882 by ANN and 0.937 by SDS (P=NS). In addition, when the QPS software was used, ROC AUC was 0.943 by SSS, and 0.914 by SDS.
Figure 6
shows a patient with 1-vessel disease and how the defect scoring and ANN system interpreted the images for the detected ischemic area.
Discussion
Artificial intelligence (ie, ANN) was applied to identify myocardial ischemia in this study, and the results were compared with a conventional scoring method using expert reading as the gold standard. The results showed that the ANN provided comparable diagnostic accuracy to the conventional method. The characteristics of judging abnormality by the ANN, however, were quite different from the conventional threshold-based scoring method.
Major difference among visual evaluation, scoring method, and the ANN system should be considered. The scoring method has been based on statistics of mean and deviation in each myocardial segment or pixel-based regional counts.17–19
The threshold of abnormality has been empirically determined, because the original scoring method using SSS, SRS, and SDS is based on visual interpretation.20
In other words, the threshold was adjusted so that similar results were obtained from visual scores. As Garcia et al discuss on Gorry’s reference in their review article, statistical programs cannot “understand” their problem areas, cannot “discuss” their knowledge with the user and have no means of “explaining” it to physicians.12,21
The ANN system may potentially offer a natural environment similar to the judgment provided by well-trained physicians, but further progress is required to reach it a level of human expertise.
In the main analysis, the gold standard of the judgment by the ANN was not significant coronary artery stenosis ≥50% or ≥75%, which has been used as the basis for diagnostic ability of CAD in a number of studies. However, even with 75% stenosis, induced ischemia may not appear in the myocardium not because of a limitation of the method or false-positive results but because of physiologically preserved flow reserve. Multiple factors, such as the length and degree of stenosis, collateral circulation, effect of PCI and CABG, and successful medications, could modify regional coronary flow reserve. Limited flow reserve in the border zone of an old MI may also influence the area of induced ischemia. We used all possible information for diagnosing ischemia, including coronary artery stenosis, status of PCI, LV function and history of old MI and diabetes. Considering the clinical settings in which to utilize MPI, existence of these associated findings has sometimes been known before MPI, and additional information of ischemia is expected to assist with possible therapeutic decisions. Therefore in this study, considering our clinical practice related to MPI, we used integrated criteria for the final judgment of perfusion defects. However, even when conventional diagnostic criteria such as 50% or 75% stenosis were used as the gold standard, overall diagnostic accuracy was comparable among the consensus visual analysis, defect score, and ANN methods (66–68%). The results may support extrapolating the validity of visual judgment and ANN values to patients with MI and revascularization.
It is interesting to note that the probability of ischemia was not linearly correlated to scoring values. The probability of stress-defect abnormality, namely the ANN value, increased rapidly when SSS increased from 0 to 5. When the SSS is higher than 5, the human interpreters consider it is definitely abnormal (high probability), for example, even when the SSS is 8 or 16. To diagnose the existence of induced ischemia, half of the data points were located in the plot range of ANA=0 and SDS 0–2, and high ANN values near 1.0 were observed in the range of SDS ≥4. Because a slight overestimation of the stress defect and a slight underestimation of ischemia were seen in this study, retraining the neural network system in accordance with our clinical practice might be indicated to improve the quality of judgment by the ANN. However, even in the present diagnostic system, the differences between the scoring and ANN systems would be beneficial in judging the abnormality from different viewpoints.
The ANN system might be used as a second opinion from artificial intelligence, particularly when physicians are inexperienced in interpreting nuclear cardiology imaging. Even when the ANN values are around 0.50, the output of borderline is presented to physicians, which is not common in conventional software programs. By using the computer guide, variations of the interpretation became significantly smaller.22
High-quality diagnostic suggestions for the existence of abnormality provided by computer software would be beneficial as a reference in standardizing image interpretation. Although the diagnostic value of the scoring system have been validated in a number of studies, the scoring ability may differ among commercially available software packages and cannot be used interchangeably even if the detectability of CAD is comparable.14,23–25
The European Society of Cardiology, however, has published guidelines on revascularization and recommends that 10% ischemia, which corresponds to score 7 of 68, is a threshold of the benefits for revascularization and medical treatment.26
Japanese studies have also demonstrated that 10% abnormality in perfusion as assessed by a scoring method can be an important threshold for evaluating future cardiac events.13,27–30
Although our study included MI in 27% of the patients, cardioREPO and QPS showed a comparable diagnostic threshold using SSS=8 and SDS=4.
The diagnostic ability might be potentially influenced by the training databases. Johansson et al presented their initial evaluation of the EXINI heart using the ANN system in comparison with PERFEX (Emory cardiac Toolbox).11
They reported high diagnostic accuracy with EXINI’s ANN system with 70% sensitivity and 93% specificity to find ischemia, and 84% sensitivity and 84% specificity to find the abnormal study. They included a broad spectrum of diseases, with disease prevalence of 30% according to their clinical routine. On the other hand, our study included patients who underwent CAG showing higher risk for myocardial ischemia because of multivessel diseases. Although detection of ischemia in our study seemed to underestimate the degree of ischemia, the patient selection bias might have influenced the detectability. The training databases are an important factor of the ANN system. Although the ANN system was trained using Swedish databases and based on Swedish expert interpretation of images, comparable diagnostic accuracy was obtained in this Japanese study, probably because the detection of ischemia was based on differences between stress and rest. However, to fit better with Japanese clinical practice and our daily interpretation of the existence of ischemia, retraining of the ANN system might be indicated with a large number of patient groups. Comparable retraining of the neural network system using Japanese databases successfully enhanced diagnostic ability in bone scan interpretation using the ANN.31
Study Limitations
This study included complicated patients, including multivessel disease, history of MI, and coronary revascularization. However, the diagnostic ability regarding significant stenosis (eg, ≥50% stenosis) as the gold standard, also showed comparable diagnostic ability between the experts and the ANN. As approximately 30% of the patients already had MI, and the mean SDS was 3.2±3.6, the score corresponding to pure 10% ischemia could not be defined. As discussed, retraining of the ANN system with Japanese databases may enhance the diagnostic ability if a new project including a larger number of patients, in the order of >1,000 patients, is designed. Location of the coronary artery territory was not included for the training of the ANN system at present. Although it could be included in the training process, strict correspondence should be performed with coronary computed tomography and MPI fusion imaging. Finally, clinical information and LV function could be included as input features, which is a comparable situation to clinical decision-making.
Conclusions
The neural network system was applied to the diagnosis of stress defect and ischemia in MPI. The diagnostic ability was comparable to expert visual interpretation and conventional scoring methods. Even when significant coronary stenosis was used as the gold standard in patients without MI and revascularization, the diagnostic ability of the ANN was comparable to that of the conventional methods. The ANN value provided probability of abnormality, mimicking the process of human interpretation, and the ANN system could provide diagnostic suggestions from a different viewpoint than the statistical scoring method. We conclude that the ANN system could be a promising new adjunctive method for the detection of myocardial ischemia.
Acknowledgments
The authors thank the technologists of Kanazawa University Hospital, Matto Ishikawa Central Hospital, and Kanazawa Cardiovascular Hospital for their cooperation in accumulating the DICOM data. We also thank Mr Ronald Belisle for his editorial assistance.
Disclosures
Conflict of interest: K. Nakajima has a collaborative research work with FIJIFILM RI Pharma Co Ltd (Tokyo, Japan) for the development of software programs. K. Nyström and L.E. are employed by and are shareholders of EXINI Diagnostics AB (Lund, Sweden).
References
- 1.
Hachamovitch R, Hayes SW, Friedman JD, Cohen I, Berman DS. Comparison of the short-term survival benefit associated with revascularization compared with medical therapy in patients with no prior coronary artery disease undergoing stress myocardial perfusion single photon emission computed tomography. Circulation 2003; 107: 2900–2907.
- 2.
Boden WE, O’Rourke RA, Teo KK, Hartigan PM, Maron DJ, Kostuk WJ, et al. Optimal medical therapy with or without PCI for stable coronary disease. N Engl J Med 2007; 356: 1503–1516.
- 3.
Shaw LJ, Berman DS, Maron DJ, Mancini GB, Hayes SW, Hartigan PM, et al. Optimal medical therapy with or without percutaneous coronary intervention to reduce ischemic burden: Results from the Clinical Outcomes Utilizing Revascularization and Aggressive Drug Evaluation (COURAGE) trial nuclear substudy. Circulation 2008; 117: 1283–1291.
- 4.
Cerqueira MD, Weissman NJ, Dilsizian V, Jacobs AK, Kaul S, Laskey WK, et al. Standardized myocardial segmentation and nomenclature for tomographic imaging of the heart: A statement for healthcare professionals from the Cardiac Imaging Committee of the Council on Clinical Cardiology of the American Heart Association. Circulation 2002; 105: 539–542.
- 5.
Klocke FJ, Baird MG, Lorell BH, Bateman TM, Messer JV, Berman DS, et al. ACC/AHA/ASNC guidelines for the clinical use of cardiac radionuclide imaging – executive summary: A report of the American College of Cardiology/American Heart Association Task Force on Practice Guidelines (ACC/AHA/ASNC Committee to Revise the 1995 Guidelines for the Clinical Use of Cardiac Radionuclide Imaging). Circulation 2003; 108: 1404–1418.
- 6.
Slomka PJ, Nishina H, Berman DS, Akincioglu C, Abidov A, Friedman JD, et al. Automated quantification of myocardial perfusion SPECT using simplified normal limits. J Nucl Cardiol 2005; 12: 66–77.
- 7.
Sharir T, Germano G, Kang X, Lewin HC, Miranda R, Cohen I, et al. Prediction of myocardial infarction versus cardiac death by gated myocardial perfusion SPECT: Risk stratification by the amount of stress-induced ischemia and the poststress ejection fraction. J Nucl Med 2001; 42: 831–837.
- 8.
Gimelli A, Rossi G, Landi P, Marzullo P, Iervasi G, L’Abbate A, et al. Stress/rest myocardial perfusion abnormalities by gated SPECT: Still the best predictor of cardiac events in stable ischemic heart disease. J Nucl Med 2009; 50: 546–553.
- 9.
Nakajima K. Normal values for nuclear cardiology: Japanese databases for myocardial perfusion, fatty acid and sympathetic imaging and left ventricular function. Ann Nucl Med 2010; 24: 125–135.
- 10.
Lomsky M, Gjertsson P, Johansson L, Richter J, Ohlsson M, Tout D, et al. Evaluation of a decision support system for interpretation of myocardial perfusion gated SPECT. Eur J Nucl Med Mol Imaging 2008; 35: 1523–1529.
- 11.
Johansson L, Edenbrandt L, Nakajima K, Lomsky M, Svensson SE, Tragardh E. Computer-aided diagnosis system outperforms scoring analysis in myocardial perfusion imaging. J Nucl Cardiol 2014; 21: 416–423.
- 12.
Garcia EV, Klein JL, Taylor AT. Clinical decision support systems in myocardial perfusion imaging. J Nucl Cardiol 2014; 21: 427–439; quiz 440.
- 13.
JCS Joint Working Group. Guidelines for clinical use of cardiac nuclear medicine (JCS 2010): Digest version. Circ J 2012; 76: 761–767.
- 14.
Okuda K, Nakajima K, Hosoya T, Ishikawa T, Matsuo S, Kawano M, et al. Quantification of myocardial perfusion SPECT using freeware package (cardioBull). Ann Nucl Med 2011; 25: 571–579.
- 15.
Nakajima K, Okuda K, Nystrom K, Richter J, Minarik D, Wakabayashi H, et al. Improved quantification of small hearts for gated myocardial perfusion imaging. Eur J Nucl Med Mol Imaging 2013; 40: 1163–1170.
- 16.
Lomsky M, Richter J, Johansson L, Hoilund-Carlsen PF, Edenbrandt L. Validation of a new automated method for analysis of gated-SPECT images. Clin Physiol Funct Imaging 2006; 26: 139–145.
- 17.
Germano G, Kavanagh PB, Slomka PJ, Van Kriekinge SD, Pollard G, Berman DS. Quantitation in gated perfusion SPECT imaging: The Cedars-Sinai approach. J Nucl Cardiol 2007; 14: 433–454.
- 18.
Garcia EV, Faber TL, Cooke CD, Folks RD, Chen J, Santana C. The increasing role of quantification in clinical nuclear cardiology: The Emory approach. J Nucl Cardiol 2007; 14: 420–432.
- 19.
Ficaro EP, Lee BC, Kritzman JN, Corbett JR. Corridor4DM: The Michigan method for quantitative nuclear cardiology. J Nucl Cardiol 2007; 14: 455–465.
- 20.
Berman DS, Abidov A, Kang X, Hayes SW, Friedman JD, Sciammarella MG, et al. Prognostic validation of a 17-segment score derived from a 20-segment score for myocardial perfusion SPECT interpretation. J Nucl Cardiol 2004; 11: 414–423.
- 21.
Gorry G. Computer-assisted clinical decision making. Methods Inf Med 1973; 12: 45–51.
- 22.
Edenbrandt L, Hoglund P, Frantz S, Hasbak P, Johansen A, Johansson L, et al. Area of ischemia assessed by physicians and software packages from myocardial perfusion scintigrams. BMC Med Imaging 2014; 14: 5.
- 23.
Wolak A, Slomka PJ, Fish MB, Lorenzo S, Acampa W, Berman DS, et al. Quantitative myocardial-perfusion SPECT: Comparison of three state-of-the-art software packages. J Nucl Cardiol 2008; 15: 27–34.
- 24.
Guner LA, Karabacak NI, Cakir T, Akdemir OU, Kocaman SA, Cengel A, et al. Comparison of diagnostic performances of three different software packages in detecting coronary artery disease. Eur J Nucl Med Mol Imaging 2010; 37: 2070–2078.
- 25.
Svensson A, Akesson L, Edenbrandt L. Quantification of myocardial perfusion defects using three different software packages. Eur J Nucl Med Mol Imaging 2004; 31: 229–232.
- 26.
The Task Force on Myocardial Revascularization of the European Society of Cardiology (ESC) and the European Association for Cardio-Thoracic Surgery (EACTS); European Association for Percutaneous Cardiovascular Interventions (EAPCI);
Wijns W, Kolh P, Danchin N, Di Mario C, Falk V, Folliguet T, et al. Guidelines on myocardial revascularization. Eur Heart J 2010; 31: 2501–2555.
- 27.
Matsumoto N, Sato Y, Suzuki Y, Kunimasa T, Yoda S, Iida J, et al. Prognostic value of myocardial perfusion single-photon emission computed tomography for the prediction of future cardiac events in a Japanese population: A middle-term follow-up study. Circ J 2007; 71: 1580–1585.
- 28.
Nishimura T, Nakajima K, Kusuoka H, Yamashina A, Nishimura S. Prognostic study of risk stratification among Japanese patients with ischemic heart disease using gated myocardial perfusion SPECT: J-ACCESS study. Eur J Nucl Med Mol Imaging 2008; 35: 319–328.
- 29.
Nakajima K, Matsuo S, Okuyama C, Hatta T, Tsukamoto K, Nishimura S, et al. Cardiac event risk in Japanese subjects estimated using gated myocardial perfusion imaging, in conjunction with diabetes mellitus and chronic kidney disease. Circ J 2012; 76: 168–175.
- 30.
Furuhashi T, Moroi M, Awaya T, Minakawa M, Masai H, Kunimasa T, et al. Usefulness of stress myocardial perfusion imaging and baseline clinical factors for predicting cardiovascular events in patients with prior coronary artery disease. Circ J 2014; 78: 1676–1683.
- 31.
Nakajima K, Nakajima Y, Horikoshi H, Ueno M, Wakabayashi H, Shiga T, et al. Enhanced diagnostic accuracy for quantitative bone scan using an artificial neural network system: A Japanese multi-center database project. EJNMMI Res 2013; 3: 83.