Abstract
Background:
Malondialdehyde-modified low-density lipoprotein (MDA-LDL) is considered to play an essential role in plaque destabilization. We aimed to investigate the association between the tissue characteristics of culprit plaque assessed by integrated backscatter (IB)-intravascular ultrasound (IVUS) and the serum MDA-LDL levels in patients with stable coronary artery disease.
Methods and Results:
The study group consisted of 179 patients undergoing IB-IVUS during elective percutaneous coronary intervention. Patients were classified into 2 groups based on serum MDA-LDL level: low MDA-LDL group (<102 U/L, n=88) and high MDA-LDL group (≥102 U/L, n=91). Plaques in the high MDA-LDL group had higher %lipid (45.2±12.5% vs. 54.9±14.5%, P<0.001) and lower %fibrosis (43.0±9.1% vs. 36.4±11.4%, P<0.001) than did plaques in the low MDA-LDL group. Lipid-rich plaque (%lipid >60% or %fibrosis <30%) was significantly more frequently found in the high MDA-LDL group than in the low MDA-LDL group (14.3% vs. 39.8%, P<0.001). The incidence of MACE (cardiac death, myocardial infarction and/or hospitalization for heart failure) during 3 years was significantly higher in the high MDA-LDL group than in the low MDA-LDL group (6.6% vs. 15.9%, P=0.02).
Conclusions:
Higher MDA-LDL might be associated with greater lipid and lower fibrous content, contributing to coronary plaque vulnerability. (Circ J 2016; 80: 2173–2182)
Previous studies have demonstrated that rupture of vulnerable plaque with subsequent thrombosis formation is the most important mechanism of acute coronary syndromes (ACS),1
and inflammation and oxidative stress in the vessel wall are considered to play an essential role in the initiation, progression and final steps of atherosclerosis, namely plaque destabilization and eventually plaque rupture.2
In particular, the oxidative modification of low-density lipoprotein (LDL) is a key factor in the initiation and acceleration of atheroscrelosis.3
Malondialdehyde-modified LDL (MDA-LDL), which is known to be oxidized LDL, is reported to be a marker of coronary artery disease (CAD) severity,4
plaque vulnerability5,6
and a predictor of ACS.7
However, there are few data on the association between MDA-LDL and plaque vulnerability in vivo, mainly because of the lack of a sensitive method of specifically identifying vulnerable plaques. Integrated backscatter (IB) intravascular ultrasound (IVUS) has been recently developed as a high-resolution imaging method for observing and analyzing the tissue components of coronary plaque on the basis of radiofrequency ultrasound backscatter signals.8–10
Pathological studies have suggested that the tissue characteristics of coronary plaque are an important determinant of vulnerability. This study was undertaken to assess the association between the tissue characteristics of culprit plaque assessed by IB-IVUS and the serum levels of MDA-LDL in patients with stable CAD.
Methods
Study Patients
This study was a single-center, non-randomized, retrospective study. In total, 506 consecutive patients underwent percutaneous coronary intervention (PCI) from January 2011 to December 2013 at Hiroshima University Hospital. Of these, we enrolled 179 patients with stable CAD undergoing elective PCI for a native, de novo coronary. All patients underwent both IB-IVUS without any pre-balloon dilatation and measurement of serum MDA-LDL level before PCI. A study flow chart is shown in
Figure 1A. All patients had anginal chest pain and myocardial ischemia on myocardial perfusion scintigraphy or fractional flow reserve, which identify the culprit vessel. As for the indication for performing pre-IVUS, we performed it for all patients who underwent stent implantation. Patient-related exclusion criteria of this study were ACS, cardiogenic shock, previous coronary artery bypass surgery and hemodialysis. Lesion-related exclusion criteria were intrastent restenosis, the vessels within the territory of a previous myocardial infarction (MI), extremely tight lesions or tortuous vessels where we expected difficulty in advancing the soft-tip guidewire or the IVUS catheter, severely calcified lesions requiring debulking (rotational atherectomy) and angiographic evidence of coronary dissection. Patients were classified into 2 groups based on serum MDA-LDL level: low MDA-LDL group (<102 U/L, n=88) and high MDA-LDL group (≥102 U/L, n=91). Because a serum MDA-LDL level of 102 U/L was the median of this population, we defined patients with a serum MDA-LDL level ≥102 U/L as the high MDA-LDL group. Hypertension was defined as blood pressure ≥140/90 mmHg or receiving antihypertensive treatment, and dyslipidemia was defined as LDL cholesterol (LDL-C) >140 mg/dl and/or triglyceride >150 mg/dl and/or high-density lipoprotein cholesterol (HDL-C) <40 mg/dl without lipid-lowering treatment or receiving lipid-lowering treatment regardless of PCI. Diabetes mellitus was diagnosed according to HbA1c ≥6.5% or the use of insulin or glucose-lowering medication. Estimated glomerular filtration rate (eGFR) was calculated using the Japanese equations from serum creatinine, and chronic kidney disease (CKD) was thought to be present if it eGFR <60 ml/min/1.73 m2. Prescription of statins was defined as taking statins at least 7 days before PCI.11
All patients were prescribed statins to manage their lipid profiles to the target control levels (LDL-C <100 mg/dl and HDL-C >40 mg/dl) from pre- or post-PCI, unless contraindicated. If necessary, ezetimibe was added. A major adverse cardiac event (MACE) was defined as cardiac death, MI and/or hospitalization for heart failure. Cardiac death was defined as death from pump failure, sudden cardiac death or death because of arrhythmia. Clinical follow-up was performed for up to 3 years after PCI. Informed consent was given by each patient. Intraobserver and interobserver variabilities were determined by analysis of IVUS findings by 2 independent blinded observers and by the same observer at 2 different times. The study protocol conformed to the ethical guidelines of the 1975 Declaration of Helsinki as reflected in a priori approval by the Ethical Committee of Hiroshima University Graduate School of Biomedical and Health Sciences.

All patients underwent elective coronary stent implantation by a 6Fr or 7Fr guiding catheter. All patients received dual antiplatelet agents at least 24 h before the procedure; 7,500 IU of unfractionated heparin was administrated before the procedure and an additional bolus of heparin was given during PCI, with a target activated clotting time >250 s every 30 min. Before coronary angiography, patients were given an intracoronary optimal dose of isosorbide dinitrate to prevent coronary spasm. The operator decided on the position and length of the angioplasty and stent implantation according to angiographic and conventional grayscale IVUS findings. Coronary angiograms were obtained and evaluated according to standard techniques. Using quantitative coronary angiographic (QCA) analysis (QCA-CMS v.6.0, Medis, Leiden, Netherlands), coronary artery stenosis was defined as 50% reduction of the internal diameter of the coronary arteries compared with normal, non-ectatic segments.
Conventional Grayscale IVUS and IB-IVUS Image Acquisition and Analysis
The IVUS imaging system was a commercially available system (VISIWAVE, Terumo Co, Tokyo, Japan). Following the passage of a 0.014-inch guidewire across the lesion, the IVUS catheter (View It, Terumo Co) was advanced to the distal part of the culprit lesion and pulled back automatically at a constant rate of 0.5 mm/s, which started at least 5 mm distal to the culprit lesion and ended at the aorto-ostial junction. Conventional grayscale IVUS was performed just before PCI without any pre-balloon dilatation. The conventional grayscale and IB-IVUS analyses were performed with commercially available custom software (VISIATLAS, Terumo Co). Lesions with severe angulation or intimal calcification (arc >90°) throughout the lesion were excluded. Analysis of the IVUS images was performed by 2 reviewers blinded to the clinical data. Any discordance between the 2 reviewers was resolved by consensus reading. Measurements of conventional grayscale IVUS and IB-IVUS were made through the whole length of each culprit plaque at 1-mm intervals.
Figure 1B
shows the IVUS measurements and analyses. In the conventional grayscale IVUS analysis, the cross-sectional area (CSA) was quantified for the external elastic membrane (EEM), lumen and plaque (EEM CSA−lumen CSA) according to the criteria of the clinical expert consensus document on IVUS12
and the average EEM, lumen and plaque area of each culprit plaque were calculated. Vessel volumes and lumen volumes were then calculated using Simpson’s technique.12
The plaque volume was calculated by subtracting lumen volume from vessel volume. Lumen area stenosis was calculated as reference lumen CSA−minimum lumen CSA)/reference lumen CSA×100 (%). The plaque burden was calculated as plaque+media CSA/EEM CSA. The remodeling index was calculated as the ratio of EEM CSA at the minimum luminal site to the reference EEM CSA (average of the proximal and distal reference segments). Positive remodeling was defined as a remodeling index >1. Lesion lumen eccentricity was calculated as maximum lumen diameter−minimum lumen diameter/maximum lumen diameter. Atheroma eccentricity was calculated as maximum plaque+media thickness−minimum plaque+media thickness/maximum plaque+media thickness.
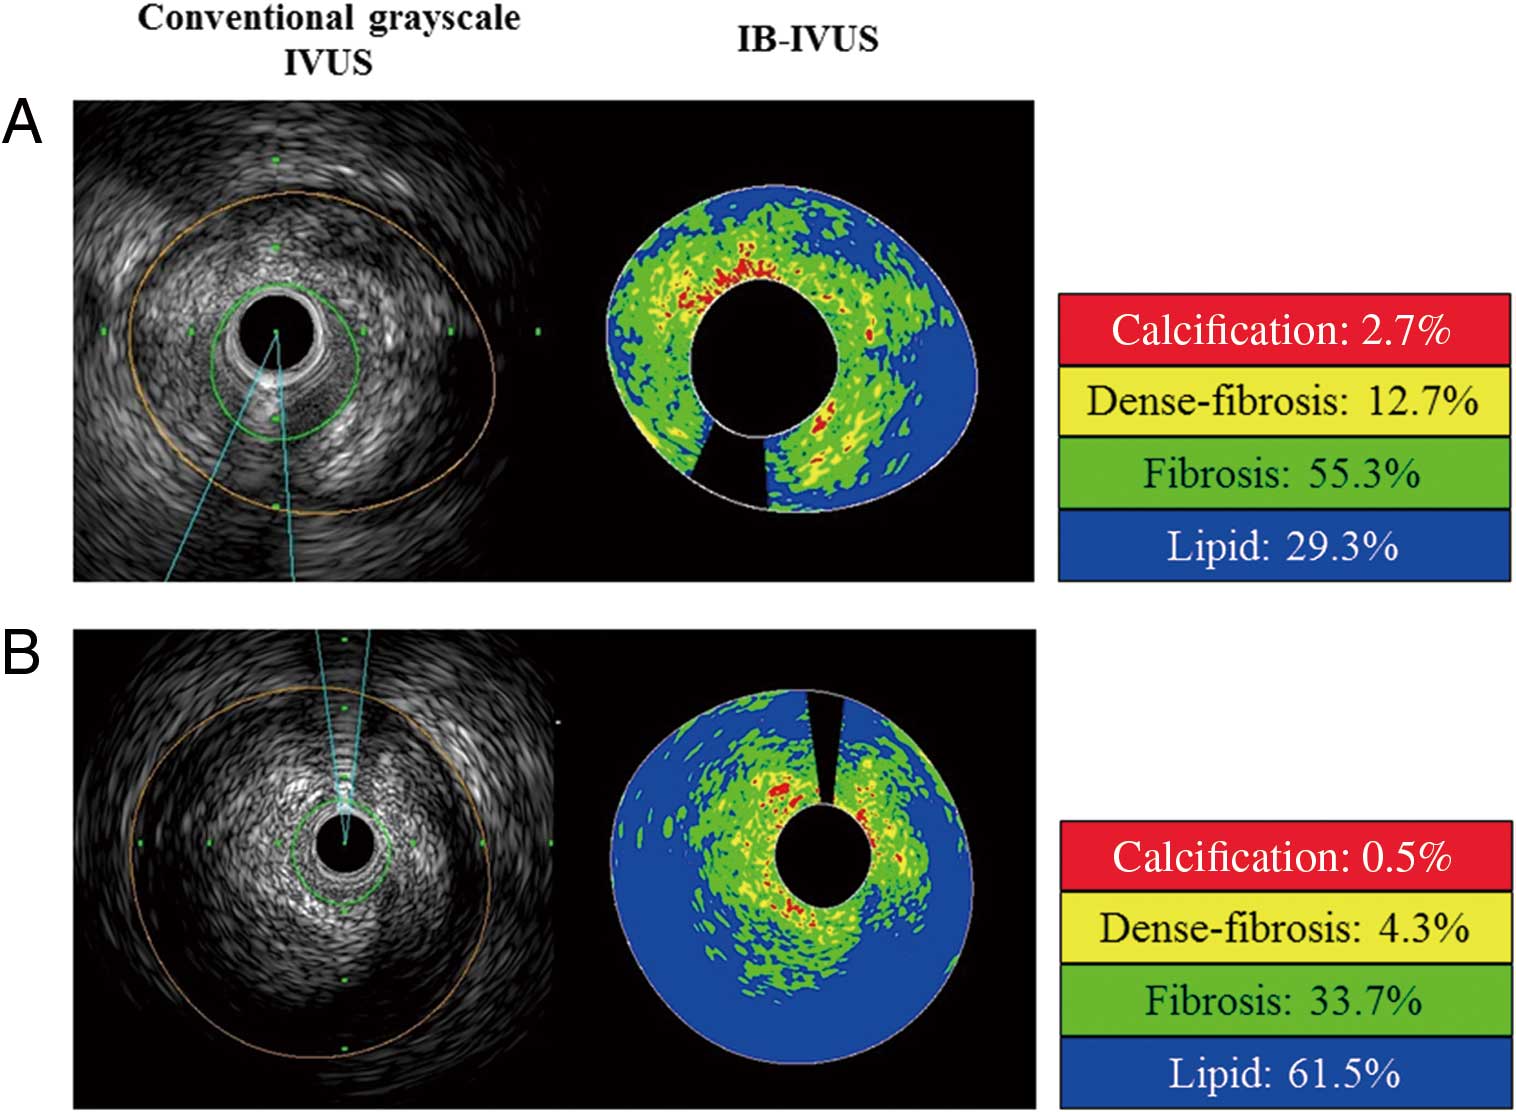
In the IB-IVUS analysis, 2D color-coded maps using IB values were constructed in all consecutive IVUS image slices at 1-mm intervals. The percentage of 4 tissue parameters (lipid, fibrosis, dense fibrosis and calcification) was automatically calculated by the IB-IVUS system according to the radiofrequency signal data generated by the IB-IVUS software.13
The acoustic shadows of calcifications and the guidewire were manually traced and excluded to minimize the effects of artifacts. The average percentage of each plaque component in the total plaque volume was calculated. Lipid-rich plaque was defined as plaque with %lipid >60% or %fibrosis <30%.14
Laboratory Measurements
Blood samples were collected from the antecubital vein by an atraumatic puncture just before PCI while the patient was in the postabsorptive state and then sent to the central hospital laboratory within 1 h of collection. Venous blood was collected in a tube containing K3 EDTA for measurement of hematologic indices in all patients. The serum MDA-LDL level was measured using an enzyme-linked immunosorbent assay kit (SRL Co, Ltd, Tokyo, Japan).
Statistical Analysis
Standard statistical methods were used in this study. Significant differences were tested using the χ2
test for categorical variables. Normally distributed continuous variables are presented as mean and standard deviation (SD) or median and interquartile range (IQR). Unpaired Student’s t-test or Wilcoxon rank-sum test when appropriate was used for continuous variables. Logistic regression analysis was used to identify independent predictors of the presence of lipid-rich plaque in patients who underwent elective PCI. Cox proportional hazard regression was used to identify independent predictors of MACE. The univariable predictors with a P-value <0.20 were entered into a multivariate model. Event-free survival curves up to 3 years after PCI were constructed with the Kaplan-Meier method and were compared with the log-rank test. The JMP statistical package (version 11.0, SAS Institute, Inc, Cary, NC, USA) was used for all statistical tests. A significance level of 0.05 was used and two-tailed tests were applied.
Results
Clinical, Angiographic and Procedural Results
The mean value of MDA-LDL was 104±35 U/L, ranging from 44 to 248 mg/dl (Figure 2). The median value of MDA-LDL was 102 U/L. Patients were classified into 2 groups based on the median value of the serum MDA-LDL level. The baseline characteristics of the study patients are shown in
Table 1A. There were no significant differences in any of the baseline clinical variables between the low and high MDA-LDL groups. The rate of patients taking statins at least 7 days before PCI tended to be higher in the low MDA-LDL group than in the high MDA-LDL group, but the difference was not statistically significant (80.2% vs. 70.5%, P=0.13). Regarding lipid profiles, LDL-C, LDL-C/HDL-C ratio and triglycerides were significantly higher in the high MDA-LDL group than in the low MDA-LDL group (LDL-C: 77.4±19.9 mg/dl vs. 105.9±31.8 mg/dl, P<0.001; LDL-C/HDL-C ratio: 1.15±0.56 vs. 2.37±0.84, P<0.001; triglycerides: 99.6±33.7 mg/dl vs. 165.4±109.3 mg/dl, P<0.001). In addition, HDL-C was significantly lower in the high MDA-LDL group than in the low MDA-LDL group (54.2±14.6 mg/dl vs. 46.7±11.3 mg/dl, P<0.001, respectively). The rate of patients with CKD tended to be higher in the high MDA-LDL group than in the low MDA-LDL group, but the differences were not statistically significant (48.4% vs. 56.8%, P=0.23). There were no significant differences in other blood chemical parameters between the low and high MDA-LDL groups.

Table 1.
(A) Baseline Characteristics of Study Patients With Stable CAD, (B) Lesion, Angiographic and Procedural Characteristics of Study Patients With Stable CAD
| A |
Low MDA-LDL
(n=91) |
High MDA-LDL
(n=88) |
P value |
| Clinical characteristics |
| Age, years |
70.4±8.7 |
70.4±9.1 |
0.87 |
| Male, n (%) |
74 (81.3) |
67 (76.1) |
0.40 |
| Hypertension, n (%) |
81 (89.0) |
76 (86.4) |
0.59 |
| Dyslipidemia, n (%) |
72 (79.1) |
65 (73.9) |
0.41 |
| Diabetes mellitus, n (%) |
49 (53.9) |
50 (56.8) |
0.69 |
| Current smoker, n (%) |
42 (46.2) |
42 (47.7) |
0.83 |
| BMI, kg/m2 |
24.3±3.0 |
24.3±3.3 |
0.87 |
| Previous MI, n (%) |
24 (26.4) |
13 (14.8) |
0.06 |
| Medication, n (%) |
| Aspirin |
91 (100) |
88 (100) |
1.00 |
| Clopidogrel/Ticlopidine |
91 (100) |
88 (100) |
1.00 |
| β-blocker |
42 (46.2) |
41 (46.6) |
0.95 |
| CCB |
37 (40.1) |
43 (48.9) |
0.27 |
| ACEI/ARB |
54 (59.3) |
59 (67.1) |
0.29 |
| Statin |
73 (80.2) |
62 (70.5) |
0.13 |
| Diuretic |
26 (28.6) |
22 (25.0) |
0.59 |
| LVEF, % |
58.4±8.3 |
57.2±11.1 |
0.91 |
| Laboratory data |
| White blood cells, 103/μl |
5,952±1,773 |
6,553±1,928 |
0.07 |
| C-reactive protein, mg/dl |
0.07 (0.03–0.18) |
0.11 (0.04–0.21) |
0.15 |
| Platelets, mm3/μl |
192.0±56.0 |
193.5±45.3 |
0.61 |
| eGFR, ml/min/1.73 m2 |
60.5±22.7 |
57.5±19.4 |
0.31 |
| eGFR <60 ml/min/1.73 m2, n (%) |
44 (48.4) |
50 (56.8) |
0.26 |
| LDL-C, mg/dl |
77.4±19.9 |
105.9±31.8 |
<0.001 |
| HDL-C, mg/dl |
54.2±14.6 |
46.7±11.3 |
<0.001 |
| LDL-C/HDL-C ratio |
1.15±0.56 |
2.37±0.84 |
<0.001 |
| Triglyceride, mg/dl |
99.6±33.7 |
165.4±109.3 |
<0.001 |
| HbA1c, % |
6.3±0.8 |
6.5±1.1 |
0.23 |
| Uric acid, mg/dl |
5.9±1.4 |
5.9±1.7 |
0.42 |
| MDA-LDL, U/L |
78.0±16.4 |
131.5±27.6 |
<0.001 |
| B |
Low MDA-LDL (n=91) |
High MDA-LDL (n=88) |
P value |
| Lesion location, n (%) |
|
|
0.71 |
| LAD |
33 (36.3) |
39 (44.3) |
0.27 |
| LCX |
22 (24.2) |
20 (22.7) |
0.82 |
| RCA |
33 (36.3) |
26 (29.6) |
0.34 |
| LMT |
3 (3.3) |
3 (3.4) |
0.97 |
| Multivessel disease, n (%) |
64 (70.3) |
59 (67.1) |
0.64 |
| Collateral flow, n (%) |
10 (11.0) |
7 (8.0) |
0.49 |
| ACC/AHA classification B2/C, n (%) |
45 (49.5) |
42 (47.7) |
0.82 |
| Final TIMI flow grade 3, n (%) |
90 (98.9) |
86 (97.7) |
0.54 |
| QCA |
| Pre-PCI |
| RD, mm |
2.40±0.59 |
2.47±0.60 |
0.50 |
| MLD, mm |
0.53±0.32 |
0.57±0.28 |
0.66 |
| %DS |
78.9±11.4 |
76.0±14.6 |
0.47 |
| Lesion length, mm |
21.3±10.2 |
19.4±9.6 |
0.20 |
| Post-PCI |
| RD, mm |
3.02±0.53 |
2.98±0.53 |
0.62 |
| MLD, mm |
2.69±0.50 |
2.74±0.55 |
0.72 |
| %DS |
9.33±4.85 |
8.77±6.17 |
0.11 |
| Lesion length, mm |
21.0±10.6 |
19.6±9.3 |
0.61 |
| Stenting |
| Total stent length, mm |
24.8±13.5 |
21.8±12.3 |
0.13 |
| Stent diameter, mm |
3.14±0.40 |
3.20±1.03 |
0.59 |
(A) Values are expressed as mean (standard deviation) or median (interquartile range) or absolute number of cases (relative percentage) as appropriate. P values are two-tailed, and P<0.05 is considered statistically significant. (B) Values are expressed as mean (standard deviation) or absolute number of cases (relative percentage) as appropriate. P values are two-tailed, and P<0.05 is considered statistically significant. ACC/AHA classification B2/C, American Heart Association/American College of Cardiology classification type B2 or type C; ACEI, angiotensin-converting enzyme inhibitor; ARB, angiotensin II receptor blocker; BMI, body mass index; CAD, coronary artery disease; CCB, calcium-channel blocker; %DS, percent diameter stenosis; eGFR, estimated glomerular filtration rate; HbA1c, hemoglobin A1c; HDL-C, high-density lipoprotein cholesterol; LDL-C, low-density lipoprotein cholesterol; LAD, left anterior descending coronary artery; LCX, left circumflex coronary artery; LVEF, left ventricular ejection fraction; LMT, left main trunk; MDA-LDL, malondialdehyde-modified low-density lipoprotein; MI, myocardial infarction; MLD, minimum lumen diameter; QCA, quantitative coronary angiography; PCI, percutaneous coronary intervention; RCA, right coronary artery; RD, reference diameter; TIMI, Thrombolysis in Myocardial Infarction.
Lesion, angiographic and procedural characteristics of the study patients are shown in
Table 1B. There were no significant differences in lesion location, multivessel disease, collateral flow, ACC/AHA classification B2/C, final TIMI flow grade 3 between the low and high MDA-LDL groups. In the QCA measurements, lesion length tended to be longer in the low MDA-LDL group than in the high MDA-LDL group, but the difference was not statistically significant (pre-PCI lesion length: 21.3±19.4 mm vs. 19.4±9.6 mm, P=0.20). No significant differences in implanted total stent length, mean stent diameter were observed between the low and high MDA-LDL groups (total stent length: 24.8±13.5 mm vs.21.8±12.3 mm, P=0.13; stent diameter: 3.14±0.40 mm vs. 3.20±1.03 mm, P=0.59, respectively). There were no significant differences in any lesion, angiographic or procedural variables between the low and high MDA-LDL groups.
IVUS Findings
The IVUS findings of the study patients are shown in
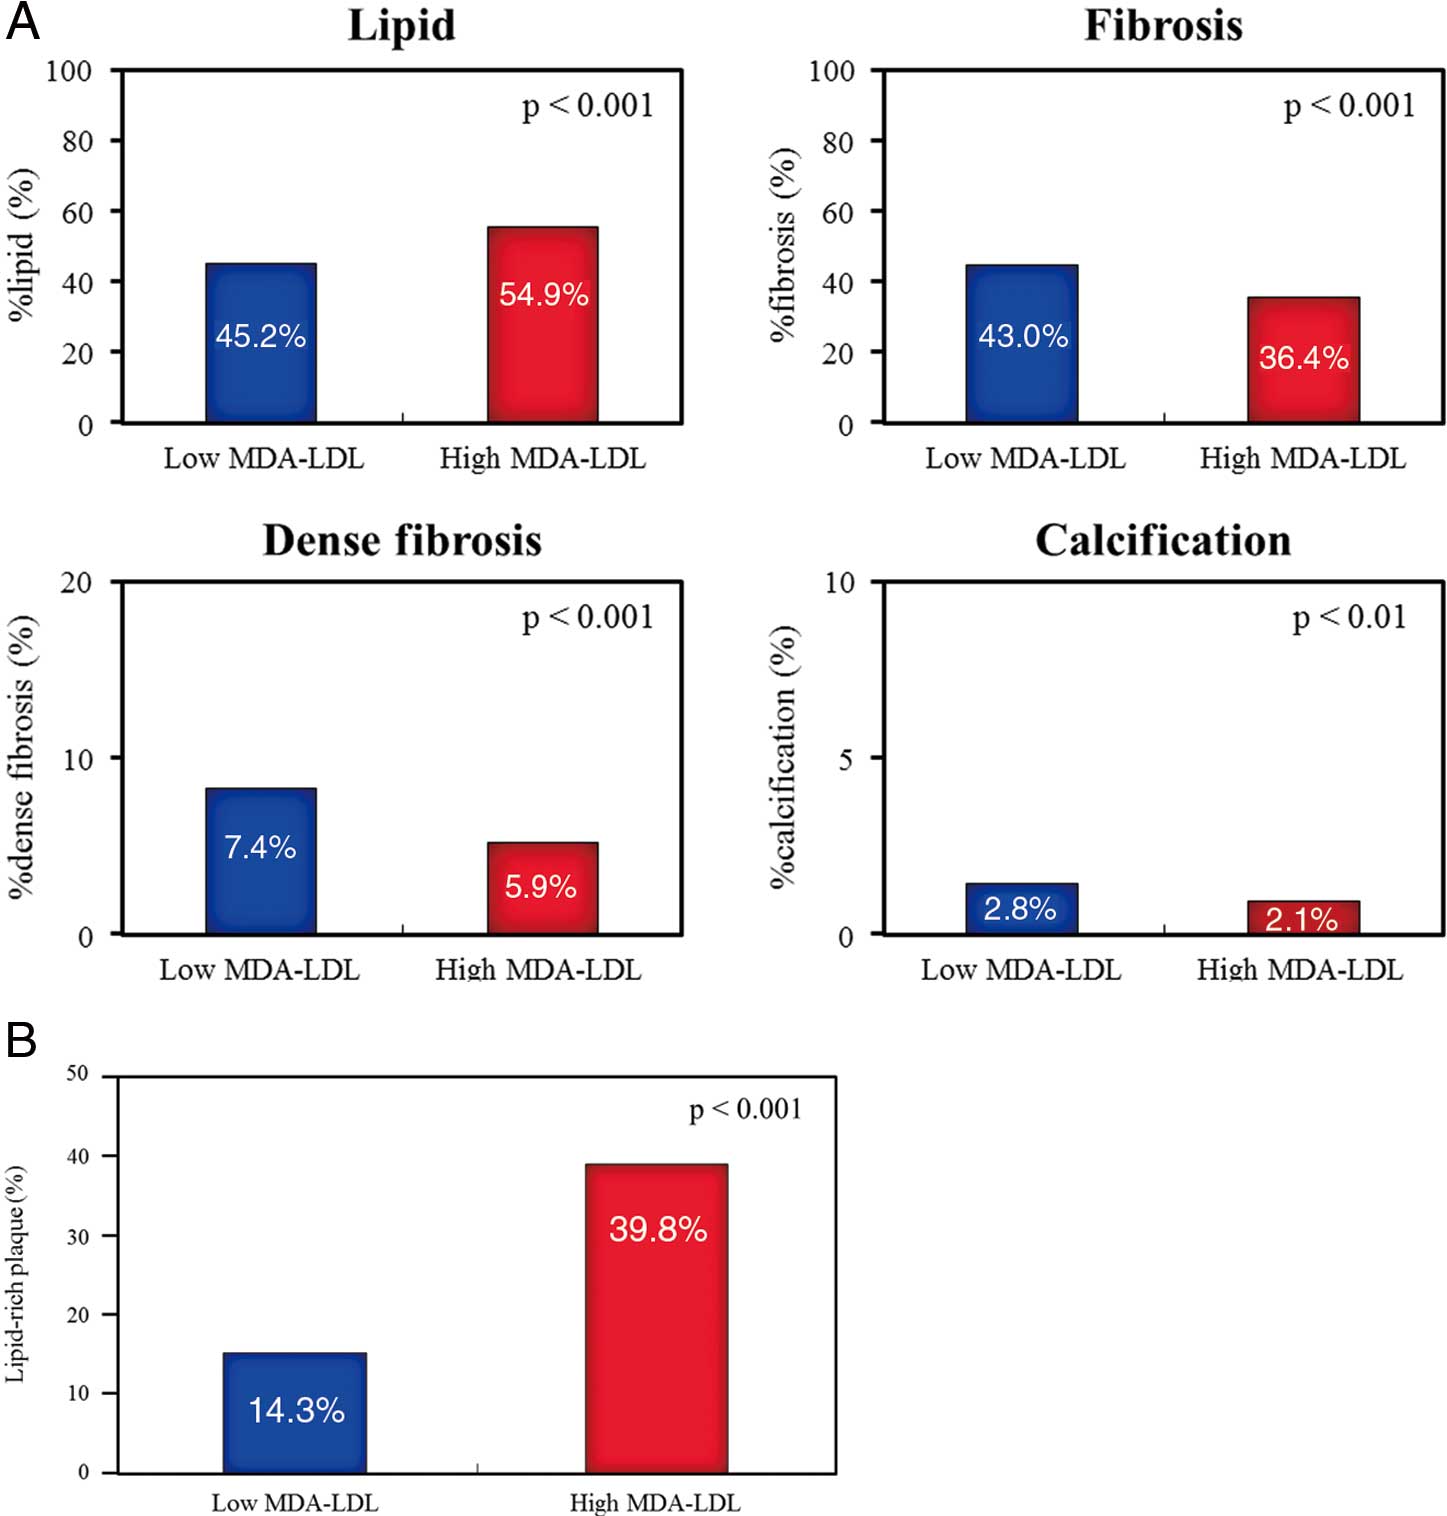
Table 2. On conventional grayscale IVUS analysis, there were no significant differences in lesion length, average EEM CSA, lumen CSA, plaque CSA, area stenosis, plaque burden and lesion lumen eccentricity between the low and high MDA-LDL groups. The remodeling index and the frequencies of positive remodeling and atheroma eccentricity were significantly higher in the high MDA-LDL group than in the low MDA-LDL group (remodeling index: 0.98±0.26 vs. 1.19±0.33, P<0.001; positive remodeling: 39.6% vs. 70.5%, P<0.001; atheroma eccentricity: 0.66±0.22 vs. 0.77±0.18, P<0.001, respectively). There were no significant differences in vessel volume, lumen volume, plaque volume and %plaque volume between the low and high MDA-LDL groups. There was no significant difference in the 3D analysis of conventional grayscale IVUS between the low and high MDA-LDL groups. Comparison of the plaque components between the high and low MDA-LDL groups by IB-IVUS analysis is shown in
Figure 3A. On IB-IVUS analysis, plaques in the high MDA-LDL group had higher %lipid (45.2±12.5% vs. 54.9±14.5%, P<0.001) and lower %fibrosis (43.0±9.1% vs. 36.4±11.4%, P<0.001), as well as lower %dense fibrosis (7.4±4.2% vs 5.9±3.7%, P<0.001) and lower %calcification (2.8±2.2% vs. 2.1±1.9%, P<0.01) than did plaques in the low MDA-LDL group. Lipid-rich plaque was significantly more frequently found by IB-IVUS in the high MDA-LDL group than in the low MDA-LDL group (14.3% vs. 39.8%, P<0.001,
Figure 3B). Representative cases are shown in
Figure 4.
Table 2.
IVUS Findings in Study Patients With Stable CAD
| |
Low MDA-LDL (n=91) |
High MDA-LDL (n=88) |
P value |
| Conventional grayscale IVUS |
| Lesion length, mm |
21.6±10.7 |
19.3±8.6 |
0.17 |
| EEM CSA, mm2 |
12.66±4.62 |
13.41±4.81 |
0.34 |
| Lumen CSA, mm2 |
4.65±2.08 |
4.71±1.96 |
0.54 |
| Plaque CSA, mm2 |
7.96±3.15 |
8.65±3.51 |
0.22 |
| Area stenosis, % |
80.7±8.1 |
80.0±9.6 |
0.89 |
| Plaque burden |
0.81±0.08 |
0.80±0.10 |
0.85 |
| Remodeling index |
0.98±0.26 |
1.19±0.33 |
<0.001 |
| Positive remodeling, n (%) |
36 (39.6) |
62 (70.5) |
<0.001 |
| Lesion lumen eccentricity |
0.85±0.09 |
0.86±0.07 |
0.80 |
| Atheroma eccentricity |
0.66±0.22 |
0.77±0.18 |
<0.001 |
| Vessel volume, mm3 |
270.1±154.2 |
263.5±155.6 |
0.73 |
| Lumen volume, mm3 |
93.8±57.2 |
88.4±54.6 |
0.64 |
| Plaque volume, mm3 |
174.7±110.5 |
170.6±109.1 |
0.71 |
| % Plaque volume |
0.64±0.11 |
0.65±0.10 |
0.42 |
| IB-IVUS |
| %lipid |
45.2±12.5 |
54.9±14.5 |
<0.001 |
| %fibrosis |
43.0±9.1 |
36.4±11.4 |
<0.001 |
| %dense fibrosis |
7.4±4.2 |
5.9±3.7 |
<0.001 |
| %calcification |
2.8±2.2 |
2.1±1.9 |
<0.01 |
| Lipid-rich plaque, n (%) |
13 (14.3) |
35 (39.8) |
<0.001 |
Values are expressed as mean (standard deviation) or median (interquartile range) or absolute number of cases (relative percentage) as appropriate. P values are two-tailed, and P<0.05 is considered statistically significant. Lipid-rich plaque, %lipid >60% or %fibrosis <30%. CAD, coronary artery disease; CSA, cross-sectional area; EEM, external elastic membrane; IB, integrated backscatter; IVUS, intravascular ultrasound.
Univariate and multivariate logistic regression analyses to identify independent predictors of the presence of lipid-rich plaque in patients undergoing elective PCI are shown in
Table 3A. Univariate analysis revealed that previous MI and MDA-LDL were associated with the presence of lipid-rich plaque in patients undergoing elective PCI [previous MI: odds ratio (OR) 2.25, 95% confidence interval (CI) 1.04–4.82, P=0.04; MDA-LDL (per 10 U/L): OR 1.17, 95% CI 1.06–1.30, P<0.01, respectively]. To detect the independent effect of MDA-LDL for the presence of lipid-rich plaque in patients undergoing elective PCI, MDA-LDL as well as previous MI, hypertension, dyslipidemia and HbA1c was incorporated in the multivariate logistic regression analysis. Multivariate logistic regression analysis revealed that MDA-LDL was an independent predictor for the presence of lipid-rich plaque in patients undergoing elective PCI [OR 1.24 (per 10 U/L), 95% CI 1.11–1.41, P<0.001]. Another factor associated with the presence of lipid-rich plaque was previous MI.
Table 3.
(A) Independent Predictors of Lipid-Rich Plaque in Study Patients With Stable CAD, (B) Cofactors of MACE in the High and Low MDA-LDL Groups of Study Patients With Stable CAD, (C) Independent Predictors of MACE in Study Patients With Stable CAD
| A |
Univariate |
Multivariate |
| OR (95% CI) |
P value |
OR (95% CI) |
P value |
| Age (per 1 year) |
1.00 (0.97–1.04) |
0.91 |
|
|
| Male |
1.23 (0.55–2.97) |
0.62 |
|
|
| Hypertension |
0.48 (0.19–1.24) |
0.12 |
0.61 (0.21–1.78) |
0.40 |
| Dyslipidemia |
0.57 (0.27–1.23) |
0.15 |
0.60 (0.26–1.43) |
0.25 |
| Diabetes mellitus |
0.75 (0.38–1.45) |
0.39 |
|
|
| Current smoker |
0.94 (0.48–1.83) |
0.86 |
|
|
| BMI (per 1 kg/m2) |
0.94 (0.84–1.04) |
0.25 |
|
|
| Previous MI |
2.25 (1.04–4.82) |
0.04 |
3.31 (1.37–8.16) |
<0.01 |
| Statin use |
0.83 (0.40–1.81) |
0.64 |
|
|
| eGFR <60 ml/min/1.73 m2 |
0.87 (0.45–1.69) |
0.68 |
|
|
| HbA1c (per 1%) |
0.70 (0.44–1.02) |
0.09 |
0.67 (0.47–1.02) |
0.06 |
| Uric acid (per 1 mg/dl) |
1.07 (0.86–1.34) |
0.53 |
|
|
| MDA-LDL (per 10 U/L) |
1.17 (1.06–1.30) |
<0.01 |
1.24 (1.11–1.41) |
<0.001 |
| Multivessel disease |
0.88 (0.44–1.81) |
0.72 |
|
|
| ACC/AHA classification B2/C |
0.86 (0.44–1.67) |
0.65 |
|
|
| B |
Low MDA-LDL
(n=91) |
High MDA-LDL
(n=88) |
P value |
| MACE, n (%) |
6 (6.6) |
14 (15.9) |
0.02 |
| Cardiac death, n (%) |
3 (3.3) |
7 (8.0) |
0.17 |
| Myocardial infarction, n (%) |
2 (2.2) |
2 (2.3) |
0.97 |
| Hospitalization for heart failure, n (%) |
1 (1.1) |
5 (5.7) |
0.13 |
| C |
Univariate |
Multivariate |
| HR (95% CI) |
P value |
HR (95% CI) |
P value |
| Age (per 1 year) |
1.02 (0.97–1.08) |
0.45 |
|
|
| Male |
1.36 (0.46–5.86) |
0.60 |
|
|
| Hypertension |
0.76 (0.26–3.30) |
0.68 |
|
|
| Dyslipidemia |
1.27 (0.70–4.44) |
0.70 |
|
|
| Diabetes mellitus |
3.47 (1.27–12.13) |
0.01 |
1.79 (0.40–8.69) |
0.44 |
| Current smoker |
1.48 (0.61–3.68) |
0.38 |
|
|
| BMI (per 1 kg/m2) |
1.04 (0.90–1.20) |
0.58 |
|
|
| Previous MI |
1.56 (0.51–4.04) |
0.41 |
|
|
| Statin use |
0.91 (0.35–2.78) |
0.85 |
|
|
| eGFR <60 ml/min/1.73 m2 |
5.15 (1.73–22.04) |
<0.01 |
5.82 (1.55–37.88) |
<0.01 |
| HbA1c (per 1%) |
1.47 (0.77–2.49) |
0.24 |
|
|
| Uric acid (per 1 mg/dl) |
1.25 (0.91–1.66) |
0.16 |
1.10 (0.81–1.46) |
0.53 |
| High MDA-LDL |
2.90 (1.16–8.21) |
0.02 |
3.45 (1.15–12.79) |
0.03 |
| Multivessel disease |
1.24 (0.48–3.83) |
0.67 |
|
|
| ACC/AHA classification B2/C |
1.01 (0.41–2.47) |
0.98 |
|
|
(B) Values are expressed as absolute number of cases (relative percentage). P values are two-tailed, and P<0.05 is considered statistically significant. CI, confidence interval; HR, hazard ratio; MACE, major adverse cardiac event; OR, odds ratio. Other abbreviations as in Table 1.
The 3-year cumulative incidence of MACE is shown in
Figure 5. The median follow-up period was 773 (IQR 447–1095) days. Individual MACE were reported as follows: cardiac death, n=10 (5.5%); MI, n=4 (2.2%); hospitalization for heart failure, n=6 (3.4%). The incidence of each constituent factor of MACE at 3 years is shown in
Table 3B. Cardiac death, MI and hospitalization for heart failure tended to be more frequent in the high MDA-LDL group, but the difference did not reach statistical significance. However, the incidence of MACE during the 3 years was significantly higher in the high MDA-LDL group than in the low MDA-LDL group (6.6% vs. 15.9%, P=0.02). Univariate and multivariate Cox proportional hazard regression analyses to identify independent predictors of MACE in patients undergoing elective PCI are shown in
Table 3C. Univariate analysis revealed that diabetes mellitus, eGFR <60 ml/min/1.73 m2
and high MDA-LDL were associated with MACE in patients undergoing elective PCI [diabetes mellitus: hazard ratio (HR) 3.47, 95% CI 1.27–12.13, P=0.01; eGFR <60 ml/min/1.73 m2: HR 5.15, 95% CI 1.73–22.04, P<0.01; high MDA-LDL: HR 2.90, 95% CI 1.16–8.21, P=0.02, respectively]. To detect the independent effect of high MDA-LDL for MACE in patients undergoing elective PCI, high MDA-LDL as well as diabetes mellitus, eGFR <60 ml/min/1.73 m2
and uric acid were incorporated in the multivariate Cox proportional hazard regression analyses. Multivariate logistic regression analysis revealed that high MDA-LDL was an independent predictor for MACE in patients undergoing elective PCI [HR 3.45, 95% CI 1.15–12.79, P=0.03]. The other factor associated with MACE was eGFR <60 ml/min/1.73 m2.

Mean intraobserver difference for lesion length on conventional grayscale IVUS analysis was 0.8±0.2 mm; mean interobserver difference was 1.4±0.9 mm. Mean intraobserver differences for %lipid and %fibrosis on IB-IVUS analysis were 4.5±1.4% and 3.2±1.3%, and mean interobserver differences were 5.1±1.4% and 3.4±1.1%, respectively.
Discussion
The major finding of the present study was that plaques in the high MDA-LDL group had higher %lipid and lower %fibrosis than did plaques in the low MDA-LDL group. In addition, lipid-rich plaque was significantly more frequently found by IB-IVUS in the high MDA-LDL group than in the low MDA-LDL group. Multivariate logistic regression analysis revealed that MDA-LDL was an independent predictor for the presence of lipid-rich plaque in patients undergoing elective PCI. Furthermore, the incidence of MACE during 3 years was significantly higher in the high MDA-LDL group than in the low MDA-LDL group. Multivariate logistic regression analysis revealed that high MDA-LDL was an independent predictor for MACE in patients undergoing elective PCI. To our knowledge, this is the first report to present the association between MDA-LDL and plaque vulnerability estimated by IB-IVUS in patients with stable CAD.
The oxidative modification of LDL is a key factor in the initiation and acceleration of atheroscrelosis.2,3
Previous studies have suggested that oxidized LDL, including MDA-LDL, stimulates matrix metalloproteinase (MMP)-1 and MMP-9 expressions in human vascular endothelial cells and monocyte-derived macrophages,15,16
and upregulates the expression of MMP-1 and -3 in human coronary endothelial cells through its endothelial receptor, lectin-like oxidized LDL receptor-1.17
Furthermore, oxidized LDL also triggers the CD40/CD40L signaling pathway, which might also lead to a proinflammatory reaction and induce endothelial injury.18
Thus, elevated levels of oxidized LDL may play a key role in the transition from stable to vulnerable unstable plaque, disrupting a vulnerable plaque and triggering thrombosis by inducing platelet adhesion and by decreasing the fibrinolytic capacities of endothelial cells.19
Furthermore, there is accumulating evidence for the existence of MDA-LDL, which is known to be an oxidized form, not only in atherosclerotic lesions20
but also in plasma.21
The circulating serum MDA-LDL level is reported to be a diagnostic marker of CAD severity,4
plaque vulnerability5
and a predictor of ACS.7
Serum MDA-LDL levels might be associated with the presence of thin-cap fibroatheroma (TCFA) identified on frequency-domain optical coherence tomography (FD-OCT) in culprit lesions.5
Besides, the serum MDA-LDL level has a close correlation with the yellow intensity of plaque on coronary angioscopy, which reflects plaque instability.6
Few studies, however, have examined the relevance of serum MDA-LDL levels in regard to coronary plaques, especially for the plaque tissue components. In the present study, we evaluated the plaque tissue components in culprit lesions by IB-IVUS and higher MDA-LDL levels were associated with greater lipid and lower fibrous content.
Conventional grayscale IVUS has been used to assess total coronary plaque volume, but not to sufficiently determine tissue characteristics and vulnerable plaque.12,22
On the other hand, IB-IVUS has been able to quantitatively evaluate lipid content, which has proven useful in the diagnosis13
and in the assessment of the prognosis of coronary atherosclerosis, as a risk for experiencing a coronary event.23,24
It has been reported that the %lipid in patients with an acute coronary event was significantly higher than those in patients without such an event.23
Furthermore, the PROSPECT study demonstrated that the triad of a TCFA identified by virtual histology-IVUS, a minimal luminal area <4.0 mm2
and a plaque burden >70% predicted lesion-specific events during 3 years of follow-up.25
In the present study, plaques in the high MDA-LDL group had higher %lipid and lower %fibrosis and the plaque burden in the high MDA-LDL group was >70%, although we did not evaluate TCFA. Additionally, positive remodeling was significantly more frequently found by IVUS in the high MDA-LDL group than in the low MDA-LDL group. It was reported that positive remodeled lesions contain more lipid-rich and less hard plaque components compared with non-positive remodeling lesions, which may account for the higher incidence of ACS and plaque vulnerability in postmortem pathological studies and IB-IVUS studies.26,27
Furthermore, on our multivariate regression analysis of several important clinical parameters, we found that MDA-LDL was associated with the presence of lipid-rich plaque on IB-IVUS imaging independent of potentially confounding coronary risk factors. These findings suggested that patients with high MDA-LDL levels might be prone to ACS. In the present study, the incidence of MACE during 3 years was significantly higher in the high MDA-LDL group than in the low MDA-LDL group. Previous study reported that MDA-LDL was associated with future cardiac events in patients with stable angina undergoing lipid-lowering therapy after elective PCI.28
Although we only evaluated culprit plaques in the present study, we think that patients with high %lipid in the culprit plaque might be “vulnerable patients prone to cardiac events”.
Its invasive nature does not allow use of IB-IVUS to assess total coronary arteries, especially in the general population. Therefore, serum MDA-LDL levels, as well as other coronary risk factors, may allow a clearer insight on risk stratification in the future and a better evaluation of therapeutic strategies. However, the optimal cutoff value of MDA-LDL predicting cardiovascular events might need to be further investigated. If a patient was judged as high risk, MDA-LDL lowering therapy, such as intensive statin therapy29
and/or fibrates30
should be considered. Considering the results of the present study, further confirmation of the therapeutic target and clinical implications is needed.
Study Limitations
A major limitation of this study is the small sample size. In addition, this study was conducted in only a single institution in a non-randomized, retrospective manner. Statin therapy has been reported to change both plaque components and plaque stabilization in the coronary artery.31
The administration period of statins in each patient varied and was not taken into account in this study. This may have affected the IB-IVUS findings. We did not analyze the entire artery segment by IB-IVUS. We excluded lesions with moderate to severe calcification. Therefore, it was not possible to assess the effect of calcification on plaque vulnerability in this study. IVUS was used as the only intravascular imaging modality. Comparison of the findings of IVUS to those of FD-OCT or angioscopy was not performed. This study had a patient selection bias. Because of the nature of IVUS, this study had no other choice than to exclude patients with severe stenosis and tortuous coronary lesions. It is difficult to quantify the full range of oxidized LDL because of the heterogeneous population. We performed an analysis of the prognostic value of only cardiac death, MI and hospitalization for heart failure and did not perform an analysis of the prognostic value of relations between the tissue characteristics. Serial measurement of MDA-LDL was not conducted. Thus, the relationship between time-dependent changes in MDA-LDL levels and clinical events is unclear.
Conclusions
Higher MDA-LDL might be associated with greater lipid and lower fibrous content, contributing to coronary plaque vulnerability. Further studies are advocated to investigate more the clinical prognostic value of the relation between the tissue characteristics of culprit plaque assessed by IB-IVUS and MDA-LDL and better therapeutic options to reduce cardiovascular events.
Acknowledgments
We thank Mr Shingo Kono for his technical support of IVUS recording.
Disclosures
S.K. takes responsibility for all aspects of the reliability and freedom from bias of the data presented and their discussed interpretation.
Funding Sources / Conflict of Interest
None.
References
- 1.
Fuster V, Badimon L, Badimon JJ, Chesebro JH. The pathogenesis of coronary artery disease and the acute coronary syndromes. N Engl J Med 1992; 326: 242–250.
- 2.
Koenig W, Khuseyinova N. Biomarkers of atherosclerotic plaque instability and rupture. Arterioscler Thromb Vasc Biol 2007; 27: 15–26.
- 3.
Steinberg D, Lewis A. Conner Memorial Lecture: Oxidative modification of LDL and atherogenesis. Circulation 1997; 95: 1062–1071.
- 4.
Amaki T, Suzuki T, Nakamura F, Hayashi D, Imai Y, Morita H, et al. Circulating malondialdehyde modified LDL is a biochemical risk marker for coronary artery disease. Heart 2004; 90: 1211–1213.
- 5.
Matsuo Y, Kubo T, Okumoto Y, Ishibashi K, Komukai K, Tanimoto T, et al. Circulating malondialdehyde-modified low-density lipoprotein levels are associated with the presence of thin-cap fibroatheromas determined by optical coherence tomography in coronary artery disease. Eur Heart J Cardiovasc Imaging 2013; 14: 43–50.
- 6.
Tajika K, Okamatsu K, Takano M, Inami S, Yamamoto M, Murakami D, et al. Malondialdehyde-modified low-density lipoprotein is a useful marker to identify patients with vulnerable plaque. Circ J 2012; 76: 2211–2217.
- 7.
Holvoet P, Collen D, Van de Werf F. Malondialdehyde-modified LDL as a marker of acute coronary syndromes. JAMA 1999; 281: 1718–1721.
- 8.
Niki T, Wakatsuki T, Yamaguchi K, Taketani Y, Oeduka H, Kusunose K, et al. Effects of the addition of eicosapentaenoic acid to strong statin therapy on inflammatory cytokines and coronary plaque components assessed by integrated backscatter intravascular ultrasound. Circ J 2016; 80: 450–460.
- 9.
Yamazaki H, Yamaguchi K, Soeki T, Wakatsuki T, Niki T, Taketani Y, et al. Impact of indoxyl sulfate, a uremic toxin, on non-culprit coronary plaque composition assessed on integrated backscatter intravascular ultrasound. Circ J 2015; 79: 1773–1779.
- 10.
Shimbo Y, Suzuki S, Ishii H, Shibata Y, Tatami Y, Harata S, et al. Association of estimated glomerular filtration rate and proteinuria with lipid-rich plaque in coronary artery disease. Circ J 2015; 79: 2263–2270.
- 11.
Pasceri V, Patti G, Nusca A, Pristipino C, Richichi G, Di Sciascio G, et al. Randomized trial of atorvastatin for reduction of myocardial damage during coronary intervention: Results from the ARMYDA (Atorvastatin for Reduction of MYocardial Damage during Angioplasty) study. Circulation 2004; 110: 674–678.
- 12.
Mintz GS, Nissen SE, Anderson WD, Bailey SR, Erbel R, Fitzgerald PJ, et al. American College of Cardiology Clinical Expert Consensus Document on standards for acquisition, measurement and reporting of Intravascular Ultrasound Studies (IVUS): A report of the American College of Cardiology Task Force on clinical expert consensus documents. J Am Coll Cardiol 2001; 37: 1478–1492.
- 13.
Kawasaki M, Takatsu H, Noda T, Sano K, Ito Y, Hayakawa K, et al. In vivo quantitative tissue characterization of human coronary arterial plaques by use of integrated backscatter intravascular ultrasound and comparison with angioscopic findings. Circulation 2002; 105: 2487–2492.
- 14.
Ando H, Amano T, Matsubara T, Uetani T, Nanki M, Marui N, et al. Comparison of tissue characteristics between acute coronary syndrome and stable angina pectoris: An integrated backscatter intravascular ultrasound analysis of culprit and non-culprit lesions. Circ J 2011; 75: 383–390.
- 15.
Huang Y, Mironova M, Lopes-Virella MF. Oxidized LDL stimulates matrix metalloproteinase-1 expression in human vascular endothelial cells. Arterioscler Thromb Vasc Biol 1999; 19: 2640–2647.
- 16.
Xu XP, Meisel SR, Ong JM, Kaul S, Cercek B, Rajavashisth TB, et al. Oxidized low-density lipoprotein regulates matrix metalloproteinase-9 and its tissue inhibitor in human monocyte-derived macrophages. Circulation 1999; 99: 993–998.
- 17.
Li D, Liu L, Chen H, Sawamura T, Ranganathan S, Mehta JL. LOX-1 mediates oxidized low-density lipoprotein-induced expression of matrix metalloproteinases in human coronary artery endothelial cells. Circulation 2003; 107: 612–617.
- 18.
Li D, Liu L, Chen H, Sawamura T, Mehta JL. LOX-1, an oxidized LDL endothelial receptor, induces CD40/CD40L signaling in human coronary artery endothelial cells. Arterioscler Thromb Vasc Biol 2003; 23: 816–821.
- 19.
Holvoet P, Collen D. Oxidized lipoproteins in atherosclerosis and thrombosis. FASEB J 1994; 8: 1279–1284.
- 20.
Haberland ME, Fong D, Cheng L. Malondialdehyde-altered protein occurs in atheroma of Watanabe heritable hyperlipidemic rabbits. Science 1988; 241: 215–218.
- 21.
Requena JR, Fu MX, Ahmed MU, Jenkins AJ, Lyons TJ, Baynes JW, et al. Quantification of malondialdehyde and 4-hydroxynonenal adducts to lysine residues in native and oxidized human low-density lipoprotein. Biochem J 1997; 322: 317–325.
- 22.
Hiro T, Leung CY, Russo RJ, Moussa I, Karimi H, Farvid AR, et al. Variability in tissue characterization of atherosclerotic plaque by intravascular ultrasound: A comparison of four intravascular ultrasound systems. Am J Card Imaging 1996; 10: 209–218.
- 23.
Sano K, Kawasaki M, Ishihara Y, Okubo M, Tsuchiya K, Nishigaki K, et al. Assessment of vulnerable plaques causing acute coronary syndrome using integrated backscatter intravascular ultrasound. J Am Coll Cardiol 2006; 47: 734–741.
- 24.
Amano T, Matsubara T, Uetani T, Kato M, Kato B, Yoshida T, et al. Lipid-rich plaques predict non-target-lesion ischemic events in patients undergoing percutaneous coronary intervention. Circ J 2011; 75: 157–166.
- 25.
Stone GW, Maehara A, Lansky AJ, de Bruyne B, Cristea E, Mintz GS, et al. A prospective natural-history study of coronary atherosclerosis. N Engl J Med 2011; 364: 226–235.
- 26.
Takeuchi H, Morino Y, Matsukage T, Masuda N, Kawamura Y, Kasai S, et al. Impact of vascular remodeling on the coronary plaque compositions: An investigation with in vivo tissue characterization using integrated backscatter-intravascular ultrasound. Atherosclerosis 2009; 202: 476–482.
- 27.
Burke AP, Kolodgie FD, Farb A, Weber D, Virmani R. Morphological predictors of arterial remodeling in coronary atherosclerosis. Circulation 2002; 105: 297–303.
- 28.
Ito T, Fujita H, Tani T, Ohte N. Malondialdehyde-modified low-density lipoprotein is a predictor of cardiac events in patients with stable angina on lipid-lowering therapy after percutaneous coronary intervention using drug-eluting stent. Atherosclerosis 2015; 239: 311–317.
- 29.
Tamura A, Watanabe T, Nasu M. Effects of atorvastatin and pravastatin on malondialdehyde-modified LDL in hypercholesterolemic patients. Circ J 2003; 67: 816–820.
- 30.
Kondo A, Morita H, Nakamura H, Kotani K, Kobori K, Ito S, et al. Influence of fibrate treatment on malondialdehyde-modified LDL concentration. Clin Chim Acta 2004; 339: 97–103.
- 31.
Hattori K, Ozaki Y, Ismail TF, Okumura M, Naruse H, Kan S, et al. Impact of statin therapy on plaque characteristics as assessed by serial OCT, grayscale and integrated backscatter-IVUS. JACC Cardiovasc Imaging 2012; 5: 169–177.