Abstract
Background:
Single-phase myocardial computed tomography perfusion (CTP) is useful for detecting myocardial ischemia, but determining the optimal scan time is difficult. The present study evaluated this by analyzing dynamic CTP data.
Methods and Results:
We retrospectively selected 32 patients, all of whom had undergone stress dynamic CTP and magnetic resonance myocardial perfusion imaging (MR-MPI). Myocardial ischemia was assessed by MR-MPI using the 16-segment model. Whole-heart dynamic CTP data were acquired for 30 consecutive heartbeats without spatial or temporal gaps using a wide-detector CT, and redistributed into 11 series of single-phase CTP acquired from –2 s to 8 s from the time of maximal enhancement (Tmax) in the ascending aorta. Single-phase CTP images were visually assessed at the segment level, and diagnostic performance of single-phase CTP images for detecting myocardial ischemia was compared with dynamic CTP. Of 512 segments, 177 segments (35%) were diagnosed as ischemic by MR-MPI. The diagnostic accuracy of single-phase CTP acquired at 2–6 s from Tmax in the ascending aorta (median 86%, range 84–87%) was comparable to that of dynamic CTP.
Conclusions:
The optimal scan time for detecting myocardial ischemia with single-phase CTP was at 2–6 s from Tmax in the ascending aorta. (Circ J 2016; 80: 2506–2512)
Coronary computed tomography angiography (CTA) is a useful tool with high diagnostic performance for noninvasive assessment of coronary artery stenosis.1,2
However, severe calcification, motion artifacts, and coronary stenting often affect the coronary CTA assessment.3,4
Moreover, coronary artery stenosis does not always cause myocardial ischemia.5,6
Coronary CTA is less able to accurately diagnose myocardial ischemia, which affects therapeutic decision-making and prognosis in patients with coronary artery disease (CAD).7,8
Myocardial perfusion imaging (MPI: eg, single-photon emission computed tomography or cardiac magnetic resonance [MR]) is used to detect myocardial ischemia. Recent studies state that myocardial CT perfusion (CTP) with pharmacological stress can be used to assess myocardial ischemia using single-phase CTP.9–11
However, it is difficult to determine whether the CTP image has been obtained at the optimal scan time that allows for a clear distinction between normal and ischemic myocardium. This is because the optimal scan time varies according to several factors, such as the severity of the coronary lesion and cardiac function. Bischoff et al reported that the optimal scan time for single-phase CTP was 2–10 s from the time of maximal enhancement (Tmax) in the ascending aorta,12
but they used a narrow-detector CT that did not cover the whole heart and provided dynamic perfusion data with temporal and spatial gaps caused by alternative table movement. In contrast, the wide-detector CT scanner we used enables data acquisition for the whole heart in every cardiac cycle without temporal or spatial gaps.13
Thus, we aimed to investigate the optimal scan time and diagnostic performance of single-phase CTP for detecting myocardial ischemia by analyzing dynamic CTP series data for the whole heart in a derivation cohort study.
Methods
Study Population
Between January 2013 and March 2015, 32 patients who had undergone dynamic CTP and cardiac MR within 30 days, were retrospectively selected from the medical records. The study was approved by the institutional review board, and registered as a retrospective study at the Protocol Registration System of the UMIN Clinical Trials Registry (UMIN000015700). The patients had been screened for CAD either because they had angina (chest pain, documented ST change on ECG, or symptoms relieved by administration of nitroglycerin) or multiple coronary risk factors for CAD. The indications for cardiac CT and MR were clinically determined at the attending physician’s discretion. The exclusion criteria were as follows: (1) acute/old myocardial infarction (clinical information), (2) cardiomyopathy, (3) left ventricular (LV) ejection fraction <20%, (4) atrial fibrillation, (5) complete left bundle branch block, (6) valvular heart disease, (7) history of percutaneous coronary intervention and coronary artery bypass graft, (8) unrecognized myocardial infarction assessed by late gadolinium enhancement (LGE) imaging, and (9) insufficient image quality or narrow coverage of field of view for entire heart on CTP and MR-MPI.
Radiation dose was calculated by dose-length product in a dose report (conversion factor=0.014).
Cardiac CT Scan Protocol
The cardiac CT scan protocol was used for the assessment of CAD as previously described.13
A 256-slice multidetector row CT unit (Brilliance iCT, Philips Healthcare, Cleveland, OH, USA) and an automatic dual injector (Stellant DualFlow; Nihon Medrad KK, Osaka, Japan) were used. A timing bolus scan was performed at the proximal ascending aorta, with a bolus injection of 20% diluted solution (5.0 ml/s for 10 s) of contrast material (CM) (iopamidol 370 mg iodine/ml; Bayer Yakuhin, Ltd, Osaka, Japan) and saline, followed by a saline chaser (5.0 ml/s for 4 s). The delay time for starting dynamic CTP was calculated as 6 s before the CM arrived in the proximal ascending aorta. At 3 min after adenosine triphosphate loading (adenosine triphosphate 20 mg; Daiichi Sankyo Inc, Tokyo, Japan; 0.16 mg/kg/min, for 5 min), dynamic CTP was performed for 30 consecutive heartbeats, with the prospective ECG-gated dynamic mode targeting a phase of 40% RR interval (systolic phase) under a single breath-hold in the expiration position to shorten the craniocaudal length of the heart, using CM (5.0 ml/s for 10 s) followed by a saline chaser (5.0 ml/s for 4 s). Subsequently, coronary CTA was performed in the prospective or retrospective ECG-gated scan mode with targeting a phase of 75% RR interval (mid-diastolic phase). Scan parameters for dynamic CTP were as follows: detector collimation, 64×1.25 mm; tube voltage, 100 kV; and tube current-time product, 80 mAs.
Post Processing of Dynamic CTP
The stress dynamic CTP series were reconstructed using 3-mm transaxial sections, a 360° reconstruction algorithm, and a spatiotemporal diffusion filter (Philips Healthcare). A dynamic series of contiguous short-axis sections with 8-mm thickness was obtained from the apex to the base of the left ventricle using multi-planar reformation without overlap (Ziostation 2, Ziosoft, Inc, Tokyo, Japan). The region of interest was set at the proximal ascending aorta to analyze the time-attenuation curves, and Tmax in the ascending aorta was determined as the reference time (0 s). For all dynamic CTP data, 11 series of single-phase CTP images per second were obtained from –2 s to 8 s from Tmax in the ascending aorta (Figure 1).
Cardiac MR Protocol and Image Analysis
An established protocol was used for stress/rest MR perfusion and LGE imaging by a 3T system (Achieva 3.0 T Quasar Dual; Philips Healthcare, Best, The Netherlands, maximum gradient amplitude: 80 mT/m, slew rate: 200 mT/m/ms) equipped with a dedicated cardiac software package and a 32-element cardiac phased-array coil (16 posterior elements, 16 anterior elements).14
After adenosine triphosphate infusion (0.16 mg/min/kg over 3 min), dynamic MR-MPI was performed during every cardiac cycle for 35 s with a bolus injection of a gadolinium-based CM (0.1 mmol/kg gadopentetate dimeglumine, Magnevist; Schering, Germany; injection rate, 4 ml/s) and a saline flush (30 ml, 4 ml/s). The perfusion sequence was acquired in 3 identical short-axis locations (basal-, mid-, and apical left ventricle) using a 2D T1 turbo field-echo sequence with the k-space and time broad-use linear acquisition speed-up technique (k-t BLAST). Imaging parameters were as follows: repetition time, 3.7 ms; echo time, 1.85 ms; flip angle 20°; section thickness, 8 mm; field of view, 400 mm; matrix size, 256×179; and k-t BLAST factor, 5. After 10 min, the same perfusion imaging sequence, with a second dose of a gadolinium-based CM (0.1 mmol/kg body weight [total dose 0.2 mmol/kg]) was repeated without pharmacological stress to obtain at-rest perfusion images. LGE images were obtained with an inversion-recovery 3D T1 turbo field-echo sequence 10 min after administration of the second dose of CM. The imaging parameters for this part of the study were as follows: repetition time, 3.5 ms; echo time, 1.69 ms; inversion time, 400–500 ms (adjusted to the null signal of the normal myocardium using the Look Locker sequence); flip angle, 15°; section thickness, 6 mm; field of view, 350 mm; matrix size, 224×157; and SENSE factor, 2.
Two experienced radiologists (one with 9 years and one with 12 years of cardiac MR experience) analyzed all MR images visually and blindly through consensus. Using the 16-segment model excluding the apex,15
all myocardial segments were classified into 2 groups: (1) normal segment, segment with normal perfusion on stress and rest images, and non-LGE; (2) ischemic segment, a segment with a PD (≥25% of the LV wall thickness) not contaminated by dark rim artifact, persisting for at least 10 frames in a stress image, and non-LGE.13
Assessment of Dynamic Myocardial and Single-Phase CTP for Detecting Myocardial Ischemia
Three representative short-axial CTP images (basal-, mid-, and apical left ventricle) as similar as MR-MPI images were selected by an independent observer (one with 4 years of experience in cardiac CT and MR). Two experienced radiologists, who were blinded to all other data (one with 6 years and one with 15 years of experience in cardiac CT), visually and independently assessed single-phase CTP for detecting myocardial ischemia as hypoperfused areas according to the 16-segment model.15
Window width and level were set in 300/150 or 200/100 Hounsfield units (HU).16
The final assessment was obtained through consensus. Separate readings of the 11 series of single-phase CTP images were performed in random order, spaced at 2-week intervals to minimize recall bias. Another independent radiologist (8 years of experience in cardiac CT) visually and blindly assessed dynamic CTP for detecting myocardial ischemia in the same way as for single-phase CTP.
An additional observer (one with 8 years of experience in cardiac CT and MR) set the region of interest in each myocardial segment (size: 100–150 mm2, short-axis slices) using another dedicated workstation (Synapse Vincent, Fuji Medical Systems, Tokyo, Japan) (Figure 2). The time differences in Tmax for the ascending aorta and the myocardium and the peak CT attenuation were measured by analyzing the time-attenuation curves at the segment level.
Statistical Analysis
All data are expressed as the mean±standard deviation or median (25 and 75 percentile) as appropriate. Heart rate was compared in the pharmacological stress and rest states by Student’s t-test. The time difference and peak CT attenuation were compared between normal and ischemic segments using the Mann-Whitney U-test. The interobserver variability for visual assessment of single-phase CTP images was evaluated by Cohen k statistic. For dynamic CTP and single-phase CTP images, we estimated the sensitivity, specificity, positive and negative predictive value (PPV and NPV), and accuracy for detecting myocardial ischemia. A chi-squared test with the Bonferroni correction was used to compare the accuracy of each single-phase CTP image with that of dynamic CTP. In all tests, statistical significance was determined at P<0.05. Statistical analyses were performed with SPSS version 21 (SPSS, Chicago, IL, USA).
Results
Study Population
None of the 32 patients experienced worsening of CAD during the 30-day imaging session. Their characteristics are shown in
Table 1. The 10-year CAD death pre-test probabilities were 0.5–1% (n=3), 1–2% (n=5), 2–5% (n=6), 5–10% (n=12), >10% (n=6), according to a risk assessment based on a 19-year follow-up study of a Japanese representative population study (NIPPON DATA 80).17
In the present study, the whole-heart dynamic CTP series of contiguous short-axis views was successfully acquired without spatial or temporal gaps in all patients. Heart rate significantly increased from 64.2±10.6 beats/min to 79.8±12.4 beats/min (P<0.05) in dynamic CTP. The mean effective radiation dose was 10.6±0.1 mSv and 6.0±3.4 mSv for CTP and coronary CTA, respectively.
Table 1.
Characteristics of the Patients Screened for CAD
| n |
32 |
| Age (years) |
68.2±9.9 |
| Men (% of total) |
24 (75) |
| Body mass index (kg/m2) |
25.4±3.3 |
| Risk factors (n, %) |
| Hypertension |
18 (56) |
| Dyslipidemia |
20 (63) |
| Diabetes mellitus |
11 (34) |
| Positive smoking history |
15 (47) |
| Family history of CAD |
10 (31) |
| Symptoms (n, %) |
| Effort angina |
23 (72) |
| Rest angina |
3 (9) |
| Asymptomatic |
6 (19) |
| Heart rate (beats/min) |
| Rest |
64.2±10.6 |
| Stress |
79.8±12.4 |
Data are presented as n (%) and mean±standard deviation as appropriate. CAD, coronary artery disease.
Among a total of 512 segments, 335 (65%) were diagnosed as normal, and 177 (35%) were diagnosed as ischemic by the combined assessment of MR-MPI.
The time difference in Tmax between the ascending aorta and normal myocardium was significantly shorter than that in ischemic myocardium [3.6 s (2.6–4.0) vs. 5.5 s (4.3–6.6), P<0.05]. Additionally, the peak CT attenuation in normal segments was significantly higher than that in ischemic segments [124.4 HU (113.9–140.0) vs. 107.1 HU (97.5–116.0), P<0.05] (Figures 3A,B).
Diagnostic Performance of Single-Phase CTP Imaging for Detecting Myocardial Ischemia
Regarding the reproducibility of visual CTP assessment, concordance of the observers was 0.83 in all 512 segments, indicating good interobserver reproducibility.
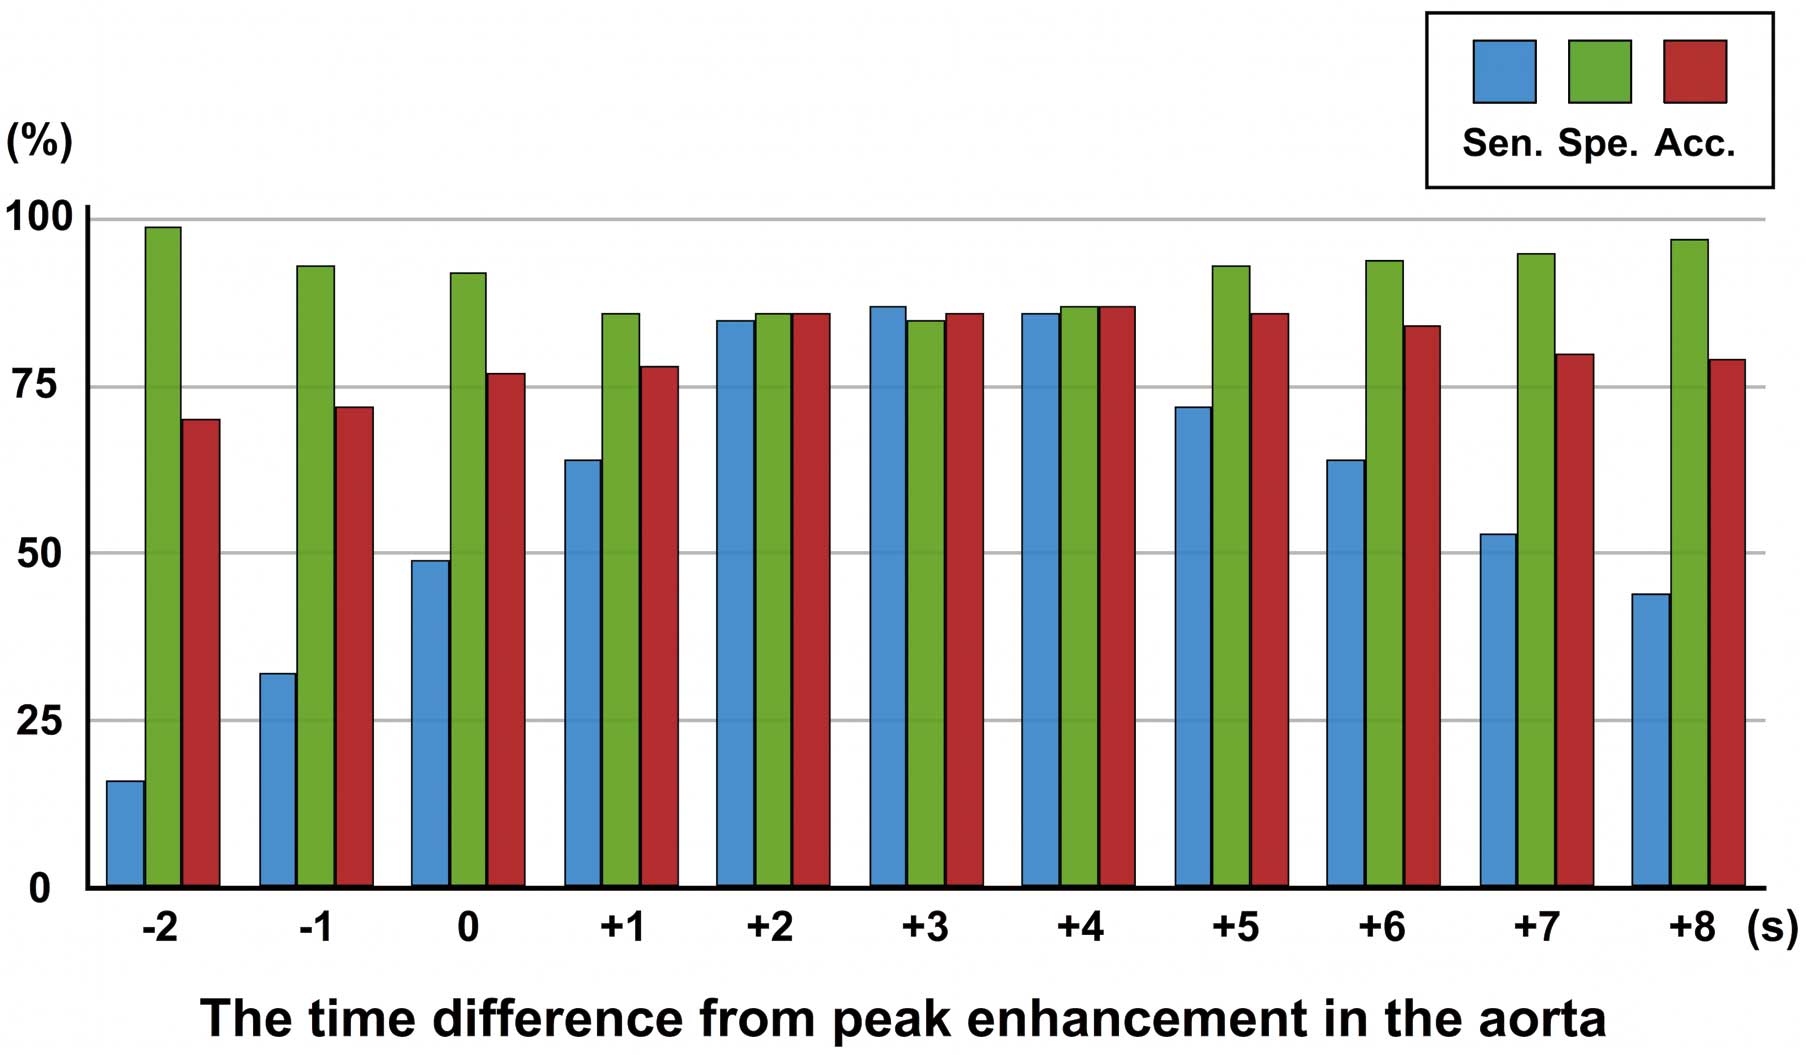
The diagnostic performance of all series of single-phase CTP and dynamic CTP is shown in
Table 2. In all series of single-phase CTP, the single-phase CTP at 3 s from Tmax in the ascending aorta had the highest sensitivity of 87% for detection of myocardial ischemia; the single-phase CTP at –2 s from Tmax in the ascending aorta had the highest specificity of 99%; and the single-phase CTP at 4 s from Tmax in the ascending aorta had the highest accuracy of 87% (Figure 4). Finally, there was no significant difference in accuracy for detecting myocardial ischemia between dynamic CTP and single-phase CTP acquired at 2–6 s. A representative case of severe stenosis is shown in
Figure 5.
Table 2.
Diagnostic Performance of Dynamic Myocardial CTP and Single-Phase CTP for Detecting Myocardial Ischemia
| |
Sensitivity
(%) |
Specificity
(%) |
PPV
(%) |
NPV
(%) |
Accuracy
(%) |
| Dynamic CTP |
88 |
87 |
78 |
93 |
87 |
| Single-phase CTP [time phase of CTP (s)**] |
| −2 |
16 |
99 |
85 |
69 |
70* |
| −1 |
32 |
93 |
71 |
72 |
72* |
| +0 |
49 |
92 |
76 |
77 |
77* |
| +1 |
64 |
86 |
71 |
82 |
78* |
| +2 |
85 |
86 |
76 |
91 |
86 |
| +3 |
87 |
85 |
76 |
93 |
86 |
| +4 |
86 |
87 |
78 |
92 |
87 |
| +5 |
72 |
93 |
85 |
86 |
86 |
| +6 |
64 |
94 |
85 |
83 |
84 |
| +7 |
53 |
95 |
84 |
79 |
80* |
| +8 |
44 |
97 |
88 |
77 |
79* |
**Time-phase of CTP expressed as the time difference in single-phase CTP from the time point of maximal enhancement in the ascending aorta. *P<0.05 vs. accuracy of dynamic CTP. CTP, computed tomography perfusion; PPV, positive predictive value; NPV, negative predictive value.
Discussion
The present study showed that (1) the optimal scan time for single-phase CTP was 2–6 s from Tmax in the ascending aorta, and (2) the optimal scan time provided good diagnostic performance of single-phase CTP for detecting myocardial ischemia.
Visual assessment of myocardial ischemia as low attenuation areas is based on the lower CT attenuation of the ischemic myocardium in comparison with normal myocardium.18
Our study also showed that the time point of maximal enhancement was later and the peak CT attenuation was lower in ischemic myocardium, compared with normal myocardium. Among the 11 series of single-phase CTP images, the single-phase CTP image acquired at 2–6 s from Tmax in the ascending aorta had high accuracy for detecting myocardial ischemia and was comparable to dynamic CTP. This result is partially concordant with a previous report by Bischoff et al12
that indicated the optimal scan time for single-phase CTP was 2–10 s from Tmax in the ascending aorta. However, these findings were based on a study population with severe coronary artery stenosis (79±15%), which may have affected their results as shown in
Figure 5.19–21
Moreover, their results might have been affected by the use of a narrow-detector CT, which provided heterogeneous dynamic CTP data with temporal and spatial gaps.12,20
In the present study, dynamic CTP scanning was performed with a high sampling rate using a wide-detector CT, which yielded whole-heart dynamic CTP data without temporal or spatial gaps.13
We consider the CTP data obtained in the present study as better for evaluating the optimal scan time of single-phase CTP for detecting myocardial ischemia.
Dynamic CTP and single-phase CTP each has advantages and disadvantages. With dynamic CTP it is easy to obtain the optimal scan time for detecting myocardial ischemia, and to quantify myocardial perfusion parameters such as myocardial blood flow,13
but it requires an appropriate study population, higher radiation dose, and a wider and faster CT scanner. Single-phase CTP, on the other hand, saves on radiation dose, and the procedure is not complicated compared with dynamic CTP, but does require individual adjustment for the optimal scan time.
According to our results, the diagnostic performance of single-phase CTP acquired at 2–6 s from Tmax in the ascending aorta had the potential to be equivalent to that of dynamic CTP, but substantially reducing radiation exposure. Huber et al also indicated that single-phase CTP had a similar performance to the dynamic CTP in the detection of myocardial ischemia if the single-phase CTP was acquired at the optimal scan time.18
This optimal time period is also beneficial when using 64-slice CT to obtain single-phase CTP images at suboptimal scan timing. However, the optimal scan time may vary substantially according to each case, because the Tmax in the ascending aorta is not necessarily always the same, and it is difficult to determine the optimal scan timing using a conventional bolus tracking technique. In contrast, a modified timing bolus scan with diluted CM using the same injection rate and volume as for the real scan can obtain a similar time-attenuation curve although the peak enhancements are different. This physiological characteristics, which Kawaguchi et al used for their estimation of the time to arterial peak enhancement for subsequent coronary CT angiography,22
was applied to the present stress dynamic CTP study. This could also be helpful for prospective determination of the optimal scan time for single-phase CTP. However, in clinical practice, some particular patients, such as those with low cardiac function or cardiomyopathy, are contraindicated for single-phase CTP. As for patients with coronary artery bypass grafting, the time period for the single-phase scan might be insufficient for myocardial perfusion assessment because there is different myocardial blood flow in original and bypass routes. Regarding these points, the clinical application of single-phase CTP might be limited in comparison with dynamic CTP, and thus we should decide the CTP scan mode according to the individual patient.
Study Limitations
First, it had a retrospective design and a small sample size. Second, coronary CTA data were not analyzed because we focused on the diagnostic performance of CTP for detecting myocardial ischemia in comparison with MR-MPI at the segment level. Third, visual assessment of single-phase CTP images was used to evaluate the diagnostic performance of CTP, but there was good reproducibility and high diagnostic performance of visual CTP assessment, and semiquantitative assessment of single-phase CTP may be an option as described by Yang et al.23
Finally, this retrospective cohort study to assess the optimal scan time for single-phase CTP, and the present results should be validated in a future prospective study.
In conclusion, the optimal scan time for single-phase CTP to detect myocardial ischemia was 2–6 s from Tmax in the ascending aorta. This result could help optimize single-phase CTP imaging in the detection of myocardial ischemia with high diagnostic performance.
Conflicts of Interest
The authors have no financial relationships to disclose.
References
- 1.
Miller JM, Rochitte CE, Dewey M, Arbab-Zadeh A, Niinuma H, Gottlieb I, et al. Diagnostic performance of coronary angiography by 64-row CT. N Engl J Med 2008; 359: 2324–2336.
- 2.
Budoff MJ, Dowe D, Jollis JG, Gitter M, Sutherland J, Halamert E, et al. Diagnostic performance of 64-multidetector row coronary computed tomographic angiography for evaluation of coronary artery stenosis in individuals without known coronary artery disease: Results from the prospective multicenter ACCURACY (Assessment by Coronary Computed Tomographic Angiography of Individuals Undergoing Invasive Coronary Angiography) trial. J Am Coll Cardiol 2008; 52: 1724–1732.
- 3.
Ong TK, Chin SP, Liew CK, Chan WL, Seyfarth MT, Liew HB, et al. Accuracy of 64-row multidetector computed tomography in detecting coronary artery disease in 134 symptomatic patients: Influence of calcification. Am Heart J 2006; 151: 1323.e1–e6.
- 4.
Arbab-Zadeh A, Miller JM, Rochitte CE, Dewey M, Niinuma H, Gottlieb I, et al. Diagnostic accuracy of computed tomography coronary angiography according to pre-test probability of coronary artery disease and severity of coronary arterial calcification: The Core-64 (Coronary Artery Evaluation Using 64-Row Multidetector Computed Tomography Angiography) International Multicenter Study. J Am Coll Cardiol 2012; 59: 379–387.
- 5.
Schuijf JD, Wijns W, Jukema JW, Atsma DE, de Roos A, Lamb HJ, et al. Relationship between noninvasive coronary angiography with multi-slice computed tomography and myocardial perfusion imaging. J Am Coll Cardiol 2006; 48: 2508–2514.
- 6.
Meijboom WB, Van Mieghem CA, van Pelt N, Weustink A, Pugliese F, Mollet NR, et al. Comprehensive assessment of coronary artery stenoses: Computed tomography coronary angiography versus conventional coronary angiography and correlation with fractional flow reserve in patients with stable angina. J Am Coll Cardiol 2008; 52: 636–643.
- 7.
Hachamovitch R, Di Carli MF. Methods and limitations of assessing new noninvasive tests: Part II: Outcomes-based validation and reliability assessment of noninvasive testing. Circulation 2008; 117: 2793–2801.
- 8.
Shaw LJ, Berman DS, Maron DJ, Mancini GB, Hayes SW, Hartigan PM, et al; COURAGE Investigators. Optimal medical therapy with or without percutaneous coronary intervention to reduce ischemic burden: Results from the Clinical Outcomes Utilizing Revascularization and Aggressive Drug Evaluation (COURAGE) trial nuclear substudy. Circulation 2008; 117: 1283–1291.
- 9.
Cury RC, Magalhães TA, Borges AC, Shiozaki AA, Lemos PA, Júnior JS, et al. Dipyridamole stress and rest myocardial perfusion by 64-detector row computed tomography in patients with suspected coronary artery disease. Am J Cardiol 2010; 106: 310–315.
- 10.
Magalhães TA, Cury RC, Pereira AC, Moreira Vde M, Lemos PA, Kalil-Filho R, et al. Additional value of dipyridamole stress myocardial perfusion by 64-row computed tomography in patients with coronary stents. J Cardiovasc Comput Tomogr 2011; 5: 449–458.
- 11.
Bettencourt N, Chiribiri A, Schuster A, Ferreira N, Sampaio F, Pires-Morais G, et al. Direct comparison of cardiac magnetic resonance and multidetector computed tomography stress-rest perfusion imaging for detection of coronary artery disease. J Am Coll Cardiol 2013; 61: 1099–1107.
- 12.
Bischoff B, Bamberg F, Marcus R, Schwarz F, Becker HC, Becker A, et al. Optimal timing for first-pass stress CT myocardial perfusion imaging. Int J Cardiovasc Imaging 2013; 29: 435–442.
- 13.
Tanabe Y, Kido T, Uetani T, Kurata A, Kono T, Ogimoto A, et al. Differentiation of myocardial ischemia and infarction assessed by dynamic computed tomography perfusion imaging and comparison with cardiac magnetic resonance and single-photon emission computed tomography. Eur Radiol 2016; 26: 3790–3801.
- 14.
Kido T, Nagao M, Kido T, Kurata A, Miyagawa M, Ogimoto A, et al. Stress/rest circumferential strain in non-ischemia, ischemia, and infarction: Quantification by 3 Tesla tagged magnetic resonance imaging. Circ J 2013; 77: 1235–1241.
- 15.
Cerqueira MD, Weissman NJ, Dilsizian V, Jacobs AK, Kaul S, Laskey WK, et al; American Heart Association Writing Group on Myocardial Segmentation and Registration for Cardiac Imaging. Standardized myocardial segmentation and nomenclature for tomographic imaging of the heart: A statement for healthcare professionals from the Cardiac Imaging Committee of the Council on Clinical Cardiology of the American Heart Association. Circulation 2002; 105: 539–542.
- 16.
Mehra VC, Valdiviezo C, Arbab-Zadeh A, Ko BS, Seneviratne SK, Cerci R, et al. A stepwise approach to the visual interpretation of CT-based myocardial perfusion. J Cardiovasc Comput Tomogr 2011; 5: 357–369.
- 17.
NIPPON DATA80 Research Group. Risk assessment chart for death from cardiovascular disease based on a 19-year follow-up study of a Japanese representative population. Circ J 2006; 70: 1249–1255.
- 18.
Huber AM, Leber V, Gramer BM, Muenzel D, Leber A, Rieber J, et al. Myocardium: Dynamic versus single-shot CT perfusion imaging. Radiology 2013; 269: 378–386.
- 19.
Gould KL, Lipscomb K, Hamilton GW. Physiologic basis for assessing critical coronary stenosis: Instantaneous flow response and regional distribution during coronary hyperemia as measures of coronary flow reserve. Am J Cardiol 1974; 33: 87–94.
- 20.
Rossi A, Uitterdijk A, Dijkshoorn M, Klotz E, Dharampal A, van Straten M, et al. Quantification of myocardial blood flow by adenosine-stress CT perfusion imaging in pigs during various degrees of stenosis correlates well with coronary artery blood flow and fractional flow reserve. Eur Heart J Cardiovasc Imaging 2013; 14: 331–338.
- 21.
Schwarz F, Hinkel R, Baloch E, Marcus RP, Hildebrandt K, Sandner TA, et al. Myocardial CT perfusion imaging in a large animal model: Comparison of dynamic versus single-phase acquisitions. JACC Cardiovasc Imaging 2013; 6: 1229–1238.
- 22.
Kawaguchi N, Kurata A, Kido T, Nishiyama Y, Kido T, Miyagawa M, et al. Optimization of coronary attenuation in coronary computed tomography angiography using diluted contrast material. Circ J 2014; 78: 662–670.
- 23.
Yang DH, Kim YH, Roh JH, Kang JW, Han D, Jung J, et al. Stress myocardial perfusion CT in patients suspected of having coronary artery disease: Visual and quantitative analysis-validation by using fractional flow reserve. Radiology 2015; 276: 715–723.