Abstract
Background:
The effects of eicosapentaenoic acid (EPA) on coronary artery disease have been previously reported; however, those of the addition of EPA to strong statins on coronary plaque components and local inflammatory cytokines are not known.
Methods and Results:
A total of 95 patients who had been treated with strong statin for at least 6 months were randomized into 2 groups: an EPA group (additional treatment with EPA at 1,800 mg/day, n=48) or a control group (no additional treatment, n=47), for 6 months. The tissue characteristics of target coronary plaque in each patient were analyzed using IB-IVUS before and after treatment. We also measured plasma levels of inflammatory cytokines sampled in the coronary sinus (CS) and peripheral vein.
A significant reduction in lipid volume (18.5±1.3 to 15.0±1.5 mm3, P=0.007) and a significant increase in fibrous volume (22.9±0.8 to 25.6±1.1 mm3, P=0.01) were observed in IB-IVUS image analyses in the EPA group, but no significant changes in the plaque components in the control group. CS levels of pentraxin 3 and monocyte chemoattractant protein-1 were lower after than before treatment with EPA (3.3±2.1 to 2.6±1.2 ng/ml, 120.4±26.2 to 110.2±26.8 pg/ml, P=0.015 and P=0.008, respectively); however, there were no significant changes in those inflammatory cytokines between pre- and post-treatment in the control group.
Conclusions:
The addition of EPA was associated with reduced lipid volume in coronary plaques and decreased inflammatory cytokines. (Circ J 2016; 80: 450–460)
Many epidemiologic studies have shown a significant inverse association between increased intake of long-chain n-3 polyunsaturated fatty acids, especially eicosapentaenoic acid (EPA) and docosahexaenoic acid, and cardiovascular or cerebrovascular disease.1–7
A large-scale intervention clinical trial (Japan EPA Lipid Intervention Study: JELIS) that included hypercholesterolemic patients showed that long-term use of EPA (1,800 mg/day), in addition to statin therapy, significantly reduced the incidence of major coronary events.8
Subanalysis of JELIS also showed that EPA reduced the incidence of recurrent stroke or coronary artery disease in the high-risk group.9,10
Proposed mechanisms to explain these findings include reduced triglyceride concentrations,11
antiarrhythmic effects,12
decreased platelet aggregation,13
improved vascular reactivity,14
decreased inflammation15
and lowered blood pressure.16
However, the effects of EPA on the coronary plaque components and inflammatory cytokines are not known. Our hypothesis was that the addition of EPA to strong statin treatment could further stabilize plaque components and the local inflammatory reaction of coronary arteries in patients with stable angina.
Editorial p 321
Integrated backscatter intravascular ultrasound (IB-IVUS) has recently become available, by which plaque properties can be diagnosed by combining spectral parameters of posterior-scattering signals of IVUS.17–23
We aimed to assess the additional effects of EPA on coronary plaque by IB-IVUS and to measure local plasma levels of inflammatory cytokines in patients who had been treated with strong statins.
Methods
Patients and Study Design
This study was designed as a blocked-randomization, open-label, single-center study that included dyslipidemic patients with stable angina pectoris planned to be treated with a bare-metal stent because previous coronary angiography (CAG) had shown significant coronary stenosis, defined as ≥75% angiographic stenosis and mild stenosis defined as <50% in the same coronary branch, and who had been treated with the typical Japanese dose of a strong statin (atorvastatin at 10 mg/day; n=37, pitavastatin at 2 mg/day; n=36, or rosuvastatin at 2.5 mg/day; n=22) for more than 6 months (Figure 1A). Patients with any of the following were excluded from the study: (1) hypersensitivity to high-purity EPA, (2) acute coronary syndrome (ACS), (3) a history of percutaneous coronary intervention (PCI) or coronary artery bypass surgery, (4) renal insufficiency with baseline serum creatinine >2.0 mg/dl, (5) hemodialysis and (6) highly calcified lesions defined as the calcium arc ≥180°. We also excluded patients with severe culprit lesions (long lesion or small reference diameter) that should be treated with a drug-eluting stent (DES). The DES has been reported to induce persistent inflammatory changes of the vascular wall for a long period through combined drug and polymer actions.24,25
It markedly influences inflammatory cytokines, so we excluded patients treated with DES. All patients underwent PCI, and also had IB-IVUS analyses performed in the treated coronary vessel immediately and 6 months after the PCI. Additional EPA treatment was initiated within 24 h after baseline IVUS observation. Peripheral blood samples were collected at the time of admission for PCI and follow-up CAG respectively. The ejection fraction was measured echocardiographically, using the biplane modified Simpson’s rule at the time of admission for PCI. The primary endpoint evaluated in this study was the change in lipid and fibrous plaque components assessed by IB-IVUS after the addition of EPA to existing strong statin therapy. The secondary endpoint was the change in local inflammatory cytokines (described later) levels sampled in the coronary sinus (CS). Patients were observed monthly during regular outpatient visits; there were no cases of death, acute myocardial infarction (AMI), or target vessel revascularization.

Written informed consent was given by all the patients, and the study protocol was approved by the Institutional Review Board of Tokushima University Hospital.
IVUS Data Acquisition
For IVUS observation, ViewIT (40 MHz) (Terumo Co, Tokyo, Japan) was used. Data were collected at 0.5 mm/s auto pullback and analyzed using the IVUS console. For the prevention of coronary spasm, we administered an intracoronary optimal dose of isosorbide dinitrate before measurements. Targeted mild stenosis (<50% diameter stenosis on quantitative CAG) was selected by the presence of an easily definable branch or by the distance from the stent edge, to ensure reliable comparisons between baseline and 6-month follow-up. When slight stenosis was present at 2 or more sites, we selected the lesions with more severe stenosis while excluding those with inadequate IVUS data. Plaques analyzed in this study had to be more than 5 mm from the intervention site. For each plaque we selected an area defined by the narrowest site in the plaque as determined by IVUS, as well as 5 mm both proximally and distally (total length, 10 mm), and extracted 10 frames in 1-mm intervals using a motorized pullback system (Figures 1B,C). Cross-sectional lumen area, cross-sectional vessel area within the external elastic membrane, and plaque area (external elastic membrane area minus lumen area) were determined using software attached to the IVUS system. Plaque volume was calculated using integration.
The definitions of IB values for each histologic category were determined by comparing histologic images, as reported in a previous study.17
Plaque components were classified into 4 types by combining the spectral parameters of posterior-scattering signals of IVUS: lipid pool, fibrosis, dense fibrosis or calcification. The percent area of each component was automatically measured in each plaque. The percent volume was calculated using integration. The IVUS measurements were conducted independently by 2 observers who were blinded to each patient’s clinical characteristics. Measurements of lipid volume were performed in a group of 30 randomly selected records by 1 observer and then repeated on 2 separate days by 2 observers who were unaware of the patient’s clinical characteristics and the measurements of the others and of the study time point.
Blood Sampling and Measurement of Inflammatory Cytokines
Blood sampling was performed by the femoral approach before performing PCI or follow-up CAG. Samples to measure plasma levels of inflammatory cytokines [pentraxin (PTX)3, monocyte chemoattractant protein (MCP)-1, high-sensitivity C-reactive protein (hs-CRP), tumor necrosis factor (TNF)α, interleukin-6, matrix metalloproteinase (MMP)-3, MMP-9] were taken from the CS (Figure 1D) and femoral vein using a coronary venographic catheter (UNITE 5Fr CS 100 cm, Asahi Intecc, Aichi, Japan).
Statistical Analysis
In setting patient numbers, we could not find prior IB-IVUS results to use as a background; therefore, we could not make assumptions about the changes in lipid volume in the EPA-administered and control groups. Instead, patient numbers were determined in an exploratory fashion.
All data are expressed as mean±SD. Testing for significant differences of each parameter between baseline and 6 months was performed using the paired Student’s t-test and testing between groups was performed using the unpaired Student’s t-test. Significance was indicated by P<0.05. Statistical analyses were performed using StatView 5.0 (SAS Institute Inc, Cary, NC, USA).
Results
Patient Population
Between May 2009 and December 2014, 95 patients who were eligible based on the inclusion criteria were enrolled in this study. They were allocated to 2 groups using computer-assisted permuted-block randomization26
with random block size of 4–6: an EPA group (additional treatment with EPA at 1,800 mg/day, n=48) and a control group (no additional treatment, n=47). In total, 36 patients were excluded from this study during the follow-up period because of (1) inadequate IVUS findings (32 patients), (2) no angiographic mild stenosis (1 patient), (3) EPA hypersensitivity (1 patient), (4) refusing follow-up blood sampling from CS (1 patient), and (5) refusing follow-up IVUS study (1 patient). We analyzed the final population of 59 patients (EPA group, n=29; control group, n=30) (Figure 1A).
Baseline Characteristics
There were no significant differences in the baseline characteristics of the 2 groups (Table 1).
Table 1.
Baseline Characteristics of Dyslipidemic Patients With Stable Angina Pectoris
| |
EPA (n=29) |
Control (n=30) |
P value |
| Age (years) |
68.1±10.1 |
69.4±10.7 |
0.49 |
| Male sex |
21 (72) |
19 (63) |
0.45 |
| Hypertension |
29 (100) |
30 (100) |
– |
| DM type 2 |
15 (53) |
15 (50) |
0.89 |
| Current smoker |
0 (0) |
0 (0) |
– |
| Systolic BP (mmHg) |
121.2±9.1 |
119.5±11.9 |
0.14 |
| Diastolic BP (mmHg) |
66.8±7.3 |
66.6±10.6 |
0.98 |
| EPA (μg/ml) |
59.9±23.5 |
71.6±38.7 |
0.13 |
| AA (μg/ml) |
163.7±43.9 |
169.7±38.0 |
0.51 |
| EPA/AA |
0.3±0.2 |
0.4±0.2 |
0.14 |
| HDL-C (mg/dl) |
50.5±13.9 |
54.3±16.2 |
0.40 |
| LDL-C (mg/dl) |
97.7±20.6 |
100.0±31.1 |
0.85 |
| Triglycerides (mg/dl) |
151.3±73.2 |
128.6±58.9 |
0.16 |
| FBS (mg/dl) |
122.7±37.7 |
121.0±30.7 |
0.96 |
| HbA1c (%) |
6.1±1.3 |
6.0±0.7 |
0.16 |
| LVEF (%) |
61.1±10.3 |
62.4±8.3 |
0.32 |
| Culprit coronary artery |
| LAD (%) |
12 (41) |
11 (37) |
0.71 |
| LCx (%) |
7 (24) |
9 (30) |
0.61 |
| RCA (%) |
10 (34) |
10 (33) |
0.93 |
| LMT (%) |
0 (0) |
0 (0) |
– |
| Medications |
| Aspirin |
29 (100) |
30 (100) |
– |
| Thienopyridine |
29 (100) |
30 (100) |
– |
| ACEI |
9 (31) |
7 (23) |
0.51 |
| ARB |
7 (24) |
11 (37) |
0.30 |
| CCB |
13 (45) |
13 (43) |
0.91 |
| β-blocker |
8 (28) |
9 (30) |
0.84 |
Data given as mean±SD or n (%). EPA group, strong statin plus EPA; control group, strong statin only. AA, arachidonic acid; ACEI, angiotensin-converting enzyme inhibitor; ARB, angiotensin II receptor blocker; BP, blood pressure; CCB, calcium-channel blocker; DM, diabetes mellitus; EPA, eicosapentaenoic acid; FBS, fasting blood sugar; HbA1c, hemoglobin A1c; HDL-C, high-density-lipoprotein cholesterol; LAD, left anterior descending; LCx, left circumflex; LDL-C, low-density-lipoprotein cholesterol; LMT, left main trunk; LVEF, left ventricular ejection fraction; RCA, right coronary artery.
Serum EPA level and EPA/AA ratio were significantly increased in the EPA group; however, there were no significant changes in this level or this ratio in the control group. There were no significant changes in serum AA, lipid level, glucose and blood pressure between baseline and follow-up in either group (Table 2).
Table 2.
Changes in EPA, AA, Lipids, Glucose and BP of Dyslipidemic Patients With Stable Angina Pectoris
| |
Baseline |
Follow-up |
P value |
| EPA (μg/ml) |
| EPA |
59.9±23.5 |
174.0±47.6* |
<0.0001 |
| Control |
71.6±38.7 |
67.6±39.3 |
0.65 |
| AA (μg/ml) |
| EPA |
151.2±43.9 |
143.5±38.5 |
0.09 |
| Control |
169.7±38.0 |
178.9±39.6 |
0.27 |
| EPA/AA |
| EPA |
0.3±0.2 |
1.3±0.5** |
<0.0001 |
| Control |
0.4±0.2 |
0.4±0.3 |
0.51 |
| HDL-C (mg/dl) |
| EPA |
50.5±13.9 |
49.4±14.7 |
0.56 |
| Control |
54.3±16.2 |
55.5±18.1 |
0.50 |
| LDL-C (mg/dl) |
| EPA |
97.7±20.6 |
91.4±20.6 |
0.22 |
| Control |
100.0±31.1 |
88.3±19.2 |
0.10 |
| Triglycerides (mg/dl) |
| EPA |
157.3±73.2 |
138.1±94.2 |
0.10 |
| Control |
128.6±58.9 |
119.5±62.3 |
0.53 |
| FBS (mg/dl) |
| EPA |
122.7±37.7 |
126.3±50.1 |
0.21 |
| Control |
121.0±30.7 |
118.1±34.5 |
0.71 |
| HbA1c (%) |
| EPA |
6.1±1.3 |
6.0±1.1 |
0.60 |
| Control |
6.0±0.7 |
6.0±0.9 |
0.86 |
| Systolic BP (mmHg) |
| EPA |
121.2±9.1 |
122.5±9.4 |
0.12 |
| Control |
117.5±11.9 |
118.1±9.4 |
0.71 |
| Diastolic BP (mmHg) |
| EPA |
66.8±7.3 |
66.9±8.2 |
0.80 |
| Control |
66.6±10.6 |
67.0±8.5 |
0.87 |
Data given as mean±SD. *P<0.001, vs. control group; **P=0.002, vs. control group. There were no significant differences in the other parameters between groups at baseline or follow-up. Abbreviations as in Table 1.
There were no significant differences between the 2 groups in vessel volume, lumen volume and plaque volume at baseline. These parameters did not change significantly between baseline and follow-up (Table 3A). Changes on the IVUS images of coronary plaque in representative cases in the EPA group and control group are shown in
Figures 2
and
3, respectively. There were also no significant differences between the 2 groups in the volume of the 4 IB components at baseline. However, significant increases in fibrous volume and reductions in lipid volume were observed after treatment with EPA, despite no significant changes in the parameters in the control group. There were no significant changes in dense fibrous volume or calcified volume in both groups. After 6 months, there were significant differences in fibrous volume and lipid volume, but no significant differences in dense fibrous volume and calcified volume between the 2 groups (Table 3A). There were significant differences in both the nominal and percent change in fibrous and lipid volumes between the 2 groups (Table 3B). The intraobserver correlation coefficient of lipid volume was r=0.94 (P<0.01). The interobserver correlations of lipid volume by the 2 physicians who conducted IVUS measurement independently was r=0.90 (P<0.01).
Table 3.
(A) Changes in IVUS Parameters of Dyslipidemic Patients With Stable Angina Pectoris, (B) Nominal and Percent Changes in IVUS Parameters of Dyslipidemic Patients With Stable Angina Pectoris
| A |
Baseline |
Follow-up |
P value |
| Vessel volume (mm3) |
| EPA |
138.8±21.5 |
128.9±19.2 |
0.28 |
| Control |
133.2±15.3 |
137.9±11.2 |
0.34 |
| Lumen volume (mm3) |
| EPA |
95.1±12.5 |
87.1±7.2 |
0.45 |
| Control |
88.4±6.3 |
93.6±2.1 |
0.27 |
| Plaque volume (mm3) |
| EPA |
43.5±7.8 |
42.9±9.9 |
0.62 |
| Control |
44.8±9.2 |
44.3±12.4 |
0.66 |
| Fibrous volume (mm3) |
| EPA |
22.9±0.8 |
25.6±1.1¶ |
0.01 |
| Control |
24.0±1.0 |
21.8±1.9 |
0.15 |
| Lipid volume (mm3) |
| EPA |
18.5±1.3 |
15.0±1.5§ |
0.007 |
| Control |
17.8±1.3 |
19.3±2.1 |
0.29 |
| Dense fibrosis volume (mm3) |
| EPA |
1.0±0.3 |
1.2±0.5 |
0.52 |
| Control |
1.9±0.3 |
2.4±0.6 |
0.83 |
| Calcified volume (mm3) |
| EPA |
1.1±0.1 |
1.1±0.2 |
0.45 |
| Control |
1.1±0.1 |
0.8±0.3 |
0.51 |
| B |
EPA |
Control |
P value |
| Nominal change |
| Vessel volume (mm3) |
−9.9±3.2 |
4.7±3.3 |
0.10 |
| Lumen volume (mm3) |
−8.1±4.1 |
5.2±4.5 |
0.12 |
| Plaque volume (mm3) |
−0.6±2.8 |
−0.5±3.7 |
0.80 |
| Fibrous volume (mm3) |
2.7±0.1 |
−2.2±0.8 |
0.01 |
| Lipid volume (mm3) |
−3.5±0.2 |
1.5±1.0 |
0.005 |
| Dense fibrosis volume (mm3) |
0.2±0.3 |
0.5±0.3 |
0.21 |
| Calcified volume (mm3) |
−0.1±0.1 |
−0.3±0.2 |
0.33 |
| Percent change |
| Fibrous volume (%) |
11.7±8.3 |
−9.2±5.3 |
0.01 |
| Lipid volume (%) |
−18.9±9.2 |
8.4±4.5 |
0.002 |
| Dense fibrosis volume (%) |
20.0±10.2 |
26.3±13.2 |
0.62 |
| Calcified volume (%) |
−8.9±3.2 |
−27.3±11.7 |
0.08 |
(A) EPA group, strong statin plus eicosapentaenoic acid; control group, strong statin only. (B) Data given as mean±SD. ¶P=0.014 vs. control, §P=0.013 vs. control. There were no significant differences in the other parameters between the 2 groups at baseline or follow-up. EPA group, strong statin plus EPA; control group, strong statin only. EPA, eicosapentaenoic acid; IVUS, intravascular ultrasound.

The CS levels of PTX3 and MCP-1 were lower after than before treatment in the EPA group, but there were no significant changes in cytokine levels between baseline and follow-up in the control group. Peripheral vein cytokine levels showed no significant changes between baseline and follow-up in both groups (Table 4).
Table 4.
Changes in Inflammatory Cytokine Levels in CS and PV of Dyslipidemic Patients With Stable Angina Pectoris
| |
Baseline |
Follow-up |
P value |
| CS |
| PTX3 (ng/ml) |
| EPA |
3.3±2.1 |
2.6±1.2 |
0.015 |
| Control |
2.8±2.6 |
2.5±1.4 |
0.62 |
| MCP-1 (pg/ml) |
| EPA |
120.4±26.2 |
110.2±26.8 |
0.008 |
| Control |
111.5±32.8 |
103.8±30.8 |
0.22 |
| hs-CRP (mg/L) |
| EPA |
0.2±0.4 |
0.1±0.2 |
0.38 |
| Control |
0.1±0.2 |
0.1±0.1 |
0.47 |
| TNF-α (pg/ml) |
| EPA |
2.5±1.9 |
3.1±2.1 |
0.65 |
| Control |
3.6±4.1 |
2.4±3.0 |
0.33 |
| IL-6 (pg/ml) |
| EPA |
1.6±2.3 |
1.7±2.1 |
0.80 |
| Control |
2.9±5.3 |
4.4±9.4 |
0.58 |
| MMP-3 (ng/ml) |
| EPA |
13.1±10.9 |
12.8±9.2 |
0.32 |
| Control |
10.8±6.2 |
11.4±8.1 |
0.45 |
| MMP-9 (ng/ml) |
| EPA |
23.6±12.8 |
28.1±19.8 |
0.51 |
| Control |
42.3±33.3 |
36.5±30.4 |
0.54 |
| PV |
| PTX3 (ng/ml) |
| EPA |
2.8±2.1 |
2.2±1.4 |
0.15 |
| Control |
2.8±2.4 |
2.5±1.4 |
0.59 |
| MCP-1 (pg/ml) |
| EPA |
116.5±20.9 |
114.1±20.1 |
0.21 |
| Control |
109.1±33.3 |
102.7±27.9 |
0.43 |
| hs-CRP (mg/L) |
| EPA |
0.1±0.3 |
0.1±0.1 |
0.40 |
| Control |
0.1±0.2 |
0.1±0.1 |
0.18 |
| TNF-α (pg/ml) |
| EPA |
3.6±1.5 |
2.9±1.9 |
0.35 |
| Control |
2.2±1.7 |
1.7±1.5 |
0.28 |
| IL-6 (pg/ml) |
| EPA |
1.4±1.9 |
1.5±1.8 |
0.85 |
| Control |
9.3±31.7 |
2.4±3.7 |
0.31 |
| MMP-3 (ng/ml) |
| EPA |
13.4±12.1 |
13.0±8.2 |
0.14 |
| Control |
11.2±7.0 |
10.9±7.3 |
0.72 |
| MMP-9 (ng/ml) |
| EPA |
24.3±13.3 |
26.5±18.2 |
0.29 |
| Control |
38.5±28.5 |
36.2±27.3 |
0.73 |
Data given as mean±SD. There were no significant differences in the inflammatory cytokine levels between the 2 groups at baseline or follow-up. EPA group, strong statin plus EPA; control group, strong statin only. CS, coronary sinus; EPA, eicosapentaenoic acid; hs-CRP, high-sensitivity C-reactive protein; IL-6, interleukin-6; MCP-1, monocyte chemoattractant protein-1; MMP-3, matrix metalloproteinase-3; PTX3, pentraxin 3; TNF-α, tumor necrosis factor α; MMP-9, matrix metalloproteinase-9; PV, peripheral vein.
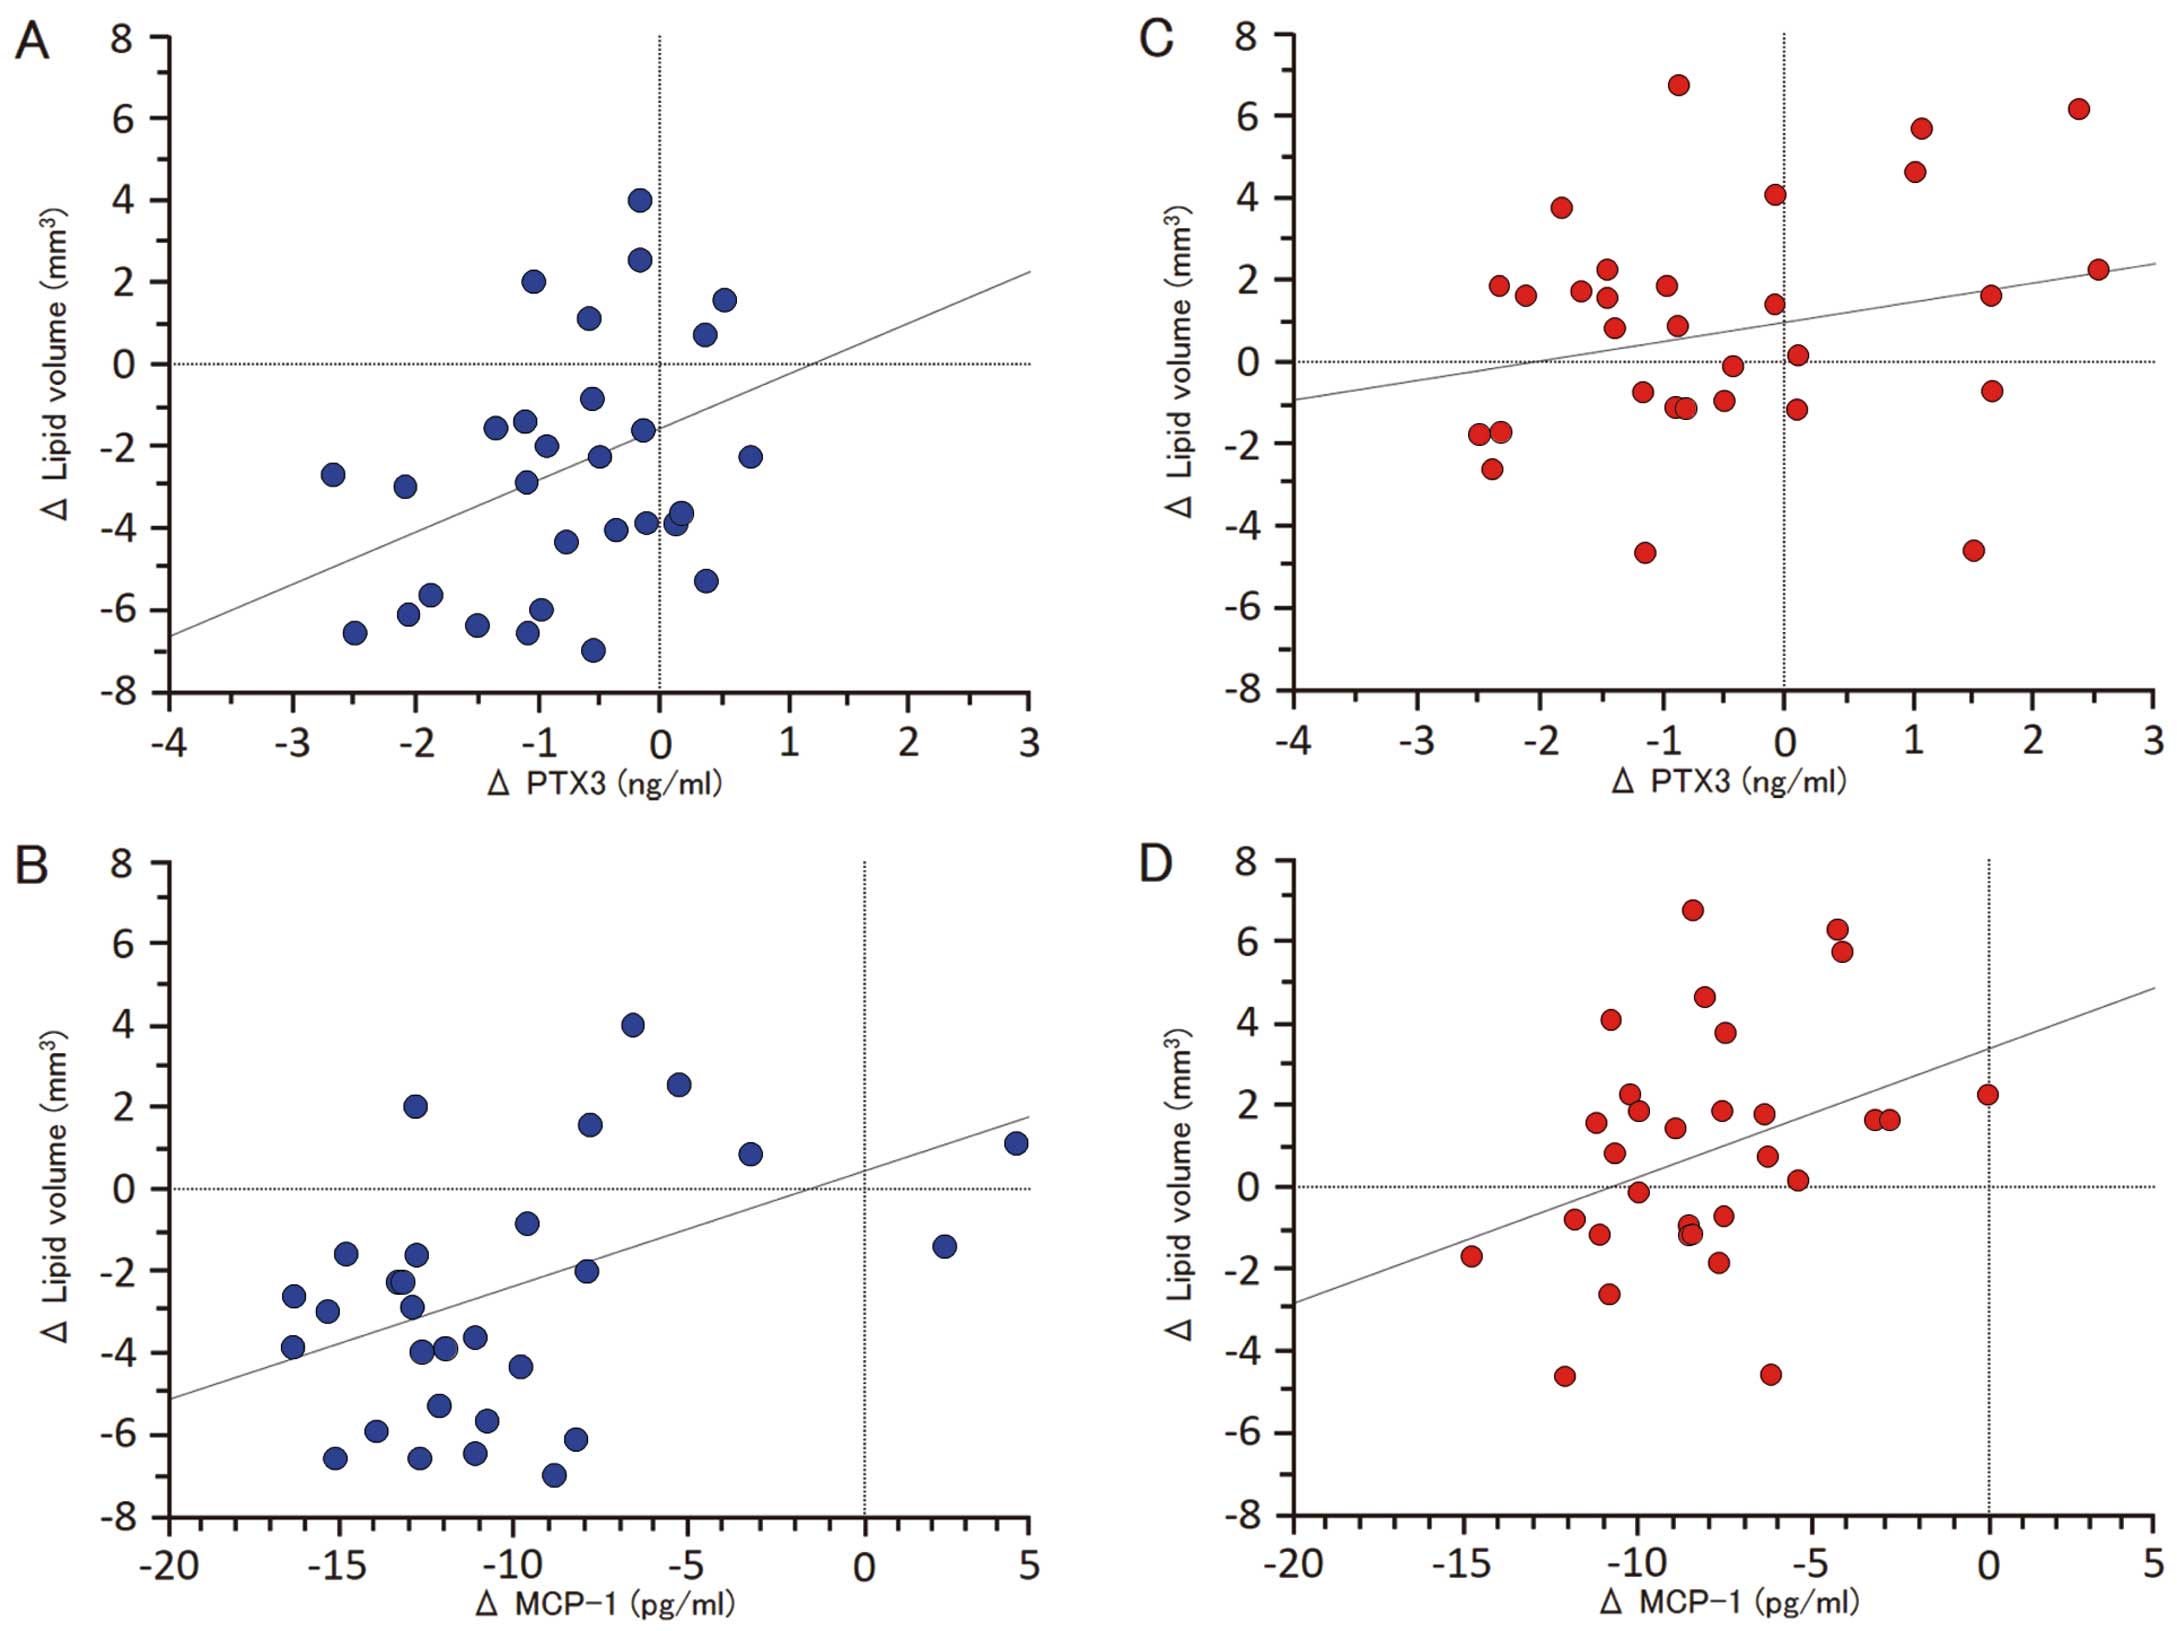
Figure 4
shows the correlations between the change in lipid volume and the change in cytokines. The nominal change in lipid volume was significantly correlated with PTX3 (r=0.366, P=0.04) and MCP-1 (r=0.459, P=0.01) in the EPA group, but not in the control group.
Discussion
Several cohort studies have shown that low consumption of fish is associated with coronary artery disease mortality.1–7
On the other hand, the clinical benefit of lipid-lowering therapy with statins has been conclusively demonstrated by numerous large-scale randomized clinical trials for primary and secondary prevention.27–31
In the JELIS trial,8
18,645 patients (14,981 in primary prevention and 3,664 in secondary prevention) with hypercholesterolemia were randomized to receive statin alone or statin plus highly purified EPA. At the end of 5 years, those randomized to EPA plus statin showed a 19% lower occurrence of major cardiovascular events. However, no patients treated with strong statins were included in the JELIS trial. To our knowledge, this is the first study to evaluate the change in coronary plaque components and local inflammatory cytokines after adding purified EPA ester to the treatment of dyslipidemic patients who were already being treated with strong statins.
Plaque Vulnerability and EPA
A previous pathologic study of vulnerable plaque after ACS demonstrated that a large lipid core could be used as a histologic marker of plaque vulnerability.32
Lee et al reported that a low plasma level of EPA was an independent predictor of all-cause mortality following AMI.33
Kashiyama et al reported a relationship between coronary plaque vulnerability and the serum EPA/AA ratio using coronary angioscopy, and concluded that a low serum EPA level and a low EPA/AA ratio were associated with high plaque vulnerability.34
Ueeda et al also demonstrated a significant correlation between serum EPA level and the extent of soft plaque evaluated by multidetector-row computed tomography in AMI patients.35
A recent study reported that the concomitant use of EPA and rosuvastatin stabilized coronary thin-cap fibroatheroma better than the statin alone on serial optical coherence tomography (OCT).36
In the present study, we demonstrated that combination treatment of EPA and a strong statin therapy stabilized plaque components assessed by IB-IVUS to a greater degree than did strong statin therapy alone. Our results may coincide with the OCT analyses.
Effect of Addition of EPA to Strong Statin on Plaque Components
Previous studies have revealed the clinical importance of in vivo evaluation of vulnerable plaques by intravascular imaging, such as virtual histology IVUS, IB-IVUS and OCT.37–40
It has also been demonstrated by IB-IVUS that lipid-lowering therapy with statins stabilizes plaques by reducing the fatty component and increasing the fibrous component.40,41
Measurement of the lipidic components by IB-IVUS has proven useful in both diagnosis17,42–44
and assessment of the prognosis of coronary plaques as a risk for coronary events.45,46
In the present study, we demonstrated that the EPA+strong statin group had a larger decrease in the lipidic components and a greater increase in fibrous components assessed by IB-IVUS without lowering serum lipid levels. Thus, we propose that a greater decrease in lipidic components and a larger increase in fibrous components assessed by IB-IVUS indicate that combined EPA and strong statin therapy stabilizes vulnerable coronary plaques better than strong statin therapy alone.
In the control group, the lipid volume serially increased, although there was not a significant difference. In this study, to eliminate the influence of serial changes related to statin, the effects of EPA addition were investigated in patients who responded to statin therapy, showing stable effects. Briefly, the subjects were patients who had taken a strong statin for ≥6 months. In these subjects, the effects of the strong statin had reached a steady state, and there was no significant decrease in the lipid volume during the observation period. Other factors, such as lifestyle, may have contributed to numerical changes.
Cytokines and Vulnerable Plaques
It has already been reported that arterial inflammation plays an important role in promoting plaque vulnerability, and that hs-CRP and PTX3 are useful markers of arterial inflammation.47,48
In the present study, EPA add-on therapy significantly lowered PTX3 and MCP-1 levels in the CS more than strong statin therapy alone did over the short term. PTX3 is produced directly by macrophages and vascular smooth muscle cells in the vicinity of atherosclerotic lesions, whereas hs-CRP is produced in the liver in response to inflammatory cytokines. Therefore, PTX3 levels in the CS reflect the local inflammatory response of the coronary artery more directly than other systemic markers of inflammation, such as hs-CRP. MCP-1 is also produced predominantly by macrophages and endothelial cells and is a potent chemotactic factor for monocytes.49
Our results suggest that EPA added to a strong statin stabilizes plaque components better than strong statin alone therapy through suppression of coronary inflammation. The presence of EPA promotes the secretion of anti-inflammatory prostaglandins and less potent leukotrienes, resulting in a shift to a milieu of less inflammatory mediators. EPA also decreases the agonist-induced activation of nuclear factor (NF)-κB and peroxisome proliferator activated receptor (PPAR)-γ. Activation of the transcription factor NF-κB is associated with atherosclerotic progression by upregulation of cytokine gene expression.50
Activated NF-κB and its target genes are found in the atherosclerotic vessel wall. Another transcription factor, PPAR-γ, also plays a role in acute inflammation control.51
Therefore, it is possible that this is one pathway by which EPA exerts its antiinflammatory effects.
It was also reported that high EPA content in plaques is associated with reduced numbers of foam cells and T cells, less inflammation and increased stability.52
These findings show that EPA could have beneficial effects on the stability of coronary plaques, suggesting an adjuvant effect of strong statins in terms of their protective effects against coronary inflammation.
Changes in Local Inflammatory Cytokine Levels
In the present study, inflammatory cytokine levels in the CS were lower after than before additional EPA treatment; however, no significant changes were observed in the femoral vein. Blood sampling from the femoral vein is likely to be affected when the patient has a collagen, malignant or other infectious disease leading to a systemic inflammatory reaction. Therefore, we consider that blood sampling from the CS reflected micro-changes in the cardiac inflammatory reaction. Local anti-inflammatory effects of additional EPA assessed by blood sampling from the CS were associated with the anti-arteriosclerotic effects assessed by IB imaging.
Clinical Implications
The present study findings suggest that the addition of EPA further stabilizes coronary plaques in patients with stable angina who are treated with strong statins. In addition, EPA has been reported to transform dysfunctional high-density lipoprotein to the functional form.53
Additional EPA therapy may reduce the residual risk of strong statin therapy in patients with stable angina. The results suggest the usefulness of EPA for secondary prevention in these patients.
Study Limitations
First, it was performed at a single center and the study population was relatively small. Second, acoustic shadowing by a guide wire or calcification may affect tissue characterization. Therefore, lesions that were masked by acoustic shadowing were not included in this study. Third, thrombus has several IB values according to its formation. A fresh thrombus and the lipid pool have similar IB values and organized thrombus and fibrosis also have similar IB values. It is possible that fresh thrombus at baseline was misclassified as lipid pool (blue) and organized thrombus at follow-up as fibrosis (green). This is a limitation of analyses using IB-IVUS. Fourth, all patients underwent IB-IVUS analyses performed in the vessel undergoing the intervention. Ideally, the analytical lesion should be selected in non-culprit vessels. However, analytical plaques in this study had to be more than 5 mm away from the intervention site; therefore, we think that these plaques were less affected by the PCI procedures. Fifth, the plaque capacity was small at most coronary sites investigated in the present study; it remains to be clarified whether or not EPA addition is effective for advanced atheroma. However, the results suggest that EPA addition inhibits the deterioration of initial atheroma. Furthermore, a study using serial OCT observation reported the efficacy of EPA addition for the stabilization of atheroma.36
This is consistent with our findings. In the future, the effects on advanced atheroma and on plaque stabilization should be further investigated.
Conclusions
In patients with dyslipidemia treated with strong statins, the addition of EPA was associated with a reduction in the lipid content of plaques in the coronary arteries as observed by IB-IVUS, as well as with a decrease in inflammatory cytokines.
Acknowledgments
We thank the nursing and technical staff of the Cardiac Catheterization Laboratory at Tokushima University Hospital for their expert help in conducting this study.
Disclosures
M.S. received lecture fees from Mochida Pharmaceutical Co, Ltd, AstraZeneca K.K., and Shionogi & Co, Ltd. Otherwise, no disclosures in regard to this manuscript.
References
- 1.
Kromhout D, Bosschieter EB, de Lezenne Coulander C. The inverse relation between fish consumption and 20-year mortality from coronary heart disease. N Engl J Med 1985; 312: 1205–1209.
- 2.
Siscovick DS, Raghunathan TE, King I, Weinmann S, Wicklund KG, Albright J, et al. Dietary intake and cell membrane levels of long-chain n-3 polyunsaturated fatty acids and the risk of primary cardiac arrest. JAMA 1995; 274: 1363–1367.
- 3.
Daviglus ML, Stamler J, Orencia AJ, Dyer AR, Liu K, Greenland P, et al. Fish consumption and the 30-year risk of fatal myocardial infarction. N Eng J Med 1997; 336: 1046–1053.
- 4.
Albert CM, Campos H, Stampfer MJ, Ridker PM, Manson JE, Willett WC, et al. Blood levels of long-chain n-3 fatty acids and the risk of sudden death. N Engl J Med 2002; 346: 1113–1118.
- 5.
Hu FB, Bronner L, Willett WC, Stampfer MJ, Rexrode KM, Albert CM, et al. Fish and omega-3 fatty acid intake and risk of coronary heart disease in women. JAMA 2002; 287: 1815–1821.
- 6.
Lemaitre RN, King IB, Mozaffarian D, Kuller LH, Tracy RP, Siscovick DS. n-3 Polyunsaturated fatty acids, fatal ischemic heart disease, and nonfatal myocardial infarction in older adults: The Cardiovascular Health Study. Am J Clin Nutr 2003; 77: 319–325.
- 7.
Bang HO, Dyerberg J, Sinclair HM. The composition of the Eskimo food in north western Greenland. Am J Clin Nutr 1980; 33: 2657–2661.
- 8.
Yokoyama M, Origasa H, Matsuzaki M, Matsuzawa Y, Saito Y, Ishikawa Y, et al. Effects of eicosapentaenoic acid on major coronary events in hypercholesterolaemic patients (JELIS): A randomised open-label, blinded endpoint analysis. Lancet 2007; 369: 1090–1098.
- 9.
Tanaka K, Ishikawa Y, Yokoyama M, Origasa H, Matsuzaki M, Saito Y, et al. Reduction in the recurrence of stroke by eicosapentaenoic acid for hypercholesterolemic patients: Subanalysis of the JELIS trial. Stroke 2008; 39: 2052–2058.
- 10.
Saito Y, Yokoyama M, Origasa H, Matsuzaki M, Matsuzawa Y, Ishikawa Y, et al. Effects of EPA on coronary artery disease in hypercholesterolemic patients with multiple risk factors: Sub-analysis of primary prevention cases from the Japan EPA Lipid Intervention Study (JELIS). Atherosclerosis 2008; 200: 135–140.
- 11.
Sacks FM, Katan M. Randomized clinical trials on the effects of dietary fat and carbohydrate on plasma lipoproteins and cardiovascular disease. Am J Med 2002; 113(Suppl): 13S–24S.
- 12.
Leaf A, Kang JX, Xiao YF, Billman GE. Clinical prevention of sudden cardiac death by n-3 polyunsaturated fatty acids and mechanism of prevention of arrhythmias by n-3 fish oils. Circulation 2003; 107: 2646–2652.
- 13.
Hornstra G. Influence of dietary fat type on arterial thrombosis tendency. J Nutr Health Aging 2001; 5: 160–166.
- 14.
Goodfellow J, Bellamy MF, Ramsey MW, Jones CJ, Lewis MJ. Dietary supplementation with marine omega-3 fatty acids improves systemic large artery endothelial function in subjects with hypercholesterolemia. J Am Coll Cardiol 2000; 35: 265–270.
- 15.
Yoshihara T, Shimada K, Fukao K, Sai E, Sato-Okabayashi Y, Matsumori R, et al. Omega 3 polyunsaturated fatty acids suppress the development of aortic aneurysms through the inhibition of macrophage-mediated inflammation. Circ J 2015; 79: 1470–1478.
- 16.
Geleijnse JM, Giltay EJ, Grobbee DE, Donders AR, Kok FJ. Blood pressure response to fish oil supplementation: Metaregression analysis of randomized trials. J Hypertens 2002; 20: 1493–1499.
- 17.
Kawasaki M, Takatsu H, Noda T, Sano K, Ito Y, Hayakawa K, et al. In vivo quantitative tissue characterization of human coronary arterial plaques by use of integrated backscatter intravascular ultrasound and comparison with angioscopic findings. Circulation 2002; 105: 2487–2492.
- 18.
Ohota M, Kawasaki M, Ismail TF, Hattori K, Serruys PW, Ozaki Y. A histological and clinical comparison of new and conventional integrated backscatter intravascular ultrasound (IB-IVUS). Circ J 2012; 76: 1678–1686.
- 19.
Otagiri K, Tsutsui H, Kumazaki S, Miyashita Y, Aizawa K, Koshikawa M, et al. Early intervention with rosuvastatin decreases the lipid components of the plaque in acute coronary syndrome: Analysis using integrated backscatter IVUS (ELAN study). Circ J 2011; 75: 633–641.
- 20.
Ando H, Amano T, Matsubara T, Uetani T, Nanki M, Marui N, et al. Comparison of tissue characteristics between acute coronary syndrome and stable angina pectoris: An integrated backscatter intravascular ultrasound analysis of culprit and non-culprit lesions. Circ J 2011; 75: 383–390.
- 21.
Nakayama N, Hibi K, Endo M, Miyazawa A, Suzuki H, Maejima N, et al. Validity and reliability of new intravascular ultrasound analysis software for morphological measurement of coronary artery disease. Circ J 2013; 77: 424–431.
- 22.
Muraoka Y, Sonoda S, Kashiyama K, Kamezaki F, Tsuda Y, Araki M, et al. Coronary arterial remodeling and out-stent plaque change after drug-eluting stent implantation: Comparison between zotarolimus-eluting stents and paclitaxel-eluting stents. Circ J 2013; 77: 363–371.
- 23.
Ozaki Y, Ohata M, Ismail TF, Okumura M, Ishikawaw M, Muramatsu T. Thin cap fibroatheroma defined as lipid core abutting lumen (LCAL) on integrated backscatter intravascular ultrasound. Circ J 2015; 79: 808–817.
- 24.
McFadden EP, Stabile E, Regar E, Cheneau E, Ong AT, Kinnaird T, et al. Late thrombosis in drug-eluting coronary stents after discontinuation of antiplatelet therapy. Lancet 2004; 364: 1519–1521.
- 25.
Joner M, Finn AV, Farb A, Mont EK, Kolodgie FD, Ladich E, et al. Pathology of drug-eluting stents in humans: Delayed healing and late thrombotic risk. J Am Coll Cardiol 2006; 48: 193–202.
- 26.
Suresh K. An overview of randomization techniques: An unbiased assessment of outcome in clinical research. J Hum Reprod Sci 2011; 4: 8–11.
- 27.
Randomised trial of cholesterol lowering in 4444 patients with coronary heart disease: The Scandinavian Simvastatin Survival Study (4S). Lancet 1994; 344: 1383–1389.
- 28.
Sacks FM, Pfeffer MA, Moye LA, Rouleau JL, Rutherford JD, Cole TG, et al. The effect of pravastatin on coronary events after myocardial infarction in patients with average cholesterol levels: Cholesterol and Recurrent Events Trial investigators. N Engl J Med 1996; 335: 1001–1009.
- 29.
Streja L, Packard CJ, Shepherd J, Cobbe S, Ford I. Factors affecting low-density lipoprotein and high-density lipoprotein cholesterol response to pravastatin in the West Of Scotland Coronary Prevention Study (WOSCOPS). Am J Cardiol 2002; 90: 731–736.
- 30.
Ridker PM, Danielson E, Fonseca FA, Genest J, Gotto AM Jr, Kastelein JJ, et al. Rosuvastatin to prevent vascular events in men and women with elevated C-reactive protein. N Engl J Med 2008; 359: 2195–2207.
- 31.
Tung P, Wiviott SD, Cannon CP, Murphy SA, McCabe CH, Gibson CM. Seasonal variation in lipids in patients following acute coronary syndrome on fixed doses of pravastatin (40 mg) or atorvastatin (80 mg) (from the Pravastatin or Atorvastatin Evaluation and Infection Therapy-Thrombolysis In Myocardial Infarction 22 [PROVE IT-TIMI 22] Study). Am J Cardiol 2009; 103: 1056–1060.
- 32.
Davies MJ, Richardson PD, Woolf N, Katz DR, Mann J. Risk of thrombosis in human atherosclerotic plaques: Role of extracellular lipid, macrophage, and smooth muscle cell content. Br Heart J 1993; 69: 377–381.
- 33.
Lee SH, Shin MJ, Kim JS, Ko YG, Kang SM, Choi D, et al. Blood eicosapentaenoic acid and docosahexaenoic acid as predictors of all-cause mortality in patients with acute myocardial infarction: Data from Infarction Prognosis Study (IPS) Registry. Circ J 2009; 73: 2250–2257.
- 34.
Kashiyama T, Ueda Y, Nemoto T, Wada M, Masumura Y, Matsuo K, et al. Relationship between coronary plaque vulnerability and serum n-3/n-6 polyunsaturated fatty acid ratio. Circ J 2011; 75: 2432–2438.
- 35.
Ueeda M, Doumei T, Takaya Y, Shinohata R, Katayama Y, Ohnishi N, et al. Serum n-3 polyunsaturated fatty acid levels correlate with the extent of coronary plaques and calcifications in patients with acute myocardial infarction. Circ J 2008; 72: 1836–1843.
- 36.
Nishio R, Shinke T, Otake H, Nakagawa M, Nagoshi R, Inoue T, et al. Stabilizing effect of combined eicosapentaenoic acid and statin therapy on coronary thin-cap fibroatheroma. Atherosclerosis 2014; 234: 114–119.
- 37.
Stone GW, Maehara A, Lansky AJ, de Bruyne B, Cristea E, Mintz GS, et al. A prospective natural-history study of coronary atherosclerosis. N Engl J Med 2011; 364: 226–235.
- 38.
Nasu K, Tsuchikane E, Katoh O, Tanaka N, Kimura M, Ehara M, et al. Effect of fluvastatin on progression of coronary atherosclerotic plaque evaluated by virtual histology intravascular ultrasound. JACC Cardiovasc Interv 2009; 2: 689–696.
- 39.
Takarada S, Imanishi T, Kubo T, Tanimoto T, Kitabata H, Nakamura N, et al. Effect of statin therapy on coronary fibrous-cap thickness in patients with acute coronary syndrome: Assessment by optical coherence tomography study. Atherosclerosis 2009; 202: 491–497.
- 40.
Hattori K, Ozaki Y, Ismail TF, Okumura M, Naruse H, Kan S, et al. Impact of statin therapy on plaque characteristics as assessed by serial OCT, grayscale and integrated backscatter-IVUS. JACC Cardiovasc Imaging 2012; 5: 169–177.
- 41.
Kawasaki M, Sano K, Okubo M, Yokoyama H, Ito Y, Murata I, et al. Volumetric quantitative analysis of tissue characteristics of coronary plaques after statin therapy using three-dimensional integrated backscatter intravascular ultrasound. J Am Coll Cardiol 2005; 45: 1946–1953.
- 42.
Okubo M, Kawasaki M, Ishihara Y, Takeyama U, Yasuda S, Kubota T, et al. Tissue characterization of coronary plaques: Comparison of integrated backscatter intravascular ultrasound with virtual histology intravascular ultrasound. Circ J 2008; 72: 1631–1639.
- 43.
Okubo M, Kawasaki M, Ishihara Y, Takeyama U, Kubota T, Yamaki T, et al. Development of integrated backscatter intravascular ultrasound for tissue characterization of coronary plaques. Ultrasound Med Biol 2008; 34: 655–663.
- 44.
Amano T, Matsubara T, Uetani T, Nanki M, Marui N, Kato M, et al. Impact of metabolic syndrome on tissue characteristics of angiographically mild to moderate coronary lesions: Integrated backscatter intravascular ultrasound study. J Am Coll Cardiol 2007; 49: 1149–1156.
- 45.
Sano K, Kawasaki M, Ishihara Y, Okubo M, Tsuchiya K, Nishigaki K, et al. Assessment of vulnerable plaques causing acute coronary syndrome using integrated backscatter intravascular ultrasound. J Am Coll Cardiol 2006; 47: 734–741.
- 46.
Amano T, Matsubara T, Uetani T, Kato M, Kato B, Yoshida T, et al. Lipid-rich plaques predict non-target-lesion ischemic events in patients undergoing percutaneous coronary intervention. Circ J 2010; 75: 157–166.
- 47.
Burke AP, Tracy RP, Kolodgie F, Malcom GT, Zieske A, Kutys R, et al. Elevated C-reactive protein values and atherosclerosis in sudden coronary death: Association with different pathologies. Circulation 2002; 105: 2019–2023.
- 48.
Koga S, Ikeda S, Yoshida T, Nakata T, Takeno M, Masuda N, et al. Elevated levels of systemic pentraxin 3 are associated with thin-cap fibroatheroma in coronary culprit lesions: Assessment by optical coherence tomography and intravascular ultrasound. JACC Cardiovasc Interv 2013; 6: 945–954.
- 49.
Rollins BJ. Chemokines. Blood 1997; 90: 909–928.
- 50.
Brand K, Page S, Rogler G, Bartsch A, Brandl R, Knuechel R, et al. Activated transcription factor nuclear factor-kappa B is present in the atherosclerotic lesion. J Clin Invest 1996; 97: 1715–1722.
- 51.
Ricote M, Valledor AF, Glass CK. Decoding transcriptional programs regulated by PPARs and LXRs in the macrophage: Effects on lipid homeostasis, inflammation, and atherosclerosis. Arterioscler Thromb Vasc Biol 2004; 24: 230–239.
- 52.
Cawood AL, Ding R, Napper FL, Young RH, Williams JA, Ward MJ, et al. Eicosapentaenoic acid (EPA) from highly concentrated n-3 fatty acid ethyl esters is incorporated into advanced atherosclerotic plaques and higher plaque EPA is associated with decreased plaque inflammation and increased stability. Atherosclerosis 2010; 212: 252–259.
- 53.
Tanaka N, Ishida T, Nagao M, Mori T, Monguchi T, Sasaki M, et al. Administration of high dose eicosapentaenoic acid enhances anti-inflammatory properties of high-density lipoprotein in Japanese patients with dyslipidemia. Atherosclerosis 2014; 237: 577–583.