Abstract
Background:
It has been shown that serum lipoprotein(a) [Lp(a)] is elevated in familial hypercholesterolemia (FH) with mutation(s) of the LDL receptor (LDLR) gene. However, few data exist regarding Lp(a) levels in FH with gain-of-function mutations of the PCSK9 gene.
Methods and Results:
We evaluated 42 mutation-determined heterozygous FH patients with a
PCSK9
gain-of-function mutation (FH-PCSK9, mean age 52, mean LDL-C 235 mg/dl), 198 mutation-determined heterozygous FH patients with a
LDLR
mutation (FH-LDLR, mean age 44, mean LDL-C 217 mg/dl), and 4,015 controls (CONTROL, mean age 56, mean LDL-C 109 mg/dl). We assessed their Lp(a), total cholesterol, triglycerides, HDL-C, LDL-C, use of statins, presence of hypertension, diabetes, chronic kidney disease, smoking, body mass index (BMI) and coronary artery disease (CAD). Multiple regression analysis showed that HDL-C, use of statins, presence of hypertension, smoking, BMI, and Lp(a) were independently associated with the presence of CAD. Under these conditions, the serum levels of Lp(a) in patients with FH were significantly higher than those of the CONTROL group regardless of their causative genes, among the groups propensity score-matched (median Lp(a) 12.6 mg/dl [IQR:9.4–33.9], 21.1 mg/dl [IQR:11.7–34.9], and 5.0 mg/dl [IQR:2.7–8.1] in the FH-LDLR, FH-PCSK9, and CONTROL groups, respectively, P=0.002 for FH-LDLR vs. CONTROL, P=0.002 for FH-PCSK9 vs. CONTROL).
Conclusions:
These data demonstrate that serum Lp(a) is elevated in patients with FH caused by PCSK9 gain-of-function mutations to the same level as that in FH caused by LDLR mutations. (Circ J 2016; 80: 512–518)
Lipoprotein(a) [Lp(a)] is a low-density lipoprotein (LDL)-like particle synthesized by the liver, consisting of an apolipoprotein B100 (ApoB) molecule linked to a very large glycoprotein known as apolipoprotein(a) [apo(a)].1–3
In addition to the robust association between serum Lp(a) level and coronary artery disease (CAD),4–6
recent Mendelian randomization trials suggest a causal relationship with CAD.7,8
Moreover, Lp(a) seems to be one of the residual risk factors for cardiovascular disease in this statin era,9
although we currently have few options, such as niacin, to reduce its level.10
Editorial p 329
Despite rigorous investigation of the metabolic basis of Lp(a), it is still unclear whether Lp(a) is mainly catabolized via the LDL receptor (LDLR).11
The serum Lp(a) level in familial hypercholesterolemia (FH) with
LDLR
mutation(s) has been shown to be elevated, suggesting that Lp(a) is catabolized by the LDLR pathway,12
although the effect of statins, whose main mechanism have been shown to be upregulation of the LDLR, is inconsistent.13
In contrast to statins, proprotein convertase subtilisin/kexin type 9 (PCSK9) inhibitors have been shown to reduce Lp(a) by as much as 30%, although the mechanism by which this takes place remains unclear.14,15
However, few data exist regarding serum Lp(a) levels in patients with FH caused by
PCSK9
mutations, which could reveal the role of PCSK9 in human Lp(a) metabolism. Accordingly, the primary aim of this study was to investigate serum Lp(a) level in patients with FH caused by
PCSK9
gain-of-function mutations, comparing it with that in FH caused by
LDLR
mutation to see if Lp(a) is catabolized via the LDLR. The secondary aims of this study were to investigate the distribution of Lp(a), the associations between Lp(a) and several clinical statuses, including CAD, chronic kidney disease (CKD), and diabetes (DM), and the contribution of Lp(a) to CAD in Japanese subjects.
Methods
Study Population
We retrospectively investigated 6,130 subjects whose serum Lp(a) had been measured for any reason (eg, any operations that need prolonged bed rest, risk factors for atherosclerosis such as hypertension (HT) or DM) at Kanazawa University Hospital from April 2004 to March 2014. We excluded 1,868 subjects who did not have lipid profiles. We also excluded 7 homozygous FH subjects to avoid possible significant bias. Thus, 4,255 subjects (2,270 males [53.6%], mean age 56 years, CAD 818 [19.3%], CKD 653 [15.4%]) remained in the current analysis. We used the diagnostic criteria of FH as defined by the Japan Atherosclerosis Society.16
We reviewed the baseline examination, which included a medical history review, physical examination, and a blood draw. Most of the study subjects were inpatients referred to the hospital, making it possible to assess fasting blood samples. The characteristics of the study subjects are listed in
Table 1. The reasons for measuring the Lp(a) levels of the control subjects are listed in Table S1.
Table 1.
Baseline Characteristics of Control Subjects and the Patients With FH
| Variable |
Unmatched groups |
Propensity score-matched groups |
All
(n=4,235) |
CONTROL
(n=4,015) |
FH-LDLR
(n=198) |
FH-PCSK9
(n=42) |
P value |
CONTROL
(n=40) |
FH-LDLR
(n=40) |
FH-PCSK9
(n=40) |
| Age (years) |
58 [46–69] |
58 [47–69] |
44 [28–61] |
52 [47–61]** |
<0.001 |
60 [49–67] |
42 [28–59] |
52 [45–61] |
| Male (n, %) |
2,270 (53.6) |
2,167 (54.0) |
94 (47.5) |
19 (45.2)* |
<0.05 |
18 (45.0) |
18 (45.0) |
18 (45.0) |
| BMI (kg/m2) |
23.7±4.5 |
23.6±4.5 |
24.3±4.1 |
24.2±5.2 |
NS |
|
|
|
| TC (mg/dl) |
194±56 |
188±48 |
293±88** |
316±70** |
<0.001 |
|
|
|
| TG (mg/dl) |
135±167 |
136±170 |
114±82 |
158±76 |
NS |
|
|
|
| HDL-C (mg/dl) |
51±17 |
51±18 |
53±15 |
50±11 |
NS |
|
|
|
| LDL-C (mg/dl) |
115±49 |
109±39 |
217±83** |
235±67** |
<0.001 |
|
|
|
| HT (n, %) |
2,269 (53.6) |
2,198 (54.7) |
64 (32.3)** |
7 (16.7)**,† |
<0.001 |
|
|
|
| DM (n, %) |
1,464 (34.6) |
1,412 (35.2) |
38 (19.2)** |
14 (33.3)† |
<0.001 |
14 (35.0) |
14 (35.0) |
14 (35.0) |
| Smoking (n, %) |
1,830 (43.2) |
1,759 (43.8) |
61 (30.8)** |
10 (23.8)* |
<0.001 |
|
|
|
| Lipid-lowering therapy |
1,215 (28.7) |
1,121 (27.9) |
78 (40.6)** |
16 (38.1)* |
<0.001 |
|
|
|
| CAD (n, %) |
818 (19.3) |
757 (18.9) |
53 (26.8) |
8 (19.0) |
NS |
|
|
|
CKD stage 3 or greater
(n, %) |
653 (15.4) |
641 (16.0) |
11 (5.6)** |
1 (2.4)** |
<0.001 |
1 (2.5) |
1 (2.5) |
1 (2.5) |
*P<0.05 vs. CONTROL, **P<0.001 vs. CONTROL, †P<0.05 vs. FH-LDLR. BMI, body mass index; CAD, coronary artery disease; CKD, chronic kidney disease; DM, diabetes mellitus; FH, familial hypercholesterolemia; HDL-C, high-density lipoprotein cholesterol; HT, hypertension; LDL-C, low-density lipoprotein cholesterol; LDLR, low-density lipoprotein receptor; PCSK9, proprotein convertase subtilisin/kexin type 9; TC, total cholesterol; TG, triglyceride.
Genomic DNA was isolated from peripheral blood white blood cells according to standard procedures and used for PCR in clinically determined FH subjects. We sequenced the coding regions of FH-associated genes (LDLR,
PCSK9, and
LDLR
adaptor protein 1). Genotypes of the subjects with FH in this study were determined as previously described.17
Ethical Considerations
This study was approved by the Ethics Committee of Kanazawa University. All procedures followed were in accordance with the ethical standards of the responsible committees on human experimentation (institutional and national) and with the Helsinki Declaration of 1975, as revised in 2008. Informed consent for genetic analyses was given by subjects with FH for inclusion in the study.
Biochemical Analysis
Blood samples were drawn for assays after overnight fasting. Serum levels of total cholesterol (TC), triglycerides (TG) and HDL cholesterol (HDL-C) were determined enzymatically (Qualigent, Sekisui Medical, Tokyo, Japan) using automated instrumentation based on assays previously described.18
There were some patients with FH whose therapies were discontinued temporarily (~4 weeks) in order to measure Lp(a). An enzyme-linked immunosorbent assay was used to determine Lp(a) concentrations (N-Assay TIA Lp(a) Nittobo, Nitto Boseki Co, Ltd, Tokyo, Japan).19
We used the same assay during this study period. It has been shown that the coefficient of variation for the measurement of Lp(a) was <8% within and between assays.19
Clinical Evaluations
HT was defined as systolic blood pressure of at least 140 mmHg, diastolic blood pressure of at least 90 mmHg, or the use of antihypertensive medication. DM was defined as previously described by the Japan Diabetes Society,20
or the use of diabetes medication. Body mass index (BMI) was defined as body weight in kilograms divided by the square of height measured in meters. Lipid-lowering therapy was defined as taking any lipid-lowering therapy, including statins, ezetimibe, resins, fibrates, and ethyl icosapentate. CKD was defined as ≥ stage 3.21
CAD was defined by the presence of angina pectoris, myocardial infarction, or severe stenotic region(s) in the coronary artery identified by either angiography or computed tomography.
Statistical Analysis
Categorical variables are expressed as percentages. Fisher’s exact test or the chi-square test, whichever was appropriate, was used. Continuous variables with a normal distribution are shown as the mean±SD. For those values lacking a normal distribution, the median and the interquartile range (IQR) are reported. Mean values of continuous variables were compared with Student’s t-test for independent data, and median values were compared with the nonparametric Wilcoxon Mann-Whitney rank sum test. The significance of differences in the characteristics of the 3 groups was analyzed using analysis of variance for continuous variables and the chi-square test for categorical variables with Fisher’s post-hoc test. Multivariate analysis, including factors with a P-value <0.10 in univariate analyses was used to assess the association between factors and CAD. The values that showed a skewed distribution were natural log-transformed. Propensity score-matched groups were also constructed on a 1:1 basis using the R package (Matching) accounting for age, sex, DM, and CKD to minimize the likelihood of selection bias. All statistical analyses were conducted using R statistical software. All P-values <0.05 were considered statistically significant.
Results
Characteristics of Study Subjects
The clinical characteristics of study subjects are shown in
Table 1. According to the diagnostic criteria for FH of the Japan Atherosclerosis Society, we found 250 clinically determined FH subjects among 4,255 subjects. We excluded 10 whose genetic basis was unknown following our analysis. Thus, we evaluated 240 mutation-determined heterozygous FH subjects and 4,015 controls.
Among the 240 genetically determined heterozygous FH subjects, we found 42 with a gain-of-function mutation in the PCSK9 gene (c.94G>A or p.E32K, FH-PCSK9 group), and 198 subjects with 26 different mutations in the LDLR gene (FH-LDLR group). The p.E32K mutation in
PCSK9
has been shown to be one of the most common causes of FH via a gain-of-function mutation of
PCSK9
in Japanese subjects with FH.22
Genetic backgrounds are provided in
Table S2. We defined all other subjects as controls (CONTROL group).
Distribution of Lp(a) and Other Clinical Status
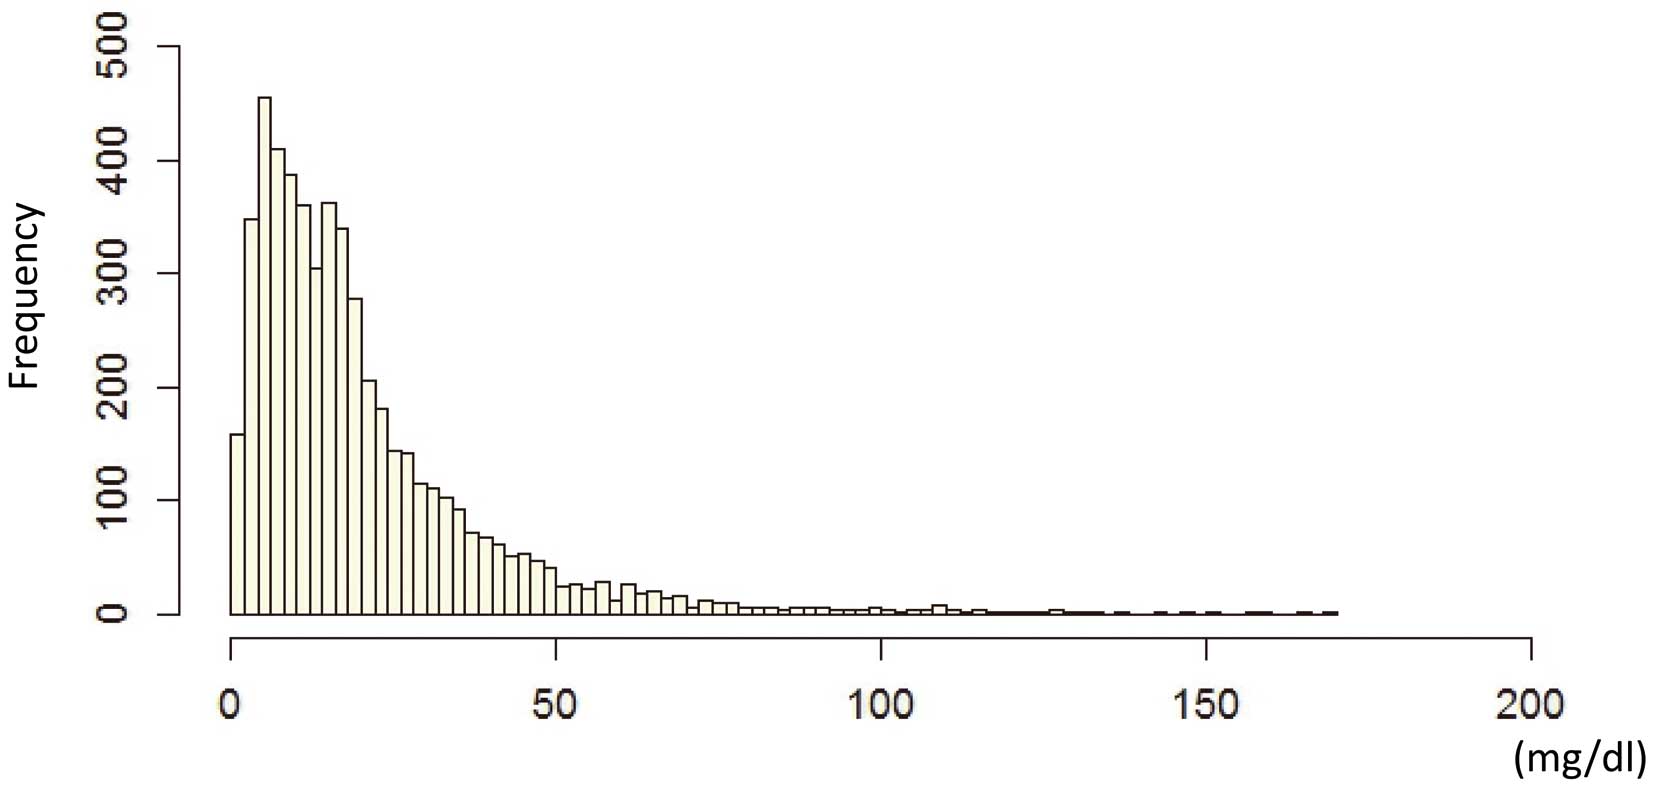
The overall distribution of Lp(a) in the present Japanese subjects is illustrated in
Figure 1. The median Lp(a) level was 12.1 mg/dl [IQR: 6.6–29.7]. The frequency distribution was right-tailed, as in other reports from Asian populations.23
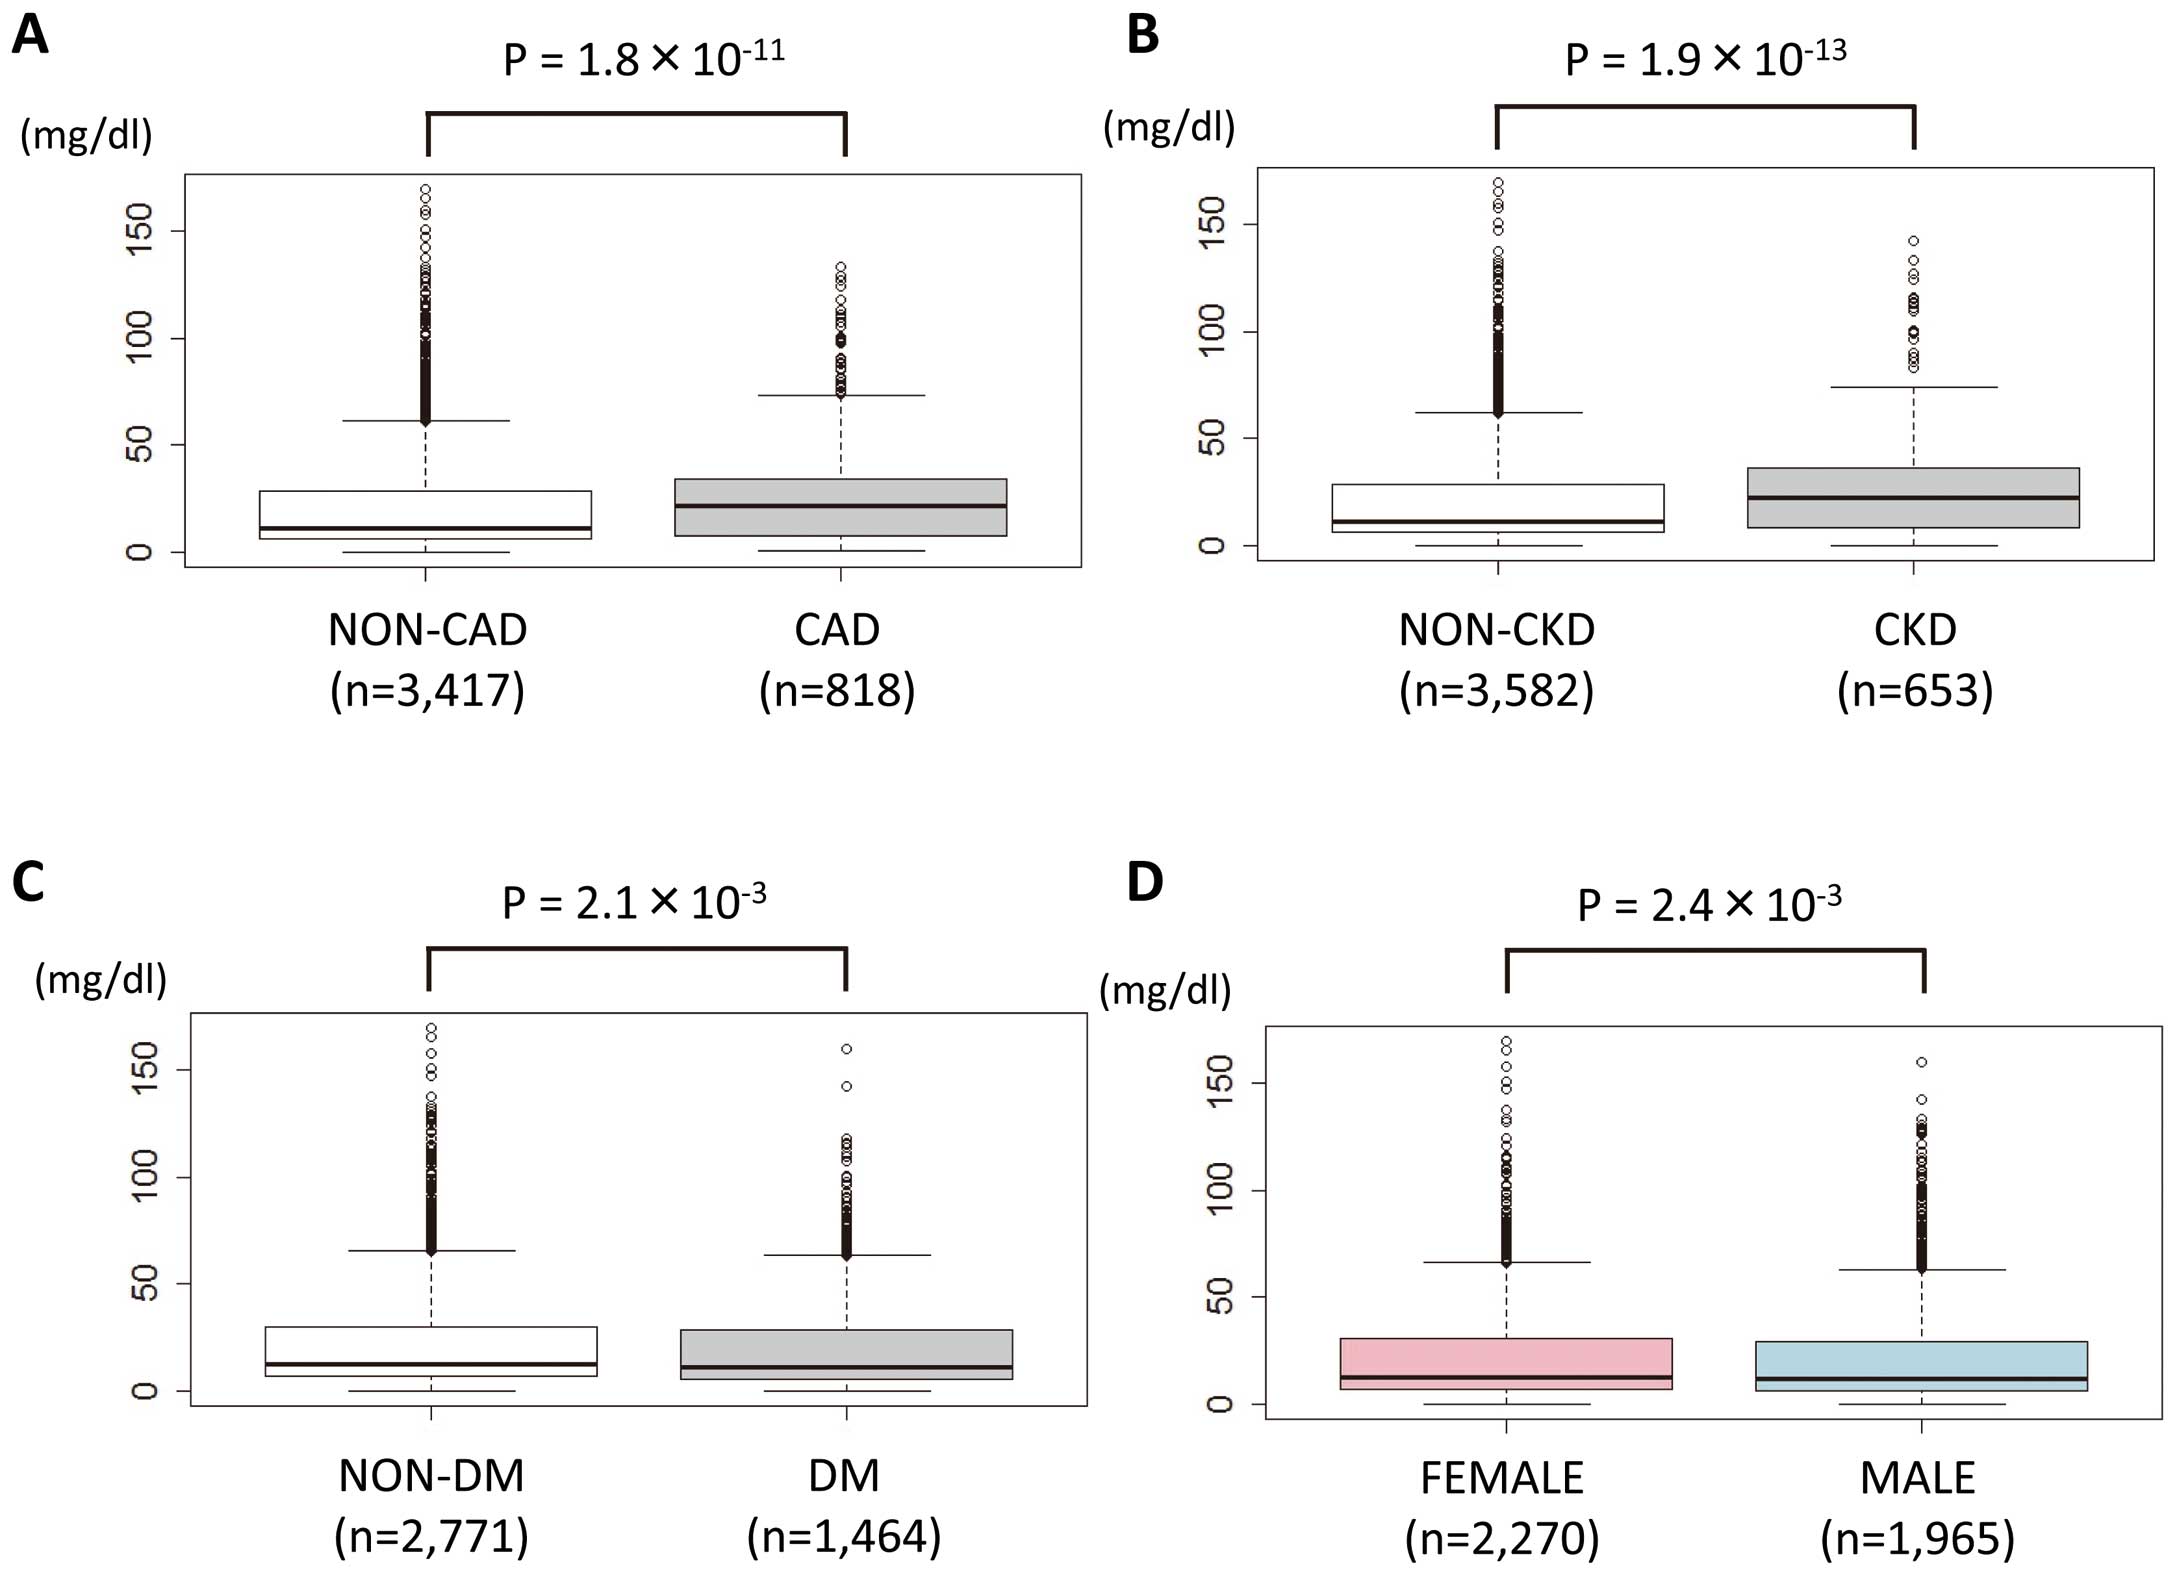
When divided into 2 groups based on clinical status (CAD, CKD, and DM), Lp(a) levels in these patients were significantly higher than those without such status (median Lp(a) 21.3 mg/dl [IQR: 7.8–34.1] vs. 11.5 mg/dl [IQR: 6.3–28.3], P=1.8×10⁻¹¹, 22.2 mg/dl [IQR: 8.3–35.9] vs. 11.5 mg/dl [IQR: 6.3–28.0], P=1.9×10⁻¹³, 11.2 mg/dl [IQR: 5.9–28.9] vs. 12.5 mg/dl [IQR: 6.9–30.3], P=2.1×10⁻³, respectively,
Figures 2A–C). In addition, the Lp(a) level in females was significantly higher than in males (median Lp(a) 12.7 mg/dl [IQR: 6.9–30.6] vs. 11.6 mg/dl [IQR: 5.9–28.9], P=2.4×10⁻³,
Figure 2D). Those associations were unchanged in the subanalyses of patients without CKD (Figure S1).
Correlations Between Lipids and Lp(a)
The natural log-transformed Lp(a) exhibited positive correlations with TC (Pearson’s R=0.119, P=2.2×10⁻¹⁶) and with LDL-C (Pearson’s R=0.167, P<2×10⁻¹⁶) but a negative correlation with natural log-transformed TG (Pearson’s R=−0.036, P=0.01) (Figure S2).
Factors of CAD in Japanese Subjects
To clarify factors associated with CAD, those that may be associated with atherosclerotic diseases were assessed. Multivariate analysis, which included factors with a P-value <0.10 in the univariate analyses, showed that age (odds ratio [OR] 1.027, 95% confidence interval [CI] 1.024–1.030, P=7.6×10⁻¹²), male (OR 1.433, 95% CI 1.115–1.821, P=4.2×10⁻³), HDL cholesterol (OR 0.978, 95% CI 0.970–0.984, P=2.4×10⁻⁹), the use of lipid-lowering therapy (OR6.281, 95% CI 5.115–7.736, P<2.0×10⁻¹⁶), the presence of HT (OR 2.632, 95% CI 2.001–3.631, P=2.9×10⁻¹¹), smoking (OR 2.503, 95% CI 1.977–3.177, P=3.3×10⁻¹³), BMI (OR 0.999, 95% CI 0.998–1.000, P=0.003) and Lp(a) (OR 1.146, 95% CI 1.026–1.268, P=0.015) were independently associated with the presence of CAD overall (Table 2). Indeed, the use of lipid-lowering therapy was positively associated with the presence of CAD; however, this should be interpreted as an inverse-causal relationship in our cross-sectional study design.
Table 2.
Multiple Regression Analysis of Factors Associated With CAD
| Variable |
Univariate analysis |
Multivariate analysis |
| OR |
95% CI |
P value |
OR |
95% CI |
P value |
| Age |
1.033 |
1.024–1.043 |
7.3×10⁻¹³ |
1.027 |
1.024–1.030 |
7.6×10⁻¹² |
| Sex, male |
1.677 |
1.287–2.188 |
1.4×10⁻⁴ |
1.433 |
1.115–1.821 |
4.2×10⁻³ |
| BMI |
0.999 |
0.998–1.000 |
1.6×10⁻³ |
0.999 |
0.998–1.000 |
0.003 |
| HDL-C |
0.978 |
0.971–0.986 |
6.6×10⁻⁸ |
0.978 |
0.970–0.984 |
2.4×10⁻⁹ |
| TG |
1.000 |
0.999–1.001 |
NS |
|
|
|
| LDL-C |
1.001 |
0.998–1.004 |
NS |
|
|
|
| Lipid-lowering therapy |
6.911 |
5.545–8.646 |
<2.0×10⁻¹⁶ |
6.281 |
5.115–7.736 |
<2.0×10⁻¹⁶ |
| DM |
1.271 |
0.965–1.672 |
0.09 |
|
|
|
| HT |
2.735 |
2.075–3.632 |
1.8×10⁻¹² |
2.632 |
2.001–3.631 |
2.9×10⁻¹¹ |
| CKD (≥ stage3) |
1.029 |
0.796–1.327 |
NS |
|
|
|
| Smoking |
2.602 |
2.018–3.366 |
2.3×10⁻¹³ |
2.503 |
1.977–3.177 |
3.3×10⁻¹³ |
| Lp(a) |
1.157 |
1.035–1.294 |
0.01 |
1.146 |
1.026–1.268 |
0.015 |
CI, confidence interval; Lp(a), lipoprotein(a); OR, odds ratio. Other abbreviations as in Table 1.
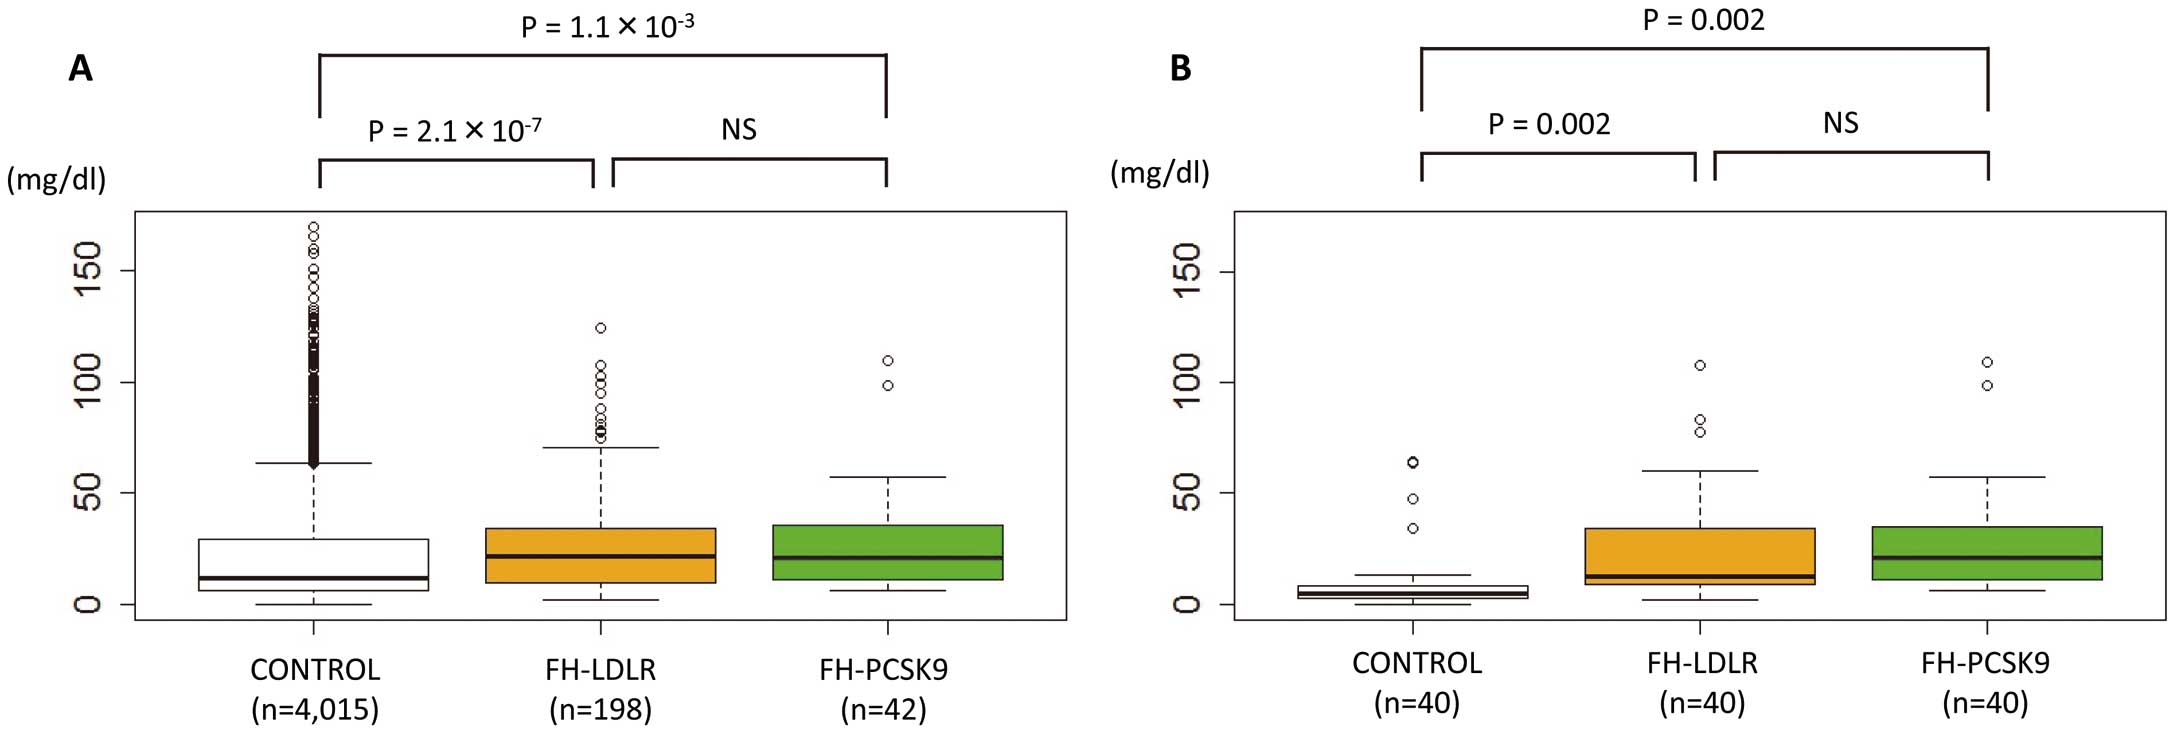
The serum level of Lp(a) in the FH-LDLR group was significantly higher than that of the CONTROL group (median Lp(a) 21.9 mg/dl [IQR: 10.0–34.2] vs. 11.8 mg/dl [IQR: 6.5–29.4], respectively, P=2.1×10⁻⁷,
Figure 3). However, there was no significant difference between the serum level of Lp(a) in the FH-LDLR and FH-PCSK9 groups (median Lp(a) 21.9 mg/dl [IQR: 10.0–34.2] vs. 21.1 mg/dl [IQR: 11.7–34.9], respectively, P=0.48,
Figure 3A). These associations were unchanged in the subanalyses of the propensity score-matched groups (median Lp(a) 5.0 [IQR: 2.7–8.1], 12.6 [IQR: 9.4–33.9], and 21.1 [IQR: 11.7–34.9] in CONTROL, FH-LDLR, and FH-PCSK9, respectively, P=0.002 for FH-LDLR vs. CONTROL, P=0.002 for FH-PCSK9 vs. CONTROL,
Figure 3B), as well as those without CKD (Figure S3).
Discussion
In the current study, we retrospectively investigated the following: (1) the distribution of Lp(a); (2) associations between Lp(a) level and several clinical conditions (viz. CAD, CKD, and DM); (3) contributing factors to CAD; and (4) effect of a gain-of-function mutations of
PCSK9
on serum Lp(a). We found that: (1) the distribution of Lp(a) was highly skewed to the right in the present Japanese subjects, similar to other populations; (2) Lp(a) levels in patients with CAD, CKD, and DM were significantly higher than in those without such conditions; (3) Lp(a) was independently associated with CAD; and (4) the serum level of Lp(a) was elevated in patients with FH caused by
PCSK9
gain-of-function mutations, to the same level as in FH caused by
LDLR
mutations.
Lp(a) Metabolism via LDLR?
Since the discovery of Lp(a) in 1963,24
numerous studies have confirmed a strong correlation between elevated Lp(a) and CAD, leading to consensus that Lp(a) is an important, independent predictor of cardiovascular disease.25,26
Genetic data also support the theory that Lp(a) causes cardiovascular disease.7,8
Moreover, Lp(a) is an “established” residual causal factor in this statin era, together with remnant cholesterol27
and fasting TG,28
in contrast to a number of merely biomarkers associated with CAD.29–31
However, it is still unclear whether Lp(a) is mainly catabolized via the LDLR, because of critical contradictory observations that the serum Lp(a) level in FH with LDLR mutation(s) has been shown to be elevated, while statins, whose main mechanism is upregulation of the LDLR, cannot reduce Lp(a) levels effectively.13
The mechanism of elevation in the serum level of LDL-C in patients with FH caused by
PCSK9
gain-of-function mutations has been shown to be downregulations of the LDLR, which is the same situation as in FH caused by
LDLR
mutations. Accordingly, our data showing no difference between serum Lp(a) in FH caused by
PCSK9
gain-of-function mutations and those caused by
LDLR
mutations, even among the propensity score-matched groups, are consistent with the notion that the LDLR plays an important role in Lp(a) catabolism. To support this hypothesis, it has been demonstrated in a human hepatocellular carcinoma model system that the LDLR mediates the effects of PCSK9 on Lp(a) internalization.32
However, there remains a significant paradox regarding the effect of statins and PCSK9 inhibitors on serum Lp(a) levels, although both drugs target the upregulation of the LDLR, and should lower Lp(a) similarly. One of the possible explanations for this is that the production of ApoB-containing lipoprotein is elevated in patients with FH who also show a disturbance of the clearance of such lipoproteins.33
Lp(a), Diabetes, and FH
In addition, we found that the Lp(a) levels in the patients with DM were significantly higher than those in the patients without DM. This inverse association between low Lp(a) and prevalent DM has been shown in a large, randomized clinical trial.34
Moreover, the prevalence of DM was lower in the present FH-LDLR group compared with the CONTROL group in accordance with a previous observational study,35
whereas the prevalence of DM in the FH-PCSK9 group was the same as that in the CONTROLs. In this study, neither LDL-C nor DM displayed a significant association with CAD. Approximately 40% of the patients with FH in our study were on lipid-lowering therapies at the time of Lp(a) measurement. However, there were some patients with FH whose therapies were discontinued temporarily (~4 weeks) in order to measure Lp(a). Thus, the lipid values, especially LDL-C, in patients with FH in this study may not reflect their potential contribution to CAD. In addition, an association between DM and CAD may be diluted by such lipid-lowering therapies.
Study Limitations
First, this was a retrospective, cross-sectional observational analysis. However, our study investigated one of the largest sample sizes regarding Lp(a) and CAD in a Japanese population, which could contribute to our understanding of this issue across ethnicities. In addition, our findings regarding the factors associated with CAD were consistent with previous studies. Second, we investigated subjects whose serum Lp(a) levels had been measured for any reason, which could lead to some bias. In our hospital, most of the patients who underwent operations, especially those requiring prolonged bed rest, had their Lp(a) levels measured routinely, regardless of the operation. In addition, patients with any risk factors for systemic atherosclerosis were also sampled routinely. Those facts, as well as our large sample size, could dilute any bias. Third, we did not perform genetic analyses for the control subjects, among which there may have been some cases of mutations in either
LDLR
or
PCSK9
without elevated LDL-C. In this regard, it does not make sense to include such mutations in either
LDLR
or
PCSK9
that do not affect LDL-C. Fourth, more frequent usage of statins in FH could increase Lp(a), as described in previous reports.36–39
However, the percentage increase by statin has been reported as up to ~20%. Thus, it is hard to explain the difference between the Lp(a) levels in the FH and control subjects by statin usage. Fifth, it has been shown that the assay we used is affected to some extent by the number of Kringle IV domains.39
However, it has already been shown that Lp(a) levels in FH are equally elevated across patients with different numbers of Kringle IV domains.12
Thus, we believe it acceptable to compare the Lp(a) levels among these 3 groups using this assay, although an assay that is insensitive to the apo(a) isoform size heterogeneity would be much better.
Conclusions
In summary, the data suggested that the serum level of Lp(a) was significantly elevated in patients with FH caused by
PCSK9
gain-of-function mutations. A further study, focusing on the mechanism of reduction of Lp(a) by PCSK9 inhibitors, is needed to fully understand the metabolism of Lp(a).
Acknowledgments
We express our special thanks to Kazuko Honda and Sachio Yamamoto (staff of Kanazawa University) for their outstanding technical assistance, and to Dr Akihiro Nomura for his assistance with the statistical analyses.
Sources of Funding
This work has been supported by a scientific research grant from the Ministry of Education, Science, and Culture of Japan (No. 26893094).
Conflict of Interest
None.
Supplementary Files
Supplementary File 1
Table S1.
Reasons for measuring lipoprotein(a) levels of the control subjects
Table S2.
Genetic background of subjects with familial hypercholesterolemia
Figure S1.
Lipoprotein(a) [Lp(a)] levels according to clinical status (without CKD patients).
Figure S2.
Correlations between lipids and lipoprotein(a) [Lp(a)].
Figure S3.
Lipoprotein(a) [Lp(a)] in familial hypercholesterolemia (FH; without CKD patients).
Please find supplementary file(s);
http://dx.doi.org/10.1253/circj.CJ-15-0999
References
- 1.
Marcovina SM, Koschinsky ML. Lipoprotein(a) as a risk factor for coronary artery disease. Am J Cardiol 1998; 82: 57U–66U.
- 2.
Anuurad E, Boffa MB, Koschinsky ML, Berglund L. Lipoprotein(a): A unique risk factor for cardiovascular disease. Clin Lab Med 2006; 26: 751–772.
- 3.
Hobbs HH, White AL. Lipoprotein(a): Intrigues and insights. Curr Opin Lipidol 1999; 10: 225–236.
- 4.
Jauhiainen M, Koskinen P, Ehnholm C, Frick MH, Mänttäri M, Manninen V, et al. Lipoprotein(a) and coronary heart disease risk: A nested case-control study of the Helsinki Heart Study participants. Atherosclerosis 1991; 89: 59–67.
- 5.
Ridker PM, Hennekens CH, Stampfer MJ. A prospective study of lipoprotein(a) and the risk of myocardial infarction. JAMA 1993; 270: 2195–2199.
- 6.
Emerging Risk Factors Collaboration,
Erqou S, Kaptoge S, Perry PL, Di Angelantonio E, Thompson A, White IR, et al. Lipoprotein(a) concentration and the risk of coronary heart disease, stroke, and nonvascular mortality. JAMA 2009; 302: 412–423.
- 7.
Clarke R, Peden JF, Hopewell JC, Kyriakou T, Goel A, Heath SC, et al. Genetic variants associated with Lp(a) lipoprotein level and coronary disease. N Engl J Med 2009; 361: 2518–2528.
- 8.
Qi Q, Workalemahu T, Zhang C, Hu FB, Qi L. Genetic variants, plasma lipoprotein(a) levels, and risk of cardiovascular morbidity and mortality among two prospective cohorts of type 2 diabetes. Eur Heart J 2012; 33: 325–334.
- 9.
Khera AV, Everett BM, Caulfield MP, Hantash FM, Wohlgemuth J, Ridker PM, et al. Lipoprotein(a) concentrations, rosuvastatin therapy, and residual vascular risk: An analysis from the JUPITER Trial (Justification for the Use of Statins in Prevention: An Intervention Trial Evaluating Rosuvastatin). Circulation 2014; 129: 635–642.
- 10.
Cenarro A, Puzo J, Ferrando J, Mateo-Gallego R, Bea AM, Calmarza P, et al. Effect of Nicotinic acid/Laropiprant in the lipoprotein(a) concentration with regard to baseline lipoprotein(a) concentration and LPA genotype. Metabolism 2014; 63: 365–371.
- 11.
Hoover-Plow J, Huang M. Lipoprotein(a) metabolism: Potential sites for therapeutic targets. Metabolism 2013; 62: 479–491.
- 12.
Kraft HG, Lingenhel A, Raal FJ, Hohenegger M, Utermann G. Lipoprotein(a) in homozygous familial hypercholesterolemia. Arterioscler Thromb Vasc Biol 2000; 20: 522–528.
- 13.
Tziomalos K, Athyros VG, Wierzbicki AS, Mikhailidis DP. Lipoprotein a: Where are we now? Curr Opin Cardiol 2009; 24: 351–357.
- 14.
Koren MJ, Giugliano RP, Raal FJ, Sullivan D, Bolognese M, Langslet G, et al. Efficacy and safety of longer-term administration of evolocumab (AMG 145) in patients with hypercholesterolemia: 52-week results from the Open-Label Study of Long-Term Evaluation Against LDL-C (OSLER) randomized trial. Circulation 2014; 129: 234–243.
- 15.
Blom DJ, Hala T, Bolognese M, Lillestol MJ, Toth PD, Burgess L, et al. A 52-week placebo-controlled trial of evolocumab in hyperlipidemia. N Engl J Med 2014; 370: 1809–1819.
- 16.
Teramoto T, Sasaki J, Ishibashi S, Birou S, Daida H, Dohi S, et al. Familial hypercholesterolemia. J Atheroscler Thromb 2014; 21: 6–10.
- 17.
Tada H, Kawashiri MA, Ikewaki K, Terao Y, Noguchi T, Nakanishi C, et al. Altered metabolism of low-density lipoprotein and very-low-density lipoprotein remnant in autosomal recessive hypercholesterolemia: Results from stable isotope kinetic study in vivo. Circ Cardiovasc Genet 2012; 5: 35–41.
- 18.
Tada H, Kawashiri MA, Takata M, Matsunami K, Imamura A, Matsuyama M, et al. Infantile cases of sitosterolemia with novel mutations in the ABCG5 gene: Extreme hypercholesterolemia is exacerbated by breastfeeding. JIMD Rep 2015; 21: 115–122.
- 19.
Wu JH, Kao JT, Wen MS, Wu D. Coronary artery disease risk predicted by plasma concentrations of high-density lipoprotein cholesterol, apolipoprotein AI, apolipoprotein B, and lipoprotein(a) in a general Chinese population. Clin Chem 1993; 39: 209–212.
- 20.
Committee of the Japan Diabetes Society on the Diagnostic Criteria of Diabetes Mellitus,
Seino Y, Nanjo K, Tajima N, Kadowaki T, Kashiwagi A, Araki E, et al. Report of the committee on the classification and diagnostic criteria of diabetes mellitus. J Diabetes Invest 2010; 1: 212–228.
- 21.
Li PK, Chow KM, Matsuo S, Yang CW, Jha V, Becker G, et al. Asian chronic kidney disease best practice recommendations: Positional statements for early detection of chronic kidney disease from Asian Forum for Chronic Kidney Disease Initiatives (AFCKDI). Nephrology 2011; 16: 633–641.
- 22.
Noguchi T, Katsuda S, Kawashiri MA, Tada H, Nohara A, Inazu A, et al. The E32K variant of PCSK9 exacerbates the phenotype of familial hypercholesterolaemia by increasing PCSK9 function and concentration in the circulation. Atherosclerosis 2010; 210: 166–172.
- 23.
Cobbaert C, Kesteloot H. Serum lipoprotein(a) levels in racially different populations. Am J Epidemiol 1992; 136: 441–449.
- 24.
Berg K. A new serum type system in man: The LP system. Acta Pathol Microbiol Scand 1963; 59: 369–382.
- 25.
Nordestgaard BG, Chapman MJ, Ray K, Borén J, Andreotti F, Watts GF, et al. Lipoprotein(a) as a cardiovascular risk factor: Current status. Eur Heart J 2010; 31: 2844–2853.
- 26.
Kamstrup PR, Benn M, Tybjaerg-Hansen A, Nordestgaard BG. Extreme lipoprotein(a) levels and risk of myocardial infarction in the general population: The Copenhagen City Heart Study. Circulation 2008; 117: 176–184.
- 27.
Nguyen SV, Nakamura T, Kugiyama K. High remnant lipoprotein predicts recurrent cardiovascular events on statin treatment after acute coronary syndrome. Circ J 2014; 78: 2492–2500.
- 28.
Schwartz GG, Abt M, Bao W, DeMicco D, Kallend D, Miller M, et al. Fasting triglycerides predict recurrent ischemic events in patients with acute coronary syndrome treated with statins. J Am Coll Cardiol 2015; 65: 2267–2275.
- 29.
Mori K, Ishida T, Yasuda T, Hasokawa M, Monguchi T, Sasaki M, et al. Serum trans-fatty acid concentration is elevated in young patients with coronary artery disease in Japan. Circ J 2015; 79: 2017–2025.
- 30.
Higuma T, Abe N, Tateyama S, Endo T, Shibutani S, Yokoyama H, et al. Plasma soluble lectin-like oxidized low-density lipoprotein receptor-1 as a novel prognostic biomarker in patients with ST-segment elevation acute myocardial infarction. Circ J 2015; 79: 641–648.
- 31.
Izawa H, Amano T. Plasma microRNA-100 as a biomarker of coronary plaque vulnerability: A new generation of biomarker for developing acute coronary syndrome. Circ J 2015; 79: 303–304.
- 32.
Romagnuolo R, Scipione CA, Boffa MB, Marcovina SM, Seidah NG, Koschinsky ML. Lipoprotein(a) catabolism is regulated by proprotein convertase subtilisin/kexin type 9 through the low density lipoprotein receptor. J Biol Chem 2015; 290: 11649–11662.
- 33.
Millar JS, Maugeais C, Ikewaki K, Kolansky DM, Barrett PH, Budreck EC, et al. Complete deficiency of the low-density lipoprotein receptor is associated with increased apolipoprotein B-100 production. Arterioscler Thromb Vasc Biol 2005; 25: 560–565.
- 34.
Mora S, Kamstrup PR, Rifai N, Nordestgaard BG, Buring JE, Ridker PM. Lipoprotein(a) and risk of type 2 diabetes. Clin Chem 2010; 56: 1252–1260.
- 35.
Besseling J, Kastelein JJ, Defesche JC, Hutten BA, Hovingh GK. Association between familial hypercholesterolemia and prevalence of type 2 diabetes mellitus. JAMA 2015; 313: 1029–1036.
- 36.
Nair DR, Papadakis JA, Jagroop IA, Mikhailidis DP, Winder AF. Statins and fibrinogen. Lancet 1998; 351: 1430.
- 37.
Tsimikas S, Witztum JL, Miller ER, Sasiela WJ, Szarek M, Olsson AG, et al. High-dose atorvastatin reduces total plasma levels of oxidized phospholipids and immune complexes present on apolipoprotein B-100 in patients with acute coronary syndromes in the MIRACL trial. Circulation 2004; 110: 1406–1412.
- 38.
Choi SH, Chae A, Miller E, Messig M, Ntanios F, DeMaria AN, et al. Relationship between biomarkers of oxidized low-density lipoprotein, statin therapy, quantitative coronary angiography, and atheroma: Volume observations from the REVERSAL (Reversal of Atherosclerosis with Aggressive Lipid Lowering) study. J Am Coll Cardiol 2008; 52: 24–32.
- 39.
Marcovina SM, Albers JJ, Scanu AM, Kennedy H, Giaculli F, Berg K, et al. Use of a reference material proposed by the International Federation of Clinical Chemistry and Laboratory Medicine to evaluate analytical methods for the determination of plasma lipoprotein(a). Clin Chem 2000; 46: 1956–1967.