Abstract
Background:
When the maximal diameter of an abdominal aortic aneurysm (AAA) exceeds a threshold, the likelihood of catastrophic rupture increases markedly. Therefore, surveillance at optimal intervals should be offered to patients with AAA. However, other than AAA diameter, there is no useful marker or index for predicting the expansion rate of an AAA or determining the optimal intervals for surveillance. The aim of this study was to evaluate the usefulness of calcium accumulation in the AAA for predicting its expansion rate.
Methods and Results:
We performed a retrospective cohort study in 414 patients with infrarenal AAA who visited The University of Tokyo Hospital. The maximal diameter and extent of calcification of each AAA were evaluated by multidetector-row computed tomography imaging. There was an inverse correlation between the extent of calcification and the subsequent AAA expansion. A lower extent of calcification in the AAA as well as the AAA diameter and absence of coronary artery disease correlated with an accelerated expansion of the AAA.
Conclusions:
In AAA, a lower extent of calcification correlated with accelerated expansion. The calcification index of an AAA can be a useful predictor of its expansion rate. The study findings also support the theory that the mechanisms for progression in atherosclerosis with calcification and external expansion of an aneurysm are distinct. (Circ J 2016; 80: 332–339)
Rupture of an abdominal aortic aneurysm (AAA) is a catastrophic event with a mortality rate of up to 85%.1
When the maximal diameter of an AAA exceeds a threshold, the likelihood of this catastrophic event increases markedly. Therefore, early detection of a small-sized AAA and subsequent careful surveillance for expansion are vitally important for successful therapeutic management of AAA.2
After the diameter of an asymptomatic AAA exceeds the given threshold, at which the risk of rupture increases remarkably, elective repair should be considered.3
An outstanding issue of management is how frequently surveillance should be performed for patients with an AAA less than the threshold diameter. The current evidence concerning the appropriate interval between serial scans of an AAA comes from analysis of correlations among AAA diameter, expansion rate, and rate of rupture.4
Editorial p 314
However, in the clinical setting, the expansion rate of AAAs, even with the same diameter, varies considerably from person to person. A clinical marker or imaging index reflecting the future expansion rate of AAAs could contribute to clinical decision-making regarding the most appropriate interval between serial scans of an AAA, as well as the most timely AAA repair, but such a useful marker or index remains to be elucidated. Because aortic calcification is a common finding in patients with AAA,5
we considered the possibility that AAA calcification could be a potent candidate marker. Given the evidence that the AAA expansion rate is lower in patients with diabetes than in those without diabetes,6
despite the high susceptibility to advanced atherosclerosis as well as calcification in diabetic patients, AAA calcification and AAA expansion could be inversely correlated. Practically, a previous study using ultrasonography demonstrated the AAA growth rate is lower in AAAs with wall calcification >50% than in those with wall calcification <50%.7
Therefore, we further explored the relationship between AAA calcification and expansion in a retrospective cohort study of patients with infrarenal AAA in order to clarify the relationships among computed tomography (CT)-proven calcium accumulation of AAA, AAA diameter, and AAA expansion rate, as well as a potential explanation for the mechanical implications of atherosclerosis with calcification in the process of AAA expansion.
Methods
Study Population
We conducted a retrospective cohort study of 414 consecutive patients with an infrarenal AAA who had undergone at least 2 sequential CT scans in The University of Tokyo Hospital from January 2003 to December 2011. The patients with infrarenal AAA, defined as a maximal short-axis infrarenal aortic diameter ≥30 mm, detected in ≥1 CT scan during this study period, were included. For patients who underwent 2 CT scans, the first was designated as the initial CT and the second as the follow-up CT. For patients who underwent ≥3 CT scans, the first was designated as the initial CT and the last as the follow-up CT. Patients with an interval between the initial and follow-up CT scans (last CT) <90 days were excluded from this study. At the end of the study period (December 2011), 344 patients had undergone AAA repair (elective repair: n=314; emergency repair: n=30), and 70 patients had not. AAAs diagnosed as a direct consequence of specific causes such as trauma, infection, inflammatory disease or a connective tissue disorder (eg, Marfan syndrome) were excluded in advance. All study participants were Japanese. The study was approved by the Ethics Committee of The University of Tokyo Hospital.
All follow-up and medical procedures were performed by the attending physician based on standard therapy according to up-to-date guidelines and recommendations, without any interventions by researchers. All indications for and management of AAA repair were determined according to Japanese Circulation Society Guidelines by the vascular surgery team of The University of Tokyo Hospital. Almost all elective repair cases (290 of 314 cases) underwent coronary angiography, and if necessary, coronary revascularization before surgery. Those who did not undergo coronary angiography were diagnosed as having coronary artery disease (CAD) based on the results of a routine clinical check-up including an ECG. ECG abnormalities were defined as the presence of an abnormal Q wave, ischemic ST change, T-wave inversion, or complete left bundle block.8
Clinical characteristics, including laboratory data at the time of the initial CT, were obtained from the medical records, and used as baseline characteristics of the study population.
Measurement of Maximal Short-Axis Diameter and Calcification of AAA
The maximal short-axis diameter and extent of calcification of the infrarenal AAA were evaluated in all patients using multidetector-row CT (MDCT) scanning. Even if a patient underwent AAA repair during the study period, the CT scans after AAA repair were not analyzed in this study. The maximal short-axis diameter of the AAA was routinely measured and reported in the medical records. To evaluate the expansion rate of AAA, the progression of maximal short-axis diameter of the AAA during the interval between the initial and follow-up CT (mm) was divided by the interval duration (days) and converted into the annual expansion rate (mm/year).
An image of each infrarenal AAA was reconstructed using a volume-rendering method using the MDCT scanning data. Non-contrast MDCT data with contiguous 5-mm thick transverse slices of 414 AAAs in a DICOM server system (Vigoment Software Corporation, Tokyo) were imported into technical picture software (Image J 1.45). In each transverse slice, a region of interest (ROI) was manually plotted along the aortic wall. Next, the calcified area, defined as the area with a density higher than 130 HU (Hounsfield unit)9
in the ROI of each slice, was automatically calculated (Figure 1). The calcified area divided by the total area of the ROI was taken as the %calcification index of that slice. Finally, the average of the %calcification index of all slices of an AAA was defined as the %calcification index of that AAA.
Statistical Analysis
Statistical analysis was performed with SPSS version 18.0 for Windows (SPSS, Chicago, IL, USA). Baseline characteristics were compared by t-test for continuous valuables and chi-square test for categorical valuables. Nonlinear regression analysis was performed to examine the relationship between the %calcification index and expansion rate of the AAA. Receiver-operating characteristic (ROC) curve analysis was performed to identify the best cutoff of the %calcification index for predicting accelerated expansion of an AAA. Because of the hierarchical structure of the AAA diameter dataset, consisting of AAA expansion rate (level 1) clustered within individuals (level 2), a multilevel regression analysis was performed. A calcification index of AAA at the initial CT ≥2.74% served as independent variable, using the interval between the initial CT and the CT in question as the covariates, and the AAA expansion rate served as the dependent variable in a linear mixed model. Multiple logistic regression analysis was performed to examine a predictor of the accelerated expansion of AAAs. In order to evaluate the predictive value for accelerated AAA expansion >5 mm/year, additional ROC curve analysis was performed. Considering the results of the univariable analysis of AAA diameter >45 mm and the %calcification index of AAA <2.74%, weighted scores were allocated to each variable on the basis of each odds ratio. In this additional ROC curve analysis, the summation of these weighted scores was used as the prediction index with the “combination” of these 2 variables. All tests were two-sided with a significance value of P<0.05.
Results
AAA Size
A total of 414 patients with infrarenal AAAs who had undergone at least 2 sequential CT scans at The University of Tokyo Hospital from 2003 to 2011 were included in the present study. The clinical characteristics of the participants are summarized in
Table. Of the patients with an infrarenal AAA detected on at least 1 CT scan among all CT scans obtained during this study period were included, the AAA was <30 mm on initial CT, but >30 mm on follow-up CT in 11 patients. Mean (±SD) AAA size at the time of the initial CT was 47.7±14.6 mm. Mean (±SD) AAA size on follow-up CT was 52.9±12.9 mm, which was significantly larger than on the initial CT (P<0.001). The median follow-up between the initial and follow-up CT scans was 576 days (interquartile range (IQR), 114–1,531). The median expansion rate in the 414 AAAs was 2.8 mm/year (IQR 1.2–5.4) in this study.
Table.
Clinical Characteristics of Study Population of Japanese Patients With Infrarenal AAA
| |
All (n=414) |
Repair group (n=344) |
Non-repair group (n=70) |
P value (Repair group
vs. Non-repair group) |
| Age (years) |
73.1±8.2 |
72.5±8.2 |
76.2±7.7 |
0.01 |
| Male |
332 (80%) |
277 (81%) |
55 (79%) |
0.39 |
| BMI (kg/m2) |
23.4±3.3 |
23.4±3.1 |
23.3±4.3 |
0.87 |
| Hypertension |
303 (73%) |
258 (75%) |
45 (64%) |
0.02 |
| Dyslipidemia |
235 (57%) |
199 (58%) |
36 (51%) |
0.21 |
| Diabetes |
117 (28%) |
91 (26%) |
26 (37%) |
0.10 |
| Current smoking |
129 (31%) |
104 (30%) |
25 (36%) |
0.46 |
| Hemodialysis |
14 (3%) |
8 (2%) |
6 (9%) |
0.10 |
| Family history of AAA |
17 (4%) |
15 (4%) |
2 (3%) |
0.58 |
| Family history of CAD |
29 (7%) |
24 (7%) |
5 (7%) |
0.96 |
| Past or current existence of CAD |
204 (49%) |
161 (47%) |
43 (61%) |
0.03 |
| Pharmacotherapy |
| β, αβ-blocker |
95 (23%) |
74 (22%) |
21 (30%) |
0.16 |
| ACE inhibitor |
44 (11%) |
34 (10%) |
10 (14%) |
0.32 |
| ARB |
125 (30%) |
101 (29%) |
24 (34%) |
0.51 |
| Calcium-channel blocker |
197 (48%) |
164 (48%) |
33 (47%) |
0.94 |
| Statin |
106 (26%) |
88 (26%) |
18 (26%) |
0.98 |
| Laboratory data |
| Creatinine (mg/dl)* |
1.0±0.6 |
0.97±0.4 |
1.2±1.2 |
<0.01 |
| HbA1c (NGSP) (%) |
5.8±0.6 |
5.8±0.6 |
5.9±0.6 |
0.62 |
| CT findings |
| Saccular morphology |
20 (5%) |
16 (5%) |
4 (6%) |
0.71 |
| AAA size at initial CT (mm) |
47.7±14.6† |
49.4±15.0† |
39.7±8.3‡ |
<0.001 |
| Follow-up (days) |
576 (114–1,531)† |
513 (100–1,572)† |
894 (332–1,386)‡ |
0.12 |
| AAA size at follow-up CT (mm) |
52.9±12.9† |
55.0±12.7† |
43.2±8.9‡ |
<0.001 |
Quantitative data are expressed as mean±SD. Follow-up duration is expressed as median (interquartile range). †P<0.001, ‡P=0.017 (between AAA size on initial CT and on follow-up CT). *Serum creatinine levels were calculated after excluding patients receiving hemodialysis. AAA, abdominal aortic aneurysm; ACE, angiotensin-converting enzyme; ARB, angiotensin II receptor blocker; BMI, body mass index; CAD, coronary artery disease; CT; computed tomography.
At the end of the study period, 344 patients had undergone AAA repair (designated as the repair group), and 70 patients had not (the non-repair group). Compared with the repair group, the non-repair group was older, more frequently had previous or current CAD, had a higher creatinine value, and a smaller AAA (Table). In both groups, the mean AAA size on follow-up CT scan was significantly larger than that on the initial CT. There was no significant difference in follow-up duration between the 2 groups (Table).
Calcium Accumulation
The individual %calcification index of the AAAs measured at initial CT distributed independently of individual AAA diameters at that time point (P=0.118) (Figure 2). Hemodialysis was significantly associated with an increased %calcification index at initial CT (P=0.028). There was a trend toward a positive correlation between diabetes and the %calcification index (P=0.078), but it did not reach statistical significance.
Calcification had progressed significantly at follow-up CT compared with initial CT (3.43±2.89% vs. 2.67±2.17%; P<0.001). There was no difference in the extent of calcification at either the initial or follow-up CT between the repair and non-repair groups. In both groups, calcification had progressed significantly at the follow-up CT compared with the initial CT (P<0.001 and P=0.014, respectively).
The extent of AAA expansion, which was converted from the increase in AAA maximal diameter between the initial and follow-up CT to an annual rate (mm/year), was inversely correlated with the calcification index of the AAA measured at initial CT (P=0.009 in nonlinear regression analysis) (Figure 3A). When limited to the patients without hemodialysis (n=400), a similar correlation was observed (P=0.013). After excluding the 12 AAAs with a calculated annual expansion rate >20 mm/year, this inverse correlation remained statistically significant (P<0.001) (Figure 3B).

ROC curve analysis was performed to predict accelerated AAA expansion >5 mm annually, which corresponds to the upper quartile of the expansion rate in this study population. The area under the ROC curve of the %calcification index of the AAAs was 0.73 (P<0.001). The best cutoff for a %calcification index of AAA <2.74%, corresponding to the inflection point of the ROC curve, showed a sensitivity of 82.1% and specificity of 57.1% (Figure 4).
In a multilevel regression analysis using AAA diameters measured on all CT scans, a %calcification index of an AAA at initial CT ≥2.74% inversely correlated with the subsequent AAA expansion rate with an estimate for fixed effects of 5.29 (95% confidence interval 3.86–6.99) (P<0.001) (Figure 5).

We found that an accelerated expansion exceeding 5 mm annually between the initial and follow-up CT was significantly associated with a %calcification index of AAA <2.74% at the initial CT (P<0.001) as well as an AAA diameter >45 mm at initial CT (P=0.007), the absence of CAD (P=0.009), and hypercreatininemia (serum creatinine value >1.5 mg/dl) (P=0.045) (Figure 6). When an AAA diameter >40 mm or >50 mm was used instead of >45 mm as a variable in this analysis, the statistical significance was weak (P=0.030) or not observed (P=0.120). The trend toward an inverse correlation between diabetes and accelerated expansion >5 mm/year was observed (P=0.056), but did not reach statistical significance. After adjusting for an AAA diameter >45 mm, the absence of CAD, and hypercreatininemia, a %calcification index of an AAA <2.74% remained a significant predictor of accelerated AAA expansion >5 mm/year (P<0.001). Also, adjusting for age >65years, sex, body mass index >25 kg/m2, hypertension, dyslipidemia, diabetes, current smoking, the existence of CAD, family history of CAD, hypercreatininemia, and medications (β, αβ-blockers, angiotensin-converting enzyme inhibitors/angiotensin-receptor blockers, statins), the %calcification index of an AAA <2.74% as well as an AAA diameter >45 mm remained significant predictors of accelerated AAA expansion >5 mm/year (P<0.001).

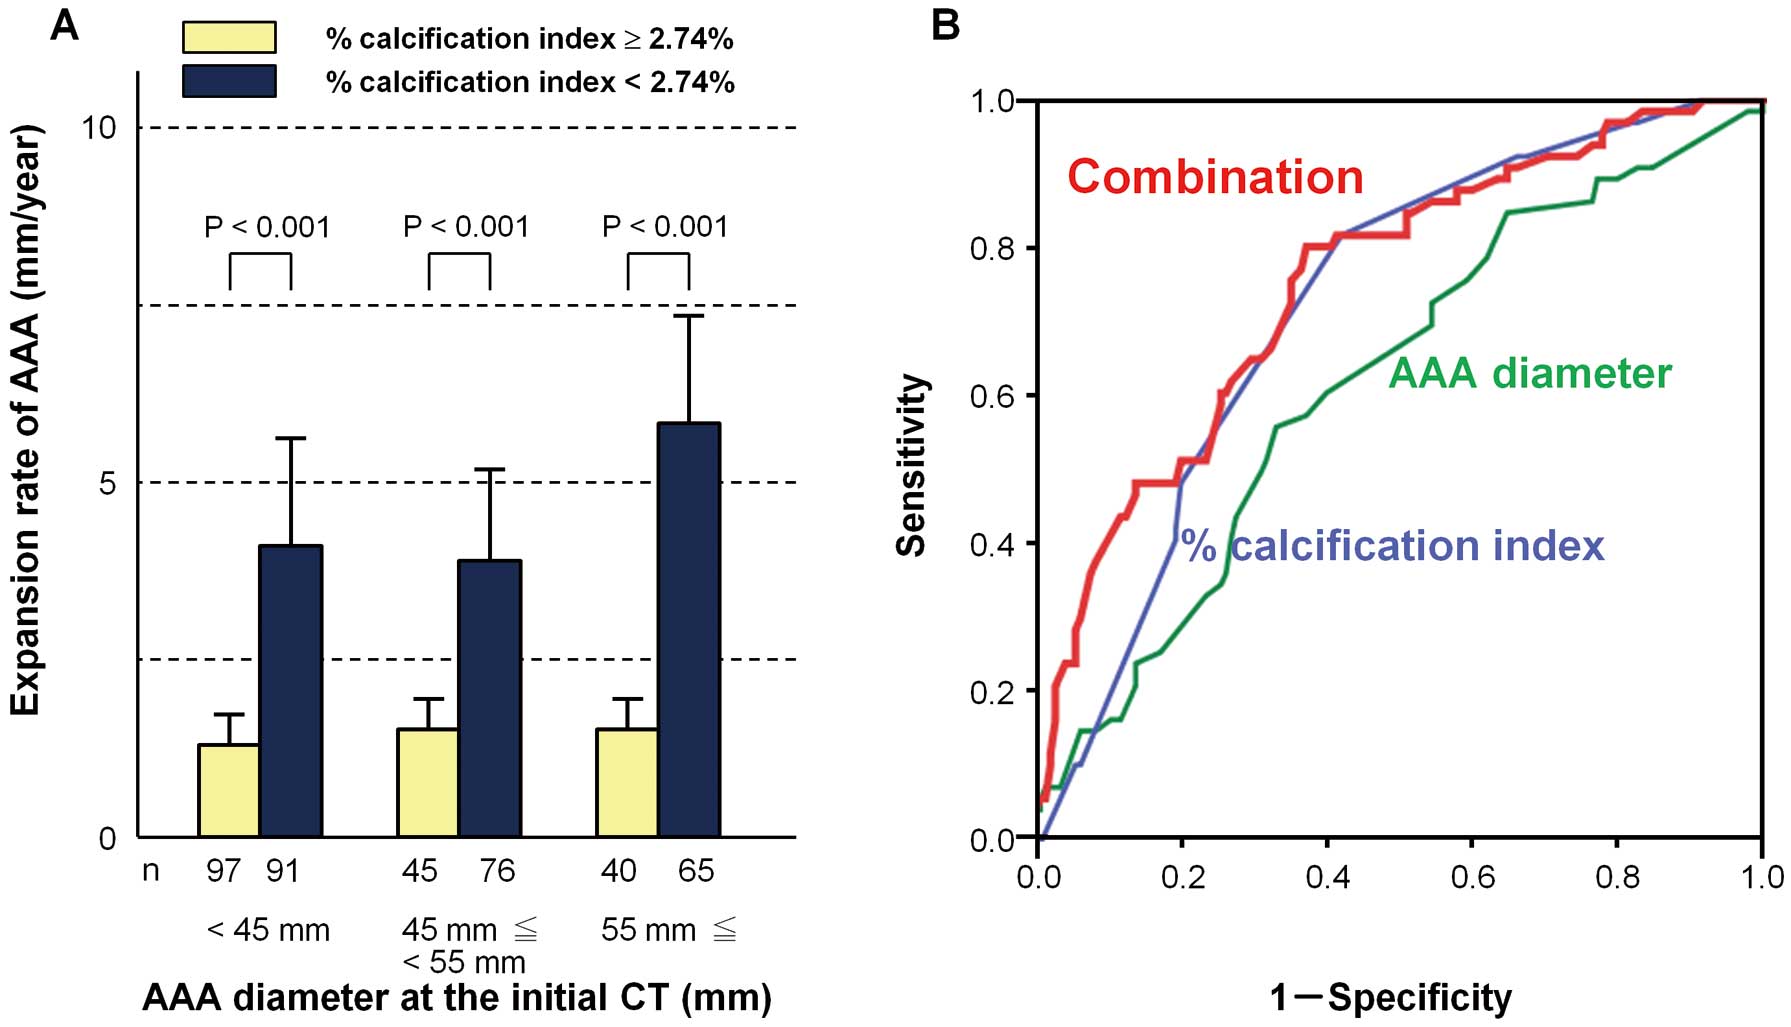
Between the %calcification index of the AAA <2.74% group and %calcification index of the AAA ≥2.74% group, the expansion rates were compared for each range of the initial AAA diameter (<45 mm, 45 mm≤ and <55 mm, ≥55 mm). The expansion rate of AAAs was significantly greater in the %calcification index of the AAA <2.74% group than in the %calcification index of the AAA ≥2.74% group in all ranges of the initial AAA diameter (Figure 7A). In order to evaluate the predictive value for accelerated AAA expansion >5 mm/year, additional ROC curve analysis was performed. The area under the ROC curve of the summation of weighted scores considering the univariable analysis on AAA diameter >45 mm and the %calcification index of the AAA <2.74% was significantly greater than that of the AAA diameter alone (0.76 vs. 0.63, P<0.001) (Figure 7B).
Discussion
In this study, we observed an obvious inverse correlation between the extent of calcification and subsequent expansion rate of infrarenal AAAs in 414 Japanese patients. Essentially, for correct follow-up of AAA expansion, an outstanding issue has been how frequently surveillance should be conducted. As the rapid expansion of an AAA can occur independently of its initial size, AAA size is not necessarily a useful determinant of subsequent rate of expansion. Another clinical marker is needed to predict AAA expansion, thereby enabling us to establish the optimal interval between serial scans. Here, the extent of calcification of the AAAs and their subsequent expansion were found to be inversely correlated. Our calcification index for an AAA <2.74% as well as an AAA diameter >45 mm could serve as a potent predictor of an accelerated expansion rate >5 mm annually, independently of each other. Although at present we do not consider AAA calcification when deciding on the follow-up interval for an AAA scan in the clinical setting, based on our present findings that less-calcified AAAs grow faster, we should follow-up less-calcified AAAs more frequently than more-calcified AAAs, independently of the AAA diameter at initial CT (Figure 7A). When our %calcification index of an AAA <2.74% is additionally taken into account, the predictive value for accelerated AAA expansion can be greatly improved as compared with the prediction based on AAA diameter alone (Figure 7B).
In addition, our findings will hopefully provide a novel insight into the pathological implications of calcification in aortic disease. The significance of calcification in coronary arteries is well known. Coronary artery calcification, which is a marker of calcified atheroma and total plaque burden in the coronary arteries,10
is known to be highly predictive of future cardiovascular events.11–13
Although the abdominal aorta and coronary arteries are the most common sites of vascular calcification,14
few studies have focused on the pathological implications of aortic calcification. According to a necropsy study, aortic calcification is related to complicated aortic atherosclerosis as well as to advanced coronary atherosclerosis, suggesting that aortic calcification serves as a marker of systemic atherosclerosis.15,16
Additionally, calcification of the abdominal aorta is associated with an increased risk of CAD, as well as cardiovascular morbidity and mortality.17–19
Aortic calcification is a common finding in patients with AAA,5
which was the case in this study. Nonetheless, few studies have focused on estimating the pathological implication of calcification in AAA progression.7
Both the size and the calcification of AAA increased longitudinally, but the relationship between size by itself and the extent of calcification of AAA varies from person to person (Figure 2). Here, we found an inverse correlation between the extent of calcification and the subsequent expansion rate of the AAA, which is consistent with the previous findings by Lindholt.7
If the CT-measured calcium accumulation in the AAA could reflect only advanced atherosclerotic processes in the abdominal aorta, the present findings imply there is an inverse correlation between aortic atherosclerosis and AAA expansion, which seems consistent with the previous findings that the expansion rate of AAA is slow in patients with diabetes or CAD who are susceptible to aortic atherosclerosis and calcification.6,20
Basically, whereas atherosclerosis is essential at least in the origin of an AAA,21
its expansion might be regulated by a mechanism distinct from that for the initiation of the AAA.22,23
The mechanisms initiating and stimulating progression of AAAs are distinct. Initial atherosclerotic plaque evolves divergently toward either advanced atherosclerosis with calcification or the external expansion of an aneurysm characterized by medial destruction.24
We detected a trend toward an inverse correlation between diabetes and accelerated expansion of AAAs (P=0.056), but it did not reach statistical significance. Apart from diabetes, there were no significant correlations between an accelerated expansion and risk factors such as current smoking, which has been reported to be correlated with the expansion rate of AAAs.6
Moreover, the %calcification index of AAAs remained a significant predictor of expansion after adjusting for these risk factors as well as for the existence of CAD by itself. Taken together, it is unlikely that an inverse correlation between calcification and expansion can be explained by known relevant risks for atherosclerosis/calcification and/or AAA expansion. Comprehensive studies including evaluation of circulating markers,25
are warranted to clarify the mechanical relationship between calcification and expansion of AAA, which might add new information about the pathogenesis of AAAs.26,27
Alternatively, calcification in the atheroma might physically resist the external expansion of an aneurysm. If calcification by itself could directly suppress expansion, our present findings may be well explained. In this regard, we should consider the possibility that calcification is a potent biomechanical regulator of AAA expansion.
Study Strengths and Limitations
A major strength of this study was the serial evaluation of AAAs by CT scanning, which is an excellent modality for serially and accurately monitoring changes in the size and characteristics of AAAs, in all participants. As well as the serial CT follow-up, detailed baseline characteristics could be collected because this study was hospital-based. Also, our study population included a broad range of patients, from those with smaller AAAs growing slowly,28
which may not reach 50 mm in the future, to those with AAAs growing rapidly and which were repaired during the study period.
The present study also has some limitations that deserve mention. First, it was subject to a selection bias. All study participants were enrolled at a referral center in Tokyo. Study participants were limited to those with infrarenal AAAs and at least 2 serial CT scans. Compared with the general population with undiagnosed AAAs, all participants were more intensively followed up in order not to miss the best timing for elective repair. AAA patients who underwent only one CT scan were not included. Taken together, this study did not necessarily reflect the spectrum of disease in the community. Secondly, in an AAA, it is difficult to distinguish mural calcification from calcification due to an intramural thrombus; therefore, our calcification index might not reflect only mural calcification, but rather both types of calcification. Intramural thrombus is found in approximately 75% of all AAAs.29
A thrombus can substantially reduce aneurysmal wall stress, and increase medial neovascularization and inflammation as well as local generation of proteases,30
all of which could influence AAA expansion. Finally, the site of maximum wall stress, which is the site most susceptible to expansion, can be markedly heterogeneous between AAAs because of the considerable differences in hemodynamic conditions. Whether the calcification is localized to the site of maximum wall stress or not might be more of a key than the total amount of calcification in AAA.
Conclusions
An inverse correlation between the extent of calcification and subsequent expansion rate was observed in 414 Japanese patients with infrarenal AAA. A calcification index <2.74% on CT imaging can be a useful predictor of accelerated expansion (>5 mm/year) of an AAA. This study also provides us with a new insight into the pathological implications of atherosclerosis/calcification in the process of AAA expansion.
Acknowledgments
This research was supported by grants-in-aid from the Ministry of Health, Labour and Welfare, Japan (to H.M. and T.M.).
Disclosures
Conflict of Interest: none declared.
References
- 1.
Sakalihasan N, Limet R, Defawe OD. Abdominal aortic aneurysm. Lancet 2005; 365: 1577–1589.
- 2.
Kent KC. Clinical practice: Abdominal aortic aneurysms. N Engl J Med 2014; 371: 2101–2108.
- 3.
JCS Joint Working Group. Guidelines for diagnosis and treatment of aortic aneurysm and aortic dissection (JCS 2011): Digest version. Circ J 2013; 77: 789–828.
- 4.
RESCAN Collaborators, Bown MJ, Sweeting MJ, Brown LC, Powell JT, Thompson SG. Surveillance intervals for small abdominal aortic aneurysms: A meta-analysis. JAMA 2013; 309: 806–813.
- 5.
Torres WE, Maurer DE, Steinberg HV, Robbins S, Bernardino ME. CT of aortic aneurysms: The distinction between mural and thrombus calcification. Am J Roentgenol 1988; 150: 1317–1319.
- 6.
Brady AR, Thompson SG, Fowkes FG, Greenhalgh RM, Powell JT; UK Small Aneurysm Trial Participants. Abdominal aortic aneurysm expansion: Risk factors and time intervals for surveillance. Circulation 2004; 110: 16–21.
- 7.
Lindholt JS. Aneurysmal wall calcification predicts natural history of small abdominal aortic aneurysms. Atherosclerosis 2008; 197: 673–678.
- 8.
De Bacquer D, De Backer G, Kornitzer M, Myny K, Doyen Z, Blackburn H. Prognostic value of ischemic electrocardiographic findings for cardiovascular mortality in men and women. J Am Coll Cardiol 1998; 32: 680–685.
- 9.
Agatston AS, Janowitz WR, Hildner FJ, Zusmer NR, Viamonte M Jr, Detrano R. Quantification of coronary artery calcium using ultrafast computed tomography. J Am Coll Cardiol 1990; 15: 827–832.
- 10.
Sangiorgi G, Rumberger JA, Severson A, Edwards WD, Gregoire J, Fitzpatrick LA, et al. Arterial calcification and not lumen stenosis is highly correlated with atherosclerotic plaque burden in humans: A histologic study of 723 coronary artery segments using nondecalcifying methodology. J Am Coll Cardiol 1998; 31: 126–133.
- 11.
Arad Y, Spadaro LA, Goodman K, Newstein D, Guerci AD. Prediction of coronary events with electron beam computed tomography. J Am Coll Cardiol 2000; 36: 1253–1260.
- 12.
Raggi P, Shaw LJ, Berman DS, Callister TQ. Prognostic value of coronary artery calcium screening in subjects with and without diabetes. J Am Coll Cardiol 2004; 43: 1663–1669.
- 13.
Greenland P, LaBree L, Azen SP, Doherty TM, Detrano RC. Coronary artery calcium score combined with Framingham score for risk prediction in asymptomatic individuals. JAMA 2004; 291: 210–215.
- 14.
Allison MA, Criqui MH, Wright CM. Patterns and risk factors for systemic calcified atherosclerosis. Arterioscler Thromb Vasc Biol 2004; 24: 331–336.
- 15.
Eggen DA. Relationship of calcified lesions to clinically significant atherosclerotic lesions. Ann NY Acad Sci 1968; 149: 752–767.
- 16.
Mitchell JR, Adams JH. Aortic size and aortic calcification: A necropsy study. Atherosclerosis 1977; 27: 437–446.
- 17.
Matsushita M, Nishikimi N, Sakurai T, Nimura Y. Relationship between aortic calcification and atherosclerotic disease in patients with abdominal aortic aneurysm. Int Angiol 2000; 19: 276–279.
- 18.
Wilson PW, Kauppila LI, O’Donnell CJ, Kiel DP, Hannan M, Polak JM, et al. Abdominal aortic calcific deposits are an important predictor of vascular morbidity and mortality. Circulation 2001; 103: 1529–1534.
- 19.
Jayalath RW, Mangan SH, Golledge J. Aortic calcification. Eur J Vasc Endovasc Surg 2005; 30: 476–488.
- 20.
Nakayama A, Morita H, Miyata T, Ando J, Fujita H, Ohtsu H, et al. Inverse association between the existence of coronary artery disease and progression of abdominal aortic aneurysm. Atherosclerosis 2012; 222: 278–283.
- 21.
Forsdahl SH, Singh K, Solberg S, Jacobsen BK. Risk factors for abdominal aortic aneurysms: A 7-year prospective study: The Tromsø Study, 1994–2001. Circulation 2009; 119: 2202–2208.
- 22.
Silence J, Lupu F, Collen D, Lijnen HR. Persistence of atherosclerotic plaque but reduced aneurysm formation in mice with stromelysin-1 (MMP-3) gene inactivation. Arterioscler Thromb Vasc Biol 2001; 21: 1440–1445.
- 23.
King VL, Lin AY, Kristo F, Anderson TJ, Ahluwalia N, Hardy GJ, et al. Interferon-gamma and the interferon-inducible chemokine CXCL10 protect against aneurysm formation and rupture. Circulation 2009; 119: 426–435.
- 24.
Yamanouchi D, Takei Y, Komori K. Balanced mineralization in the arterial system: Possible role of osteoclastogenesis/osteoblastogenesis in abdominal aortic aneurysm and stenotic disease. Circ J 2012; 76: 2732–2737.
- 25.
Golledge J, Tsao PS, Dalman RL, Norman PE. Circulating markers of abdominal aortic aneurysm presence and progression. Circulation 2008; 118: 2382–2392.
- 26.
Ciavarella C, Alviano F, Gallitto E, Ricci F, Buzzi M, Velati C, et al. Human vascular wall mesenchymal stromal cells contribute to abdominal aortic aneurysm pathogenesis through an impaired immunomodulatory activity and increased levels of matrix metalloproteinase-9. Circ J 2015; 79: 1460–1469.
- 27.
Yoshihara T, Shimada K, Fukao K, Sai E, Sato-Okabayashi Y, Matsumori R, et al. Omega 3 polyunsaturated fatty acids suppress the development of aortic aneurysms through the inhibition of macrophage-mediated inflammation. Circ J 2015; 79: 1470–1478.
- 28.
Thompson AR, Cooper JA, Ashton HA, Hafez H. Growth rates of small abdominal aortic aneurysms correlate with clinical events. Br J Surg 2010; 97: 37–44.
- 29.
Harter LP, Gross BH, Callen PW, Barth RA. Ultrasonic evaluation of abdominal aortic thrombus. J Ultrasound Med 1982; 1: 315–318.
- 30.
Vorp DA, Lee PC, Wang DH, Makaroun MS, Nemoto EM, Ogawa S, et al. Association of intraluminal thrombus in abdominal aortic aneurysm with local hypoxia and wall weakening. J Vasc Surg 2001; 34: 291–299.