Abstract
Background:
Growing evidence suggests that high serum uric acid (SUA) levels are causally related to increased risk of chronic kidney disease (CKD). However, few studies have investigated the influence of elevated SUA levels on the incidence of kidney dysfunction and albuminuria separately in community-based populations.
Methods and Results:
A total of 2,059 community-dwelling Japanese subjects aged ≥40 years without CKD were followed for 5 years. CKD was defined as kidney dysfunction (estimated glomerular filtration rate <60 ml/min/1.73 m2) or albuminuria (urine albumin-creatinine ratio ≥30 mg/g). The odds ratio (OR) for the development of CKD was estimated according to quartiles of SUA (≤4.0, 4.1–4.9, 5.0–5.8, and ≥5.9 mg/dl). During the follow-up, 396 subjects developed CKD, of whom 125 had kidney dysfunction and 312 had albuminuria. The multivariable-adjusted risk of developing CKD increased with higher SUA levels (OR 1.00 [reference] for ≤4.0, 1.21 [95% confidence interval, 0.84–1.74] for 4.1–4.9, 1.47 [1.01–2.17] for 5.0–5.8, and 2.10 [1.37–3.23] for SUA ≥5.9 mg/dl, respectively). Similarly, there were positive associations between SUA level and the adjusted risk of developing kidney dysfunction (OR 1.00 [reference], 2.30 [1.10–4.82], 2.81 [1.34–5.88], and 3.73 [1.65–8.44]) and albuminuria (1.00 [reference], 1.12 [0.76–1.65], 1.35 [0.90–2.03], and 1.81 [1.14–2.87], respectively).
Conclusions:
Higher SUA levels were a significant risk factor for the development of both kidney dysfunction and albuminuria in a general Japanese population. (Circ J 2016; 80: 1857–1862)
Chronic kidney disease (CKD) is increasingly recognized as a global health problem. The prevalence of CKD has been increasing worldwide as well as in Japan.1,2
Growing evidence suggests that individuals with CKD are more likely to develop not only endstage kidney disease that requires costly renal replacement therapy,3
but also cardiovascular disease.4–7
Kidney dysfunction and albuminuria, which are determinants of CKD, have been acknowledged as mutually independent risk factors for cardiovascular6–8
and renal events.9
Thus, identification of risk factors for kidney dysfunction and albuminuria will contribute to the establishment of effective healthcare management.
Editorial p 1710
Recently, hyperuricemia has been attracting attention at the clinical level as a risk factor for the progression of kidney dysfunction. Several epidemiological studies have demonstrated as association between higher serum uric acid (SUA) levels and greater risk of CKD incidence.10–14
However, there have been few studies investigating the influence of elevated SUA levels on the incidence of kidney dysfunction and albuminuria separately in community-based populations.15
Community-based studies with a representative sample of the target population enable the extrapolation of findings to external populations, and are of great benefit for establishing the management of patients in the real world. The aim of this study was to assess the influence of high SUA levels on the development of kidney dysfunction and albuminuria and the rate of change in the estimated glomerular filtration rate (eGFR) in a general Japanese population.
Methods
Study Participants
The Hisayama Study is an ongoing population-based prospective cohort study of cardiovascular disease and its risk factors in the town of Hisayama, which is located in a suburb of the Fukuoka metropolitan area on Kyushu Island, Japan. The population of the town in 2010 was approximately 8,400. Full community surveys of the residents have been repeated since 1961.16,17
We performed a screening survey for the present study in 2002 and 2003.18
Briefly, a total of 3,328 residents aged ≥40 years (77.6% of the total population in this age group) underwent examination. After excluding 30 subjects who did not consent to participate in the study, 86 for whom no urine or blood sample was obtained, 250 with an eGFR <60 ml/min/1.73 m2, and 538 with a urine albumin-creatinine ratio (U-ACR) ≥30 mg/g, the remaining 2,424 participants (1,042 men and 1,382 women) were enrolled in the baseline examination. Of those, 2,059 subjects (851 men and 1,208 women) who underwent a follow-up examination and had available eGFR and U-ACR data in 2007 were finally selected for analysis in the present study.
Risk Factors
At the baseline examination, blood samples were collected from an antecubital vein after an overnight fast. SUA and serum creatinine (SCr) concentrations were measured using enzymatic methods. Diabetes mellitus was defined as a fasting plasma glucose level ≥126 mg/dl, 2 h post-loaded or casual glucose levels ≥200 mg/dl, or current use of oral glucose-lowering agents or insulin. Total cholesterol and high-density lipoprotein (HDL) cholesterol levels were measured enzymatically. Hemoglobin levels were determined by sodium lauryl sulfate. High-sensitivity C-reactive protein (hs-CRP) level was measured using a modification of the Behring Latex-Enhanced CRP assay on a Behring Nephelometer BN-100 (Behring Diagnostics, Westwood, MA, USA). Fresh voided urine samples were collected at the time of examination, and urine creatinine and albumin levels were measured using the turbidimetric immunoassay method. The U-ACR (mg/g) was calculated by dividing urinary albumin values by the urinary creatinine concentrations.
Blood pressure was measured 3 times using an automated sphygmomanometer with subjects seated after at least 5 min of rest. The mean value of the 3 measurements was used for the present analysis. Hypertension was defined as a systolic blood pressure ≥140 mmHg, diastolic blood pressure ≥90 mmHg, or current use of antihypertensive agents. Body height and weight were measured in light clothing without shoes, and body mass index (BMI) was calculated as body weight in kilograms divided by height in meters squared. A self-administered questionnaire covering information on medical treatment including the use of uric acid-lowering agents (allopurinol, benzbromarone, and probenecid), smoking habits, alcohol intake, and regular exercise was completed by each participant and checked by trained interviewers. Smoking habit and alcohol intake were classified as being either habitual or not. Subjects engaging in sports or other forms of exercise ≥3 times per week during their leisure time were defined as having regular exercise.
Definition of CKD, Kidney Dysfunction, Albuminuria, and Decline in eGFR
eGFR was calculated using the following Chronic Kidney Disease Epidemiology Collaboration (CKD) equation with a Japanese coefficient19
of 0.813, where SCr is serum creatinine, κ, is 0.7 for females and 0.9 for males, α is −0.329 for females and −0.411 for males, min (SCr/κ, 1) indicates the minimum of SCr/κ or 1, and max (SCr/κ, 1) indicates the maximum of SCr/κ or 1:
eGFR (ml/min/1.73 m2)=0.813×141×min (SCr/κ, 1)α×max (SCr/κ, 1)−1.209×0.993Age
(if female, ×1.018).
Kidney dysfunction was defined as reduced eGFR (eGFR <60 ml/min/1.73 m2), and albuminuria was defined as increased U-ACR (U-ACR ≥30 mg/g) according to the Kidney Disease: Improving Global Outcomes (KDIGO) 2012 Clinical Practice Guideline for the Evaluation and Management of Chronic Kidney Disease.20
CKD was defined as kidney dysfunction or albuminuria. The rate of annual change in eGFR was calculated by the following equation:
annual change in eGFR (ml/min/1.73 m2/year)=[eGFR in 2007 (ml/min/1.73 m2)–eGFR in 2002 (ml/min/1.73 m2)]/follow-up period (years).
Statistical Analysis
Baseline SUA levels were divided into quartiles: ≤4.0, 4.1–4.9, 5.0–5.8, and ≥5.9 mg/dl. The age- and sex-adjusted linear trends in the means and frequencies of risk factors across SUA levels were tested using a linear regression analysis and a logistic regression analysis, respectively. U-ACR and hs-CRP were logarithmically transformed, because their distributions were skewed. The age- and sex-adjusted cumulative incidence of CKD, kidney dysfunction, and albuminuria were calculated using the direct method with the age and sex distributions of the overall study group. A logistic regression analysis was used to estimate odds ratios (ORs) with 95% confidence intervals (CIs) for the development of CKD, kidney dysfunction, and albuminuria according to the SUA levels. The heterogeneity in the association between the sexes was assessed by adding an interaction term in the relevant logistic model. The multivariable-adjusted mean rate of annual change in the eGFR according to the SUA levels was calculated by analysis of covariance, and the difference in the values among SUA levels were tested using a Dunnett t-test. All data analyses were done with SAS version 9.3 (SAS Institute, Cary, NC, USA) for statistical computing. A 2-tailed value of P<0.05 was considered statistically significant in all analyses.
Results
The age- and sex-adjusted baseline characteristics of the study subjects according to SUA levels are listed in
Table 1. Subjects with higher SUA levels were likely to be male. The mean values of systolic and diastolic blood pressures, total cholesterol, BMI, hemoglobin, and hs-CRP and the frequency of alcohol intake increased with higher SUA levels, while the mean values of eGFR and HDL cholesterol decreased.
Table 1.
Age- and Sex-Adjusted Baseline Characteristics of Subjects According to SUA Level (The Hisayama Study, 2002)
| Variable |
SUA level (mg/dl) |
P for trend |
| ≤4.0 (n=554) |
4.1–4.9 (n=515) |
5.0–5.8 (n=483) |
≥5.9 (n=507) |
| Age, years* |
58 (0.5) |
60 (0.5) |
60 (0.5) |
58 (0.5) |
0.89 |
| Men, %† |
13.7 |
26.5 |
44.0 |
83.9 |
<0.001 |
| Systolic BP, mmHg |
124 (0.8) |
127 (0.8) |
130 (0.8) |
132 (0.9) |
<0.001 |
| Diastolic BP, mmHg |
74 (0.5) |
77 (0.5) |
78 (0.5) |
80 (0.5) |
<0.001 |
| Antihypertensive agent, % |
10.3 |
16.6 |
23.8 |
23.7 |
<0.001 |
| Diabetes, % |
17.0 |
14.5 |
13.7 |
14.4 |
0.55 |
| Total cholesterol, mg/dl |
198 (1.5) |
207 (1.5) |
205 (1.5) |
209 (1.7) |
<0.001 |
| HDL cholesterol, mg/dl |
65 (0.7) |
64 (0.7) |
63 (0.7) |
62 (0.8) |
0.008 |
| BMI, kg/m2 |
21.9 (0.14) |
22.8 (0.14) |
23.7 (0.14) |
24.2 (0.15) |
<0.001 |
| Hemoglobin, g/dl |
13.3 (0.05) |
13.6 (0.05) |
13.8 (0.05) |
14.0 (0.06) |
<0.001 |
| UA-lowering agent, % |
0.1 |
2.3 |
0.9 |
2.1 |
0.08 |
| hs-CRP, mg/L |
0.35 (0.32–0.39) |
0.44 (0.40–0.48) |
0.48 (0.43–0.52) |
0.58 (0.52–0.64) |
<0.001 |
| eGFR, ml/min/1.73 m2 |
83 (0.3) |
82 (0.3) |
80 (0.3) |
79 (0.3) |
<0.001 |
| U-ACR, mg/g |
7.8 (7.3–8.3) |
7.1 (6.6–7.6) |
7.3 (6.8–7.8) |
7.0 (6.5–7.6) |
0.10 |
| Smoking habit, % |
23.3 |
24.2 |
23.8 |
21.6 |
0.26 |
| Alcohol intake, % |
32.8 |
45.1 |
51.3 |
53.0 |
<0.001 |
| Regular exercise, % |
9.0 |
11.4 |
12.1 |
13.4 |
0.45 |
Data are mean (standard errors), geometric mean (95% CI), or frequency. *Adjusted for sex; †adjusted for age. BMI, body mass index; BP, blood pressure; CI, confidence interval; HDL, high-density lipoprotein; hs-CRP, high-sensitivity C-reactive protein; SUA, serum UA; UA, uric acid; U-ACR, urine albumin-creatinine ratio.
During the 5-year follow-up, 396 subjects developed CKD, of whom 125 had kidney dysfunction, and 312 had albuminuria.
Figure 1
shows the age- and sex-adjusted cumulative incidence of CKD according to the SUA levels. The incidence of CKD increased significantly with higher SUA levels (P for trend <0.001). Similar findings were observed for kidney dysfunction and albuminuria (P for trend <0.001 and =0.01, respectively). The age- and sex-adjusted OR for developing CKD increased gradually with higher SUA levels (P for trend <0.001;
Table 2). This association remained unchanged after adjusting for potential confounding factors; namely, age, sex, systolic blood pressure, use of antihypertensive agents, diabetes, total cholesterol, HDL cholesterol, BMI, hemoglobin, use of UA-lowering agents, hs-CRP, baseline eGFR, U-ACR, smoking habit, alcohol intake, and regular exercise (P for trend <0.001). Compared with those with SUA ≤4.0 mg/dl, the multivariable-adjusted OR for the development of CKD was 1.21 (95% CI, 0.84–1.74), 1.47 (1.01–2.17), and 2.10 (1.37–3.23) in subjects with SUA of 4.1–4.9 mg/dl, 5.0–5.8 mg/dl, and ≥5.9 mg/dl, respectively. With regard to the component of CKD, similar linear associations were observed for the development of kidney dysfunction (OR 2.30 [95% CI 1.10–4.82] for SUA 4.1–4.9 mg/dl, 2.81 [1.34–5.88] for SUA 5.0–5.8 mg/dl, and 3.73 [1.65–8.44] for SUA ≥5.9 mg/dl) and albuminuria (1.12 [0.76–1.65] for SUA 4.1–4.9 mg/dl, 1.35 [0.90–2.03] for SUA 5.0–5.8 mg/dl, and 1.81 [1.14–2.87] for SUA ≥5.9 mg/dl). In the analysis using a continuous variable of SUA, the OR of each event increased significantly per every 1 mg/dl increment in SUA level by 18% (95% CI 5–32%) for CKD, 24% (3–49%) for kidney dysfunction, and 15% (2–30%) for albuminuria. In the subgroup analysis stratified by sex, similar associations of SUA levels with the risk of developing CKD, kidney dysfunction, and albuminuria were observed in both sexes (Table S1), and there was no evidence of heterogeneity in these associations between the sexes (all P for heterogeneity >0.41). The sensitivity analysis excluding the subjects using the UA-lowering agents (n=36) did not make any material difference to the findings (Table S2).
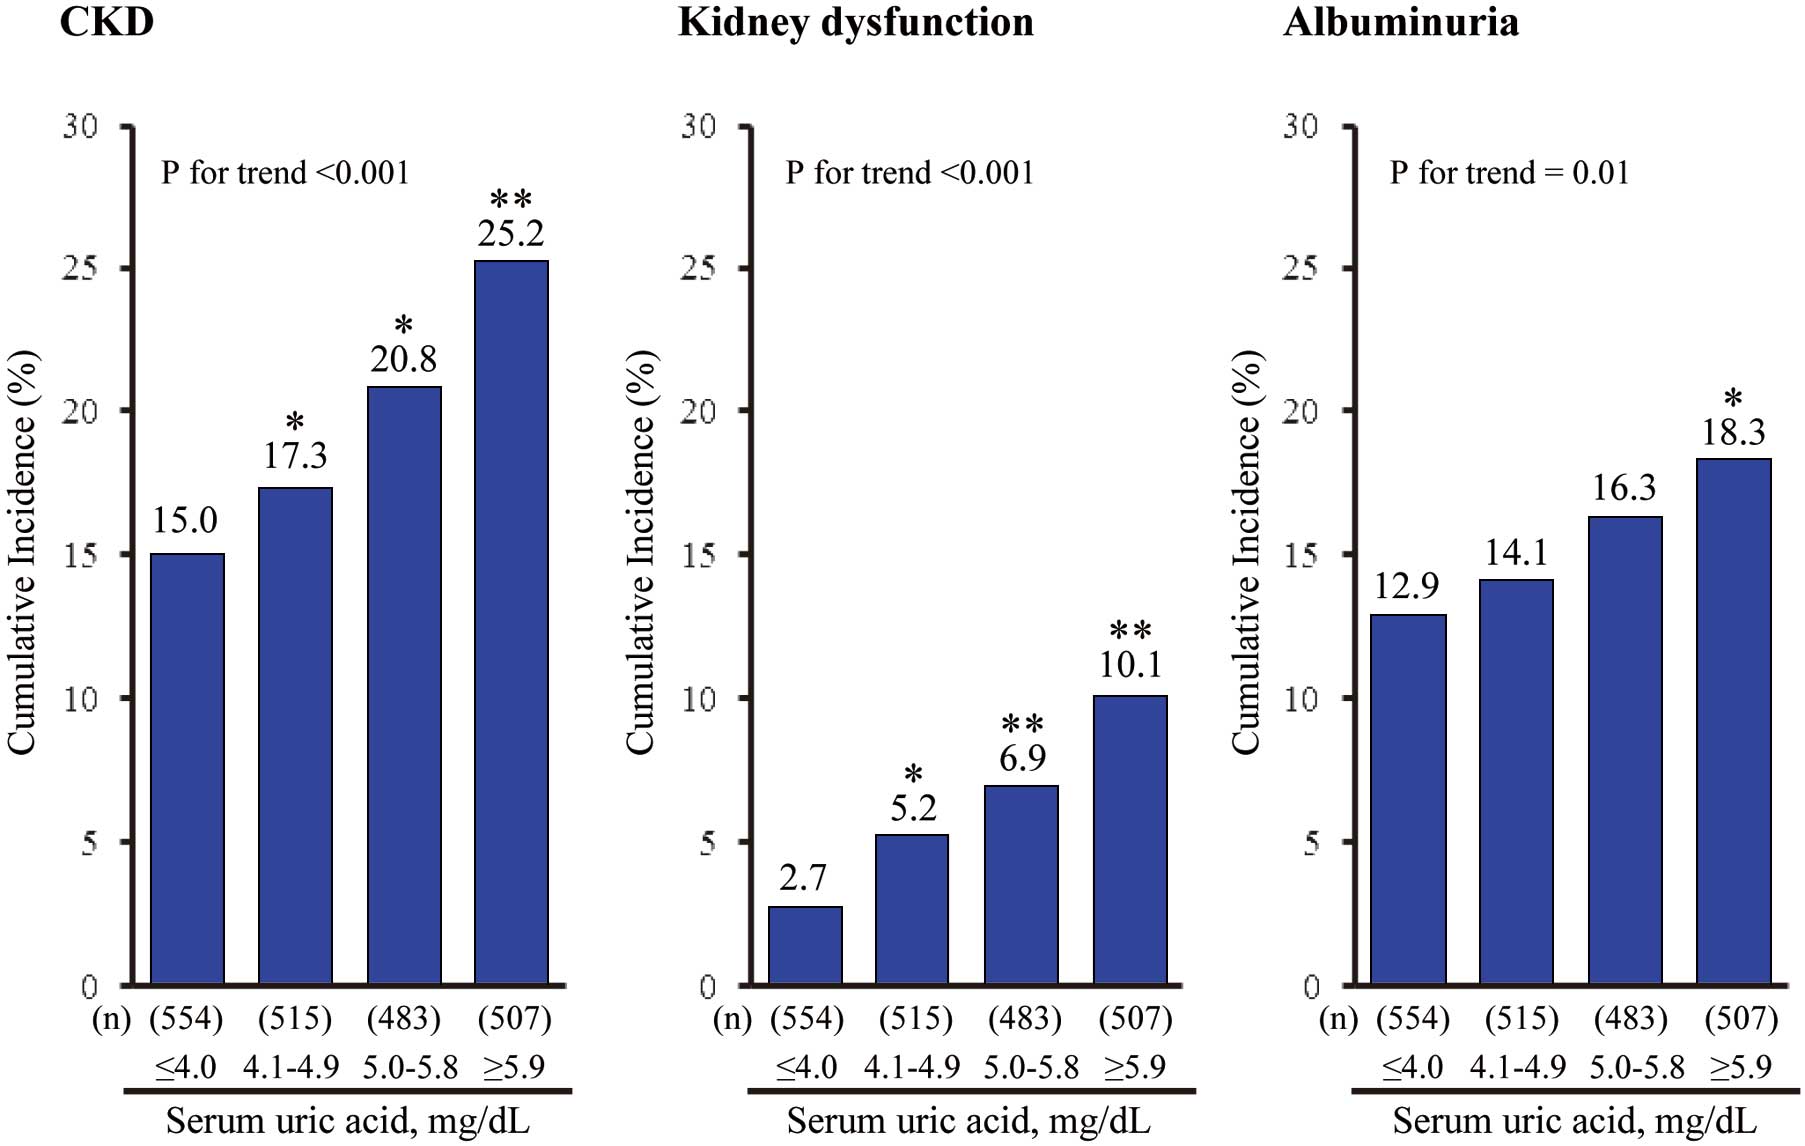
Table 2.
Age- and Sex-Adjusted and Multivariable-Adjusted OR for the Development of CKD, Kidney Dysfunction, and Albuminuria According to SUA Levels and Per 1 mg/dl Increase
| SUA, mg/dl |
Age- and sex-adjusted |
P for
trend |
Multivariable-adjusted† |
P for
trend |
| OR |
95% CI |
P value |
OR |
95% CI |
P value |
| CKD |
| ≤4.0 |
1.00 |
(Reference) |
|
<0.001 |
1.00 |
(Reference) |
|
<0.001 |
| 4.1–4.9 |
1.22 |
(0.87–1.72) |
0.26 |
1.21 |
(0.84–1.74) |
0.32 |
| 5.0–5.8 |
1.57 |
(1.11–2.22) |
0.01 |
1.47 |
(1.01–2.17) |
0.04 |
| ≥5.9 |
2.18 |
(1.49–3.18) |
<0.001 |
2.10 |
(1.37–3.23) |
<0.001 |
| Per 1 mg/dl increment |
1.21 |
(1.10–1.34) |
<0.001 |
|
1.18 |
(1.05–1.32) |
0.005 |
|
| Kidney dysfunction |
| ≤4.0 |
1.00 |
(Reference) |
|
<0.001 |
1.00 |
(Reference) |
|
0.002 |
| 4.1–4.9 |
2.40 |
(1.21–4.78) |
0.01 |
2.30 |
(1.10–4.82) |
0.03 |
| 5.0–5.8 |
3.58 |
(1.81–7.03) |
<0.001 |
2.81 |
(1.34–5.88) |
0.006 |
| ≥5.9 |
5.98 |
(2.91–12.26) |
<0.001 |
3.73 |
(1.65–8.44) |
0.002 |
| Per 1 mg/dl increment |
1.50 |
(1.27–1.76) |
<0.001 |
|
1.24 |
(1.03–1.49) |
0.03 |
|
| Albuminuria |
| ≤4.0 |
1.00 |
(Reference) |
|
0.01 |
1.00 |
(Reference) |
|
0.01 |
| 4.1–4.9 |
1.13 |
(0.79–1.62) |
0.52 |
1.12 |
(0.76–1.65) |
0.64 |
| 5.0–5.8 |
1.33 |
(0.93–1.92) |
0.12 |
1.35 |
(0.90–2.03) |
0.15 |
| ≥5.9 |
1.63 |
(1.09–2.44) |
0.02 |
1.81 |
(1.14–2.87) |
0.01 |
| Per 1 mg/dl increment |
1.12 |
(1.01–1.25) |
0.03 |
|
1.15 |
(1.02–1.30) |
0.02 |
|
†Adjusted for age, sex, systolic BP, the use of antihypertensive agents, diabetes, total cholesterol, HDL cholesterol, BMI, hemoglobin, use of UA-lowering agents, log hs-CRP, baseline estimated glomerular filtration rate, log U-ACR, smoking habit, alcohol intake, and regular exercise. CKD, chronic kidney disease; OR, odds ratios. Other abbreviations as in Table 1.
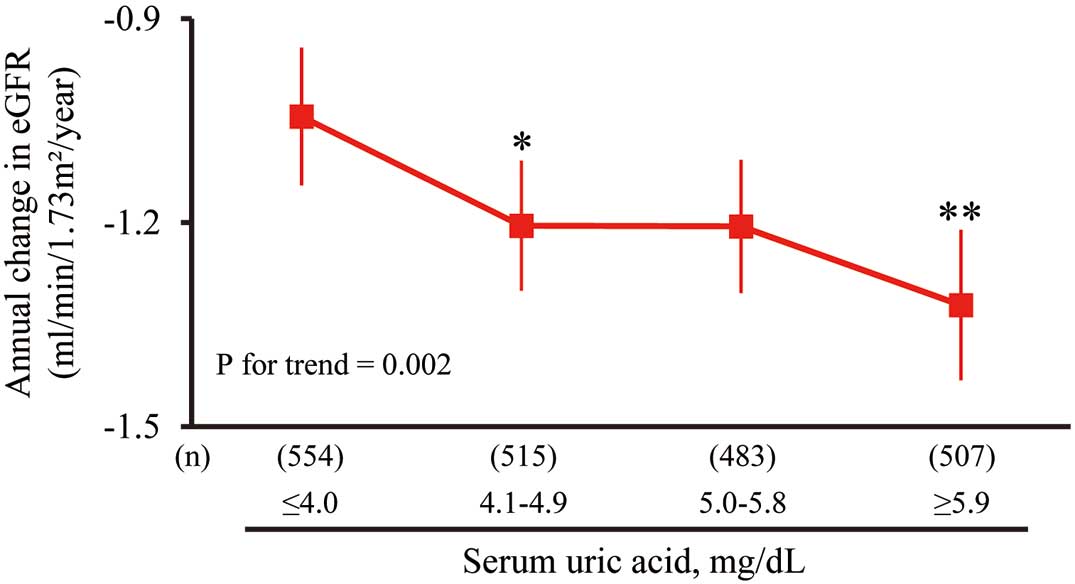
Next, we investigated the association between SUA levels and the rate of annual change in eGFR (Figure 2). This analysis showed that higher SUA levels were significantly associated with a greater decline in eGFR after adjusting for the potential confounding factors: SUA ≤4.0 mg/dl, −1.05 (95% CI −1.15 to −0.94); SUA 4.1–4.9 mg/dl, −1.21 (−1.31 to −1.12); SUA 5.0–5.8 mg/dl, −1.21 (−1.31 to −1.11); and SUA ≥5.9 mg/dl, −1.33 (−1.44 to −1.22). The difference in the multivariable-adjusted mean values of the decline in eGFR was more significant in the 2nd and 4th lowest quartile groups than in the lowest (1st) quartile group. The amount of annual change in eGFR was −0.07 (95% CI −0.12 to −0.03) ml/min/1.73 m2/year per every 1 mg/dl increment in serum SUA levels.
Discussion
The present results clearly showed that the risk for the development of CKD dose-dependently and significantly increased with higher SUA levels after adjustment for other risk factors, and this association was observed even in the normal range of SUA levels. In addition, subjects with higher SUA levels had a greater decline in eGFR. Importantly, higher SUA levels were a significant risk factor not only for the development of kidney dysfunction, but also for albuminuria. To the best of our knowledge, this is the first study to clarify prospectively the association between SUA levels and future risk of both kidney dysfunction and albuminuria in a community-based Asian population.
Several epidemiological studies have examined the association between SUA and the development of kidney dysfunction.10–14
The Okinawa General Health Maintenance Association analyzed data from 6,403 Japanese participants in a community-based screening, and found that those with SUA ≥8.0 mg/dl had a significantly higher risk of developing kidney dysfunction (defined as SCr level ≥1.4 mg/dl in men and ≥1.2 mg/dl in women) over the 2-year study period.10
In the Atherosclerosis Risks in Communities and the Cardiovascular Health Study conducted in 13,338 Americans with intact kidney function, higher SUA levels were associated with the development of kidney dysfunction (defined as eGFR <60 ml/min/1.73 m2).11
In other prospective cohort studies, both the risk for moderate to severe kidney dysfunction as assessed by eGFR12,13
and the risk for endstage kidney disease14
increased with SUA levels. These findings are in accordance with ours. Moreover, a small randomized controlled trial conducted in 54 patients with mild to moderate CKD showed that urate-lowering therapy almost halved the risk of developing kidney failure.21
These findings suggest a causal association between high SUA levels and deterioration of kidney function. Further large-scale clinical trials are warranted to elucidate this issue.
Hyperuricemia associated with hyperuricosuria has been postulated to cause kidney disease by depositing intraluminal crystals in the collecting duct of the nephron.22
UA crystals induce an acute inflammatory response, which leads to tubulointerstitial damage and reduction of kidney function.22
On the other hand, experimental studies have indicated that hyperuricemia progressed to kidney disease rapidly despite an absence of crystals in the kidney.23
In support of this finding, there was no evidence of a significant association between filtered loads of UA and the development of CKD, kidney dysfunction, and albuminuria in the present study (Table S3). It has been reported that hyperuricemia activates the renin-angiotensin-aldosterone system by a crystal-independent mechanism,24
and subsequently deteriorates kidney function through afferent renal arteriolopathy25
and tubulointerstitial fibrosis.24
Thus, subjects with higher SUA levels are likely to develop kidney dysfunction.
The present study demonstrated that higher SUA levels were significantly associated with the development of albuminuria. However, there have been very few studies addressing this association in community-based populations. Chang et al found that each 1 mg/dl increase of SUA was associated with a 1.42-fold increased risk of microalbuminuria (defined as U-ACR ≥30 mg/g) during a 4-year follow-up in a southern Taiwanese community-based population.26
The Takahata Study of Japanese community-dwellers also demonstrated that higher SUA levels at baseline were an independent risk factor for an increase in U-ACR over 1 year.27
Several possible underlying mechanisms have been proposed. Experimental studies have suggested that UA itself can promote endothelial dysfunction by several biological processes, including glomerular hypertension,28
inflammatory action,29
oxidative stress,30
and inhibition of angiogenesis.31
It has also been acknowledged that albuminuria reflects systemic endothelial dysfunction.32
The pathophysiology of the influence of SUA on albuminuria requires further exploration.
It is commonly recognized that subjects with higher SUA levels at baseline are likely to have lower eGFR levels, so our findings could have reflected nothing more than the faster development of kidney dysfunction in subjects with lower eGFR at baseline. Therefore, to rule out this potential association, we also compared the rate of change in eGFR across SUA levels. Even when accounting for this parameter, however, we found that higher SUA levels were a significant risk factor for the decline in eGFR.
Study Limitations
First, SUA levels were based on a single measurement at baseline. This may cause a misclassification of SUA level, which could have weakened the association found in this study, biasing the results toward the null hypothesis. Second, a selection bias may have arisen by the exclusion of 317 subjects who did not return to the follow-up examination. However, we believe that such a bias, if present, had little influence on our findings, because the mean values of SUA, eGFR, and albuminuria were similar between the included and excluded participants. Third, the association between SUA levels and proteinuria could not be estimated in this study, because the 5-year incidence of proteinuria was low (3.6%). Finally, we had no information about the cause of underlying kidney disease or family history of kidney disease. Accurate kidney disease information should be obtained by renal biopsy and ultrasonography, but these diagnostic procedures are not feasible for a cohort study with subjects recruited from a community-based population.
Conclusions
Higher SUA levels were a significant risk factor for the development of not only kidney dysfunction but also albuminuria in a general Japanese population. Our findings suggested that subjects with higher SUA levels should be considered a high-risk population for albuminuria as well as kidney dysfunction and should be recommended for more careful observation for the potential development of these conditions in clinical practice. At the present stage, to what extent reducing SUA levels can attenuate the risk of albuminuria and kidney disease is unknown. A clinical trial reducing SUA levels is needed to clarify whether lower SUA levels will reduce the risk of developing kidney disease.
Acknowledgments
This study was supported in part by Grants-in-Aid for Scientific Research (A) (25253048) and (C) (25460758, 26350895, 26460748, 15K09267, 15K08738, and 15K09835) from the Ministry of Education, Culture, Sports, Science and Technology of Japan; by Health and Labour Sciences Research Grants of the Ministry of Health, Labour and Welfare of Japan (H25-Junkankitou [Seishuu]-Sitei-022, H26-Junkankitou [Seisaku]-Ippan-001, H26-Nanchitou [Nan]-Ippan-042, and H27-Shokuhin-[Sitei]-017); and by the Japan Agency for Medical Research and Development (AMED) (15dk0207003 h0003, 15dk0207018 h0001, 15ek0210001 h0003, 15ek0210004s0102, and 15 gm0610007 h0203 (CREST)).
In addition, this study was sponsored by Teijin Pharma Limited (Tokyo, Japan). The sponsor of the study had no role in the study design, conduct of the study, data collection, data interpretation or preparation of the report.
The authors thank the staff of the Division of Health and Welfare of Hisayama for their cooperation in this study and residents of Hisayama Town for their participation in the survey.
Conflicts of Interest
The authors report no conflicts of interest.
Supplementary Files
Supplementary File 1
Table S1.
Age- and sex-adjusted and multivariable-adjusted OR for the development of CKD, kidney dysfunction, and albuminuria according to SUA levels and per 1 mg/dl increase stratified by sex
Table S2.
Age- and sex-adjusted and multivariable-adjusted OR for the development of CKD, kidney dysfunction, and albuminuria according to SUA quartile excluding subjects using UA-lowering agents
Table S3.
Multivariable-adjusted OR for the development of CKD, kidney dysfunction, and albuminuria according to SUA load quartile
Please find supplementary file(s);
http://dx.doi.org/10.1253/circj.CJ-16-0030
References
- 1.
National Kidney Foundation. K/DOQI clinical practice guidelines for chronic kidney disease: Evaluation, classification, and stratification. Am J Kidney Dis 2002; 39(Suppl 1): S1–S266.
- 2.
Nagata M, Ninomiya T, Doi Y, Yonemoto K, Kubo M, Hata J, et al. Trends in the prevalence of chronic kidney disease and its risk factors in a general Japanese population: The Hisayama Study. Nephrol Dial Transplant 2010; 25: 2557–2564.
- 3.
Khan S, Amedia CA Jr. Economic burden of chronic kidney disease. J Eval Clin Pract 2008; 14: 422–434.
- 4.
Go AS, Chertow GM, Fan D, McCulloch CE, Hsu CY. Chronic kidney disease and the risks of death, cardiovascular events, and hospitalization. N Engl J Med 2004; 351: 1296–1305.
- 5.
Ninomiya T, Kiyohara Y, Kubo M, Tanizaki Y, Doi Y, Okubo K, et al. Chronic kidney disease and cardiovascular disease in a general Japanese population: The Hisayama Study. Kidney Int 2005; 68: 228–236.
- 6.
Chronic Kidney Disease Prognosis Consortium,
Matsushita K, van der Velde M, Astor BC, Woodward M, Levey AS, de Jong PE, et al. Association of estimated glomerular filtration rate and albuminuria with all-cause and cardiovascular mortality in general population cohorts: A collaborative meta-analysis. Lancet 2010; 375: 2073–2081.
- 7.
Nagata M, Ninomiya T, Kiyohara Y, Murakami Y, Irie F, Sairenchi T, et al; for the EPOCH-JAPAN Research Group. Prediction of cardiovascular disease mortality by proteinuria and reduced kidney function: Pooled analysis of 39,000 individuals from 7 cohort studies in Japan. Am J Epidemiol 2013; 178: 1–11.
- 8.
Miura M, Sakata Y, Miyata S, Nochioka K, Takada T, Tadaki S, et al. Prognostic impact of subclinical microalbuminuria in patients with chronic heart failure: Report from the CHART-2 Study. Circ J 2014; 78: 2890–2898.
- 9.
Astor BC, Matsushita K, Gansevoort RT, van der Velde M, Woodward M, Levey AS, et al and The Chronic Kidney Disease Prognosis Consortium. Lower estimated glomerular filtration rate and higher albuminuria are associated with mortality and end-stage renal disease: A collaborative meta-analysis of kidney disease population cohorts. Kidney Int 2011; 79: 1331–1340.
- 10.
Iseki K, Oshiro S, Tozawa M, Iseki C, Ikemiya Y, Takishita S. Significance of hyperuricemia on the early detection of renal failure in a cohort of screened subjects. Hypertens Res 2001; 24: 691–697.
- 11.
Weiner DE, Tighiouart H, Elsayed EF, Griffith JL, Salem DN, Levey AS. Uric acid and incident kidney disease in the community. J Am Soc Nephrol 2008; 19: 1204–1211.
- 12.
Obermayr RP, Temml C, Gutjahr G, Knechtelsdorfer M, Oberbauer R, Klauser-Braun R. Elevated uric acid increases the risk for kidney disease. J Am Soc Nephrol 2008; 19: 2407–2413.
- 13.
Domrongkitchaiporn S, Sritara P, Kitiyakara C, Stitchantrakul W, Krittaphol V, Lolekha P, et al. Risk factors for development of decreased kidney function in a southeast Asian population: A 12-year cohort study. J Am Soc Nephrol 2005; 16: 791–799.
- 14.
Iseki K, Ikemiya Y, Inoue T, Iseki C, Kinjo K, Takishita S. Significance of hyperuricemia as a risk factor for developing ESRD in a screened cohort. Am J Kidney Dis 2004; 44: 642–650.
- 15.
Zhang L, Wang F, Wang X, Liu L, Wang H. The association between plasma uric acid and renal function decline in a Chinese population-based cohort. Nephrol Dial Transplant 2012; 27: 1836–1839.
- 16.
Kubo M, Kiyohara Y, Kato I, Tanizaki Y, Arima H, Tanaka K, et al. Trends in the incidence, mortality, and survival rate of cardiovascular disease in a Japanese community: The Hisayama Study. Stroke 2003; 34: 2349–2354.
- 17.
Hata J, Ninomiya T, Hirakawa Y, Nagata M, Mukai N, Gotoh S, et al. Secular trends in cardiovascular disease and its risk factors in Japanese: Half-century data from the Hisayama Study (1961–2009). Circulation 2013; 128: 1198–1205.
- 18.
Izumaru K, Ninomiya T, Nagata M, Usui T, Yoshida D, Yonemoto K, et al. Serum 1,25-dihydroxyvitamin D and the development of kidney dysfunction in a Japanese community: The Hisayama Study. Circ J 2014; 78: 732–737.
- 19.
Horio M, Imai E, Yasuda Y, Watanabe T, Matsuo S. Modification of the CKD epidemiology collaboration (CKD-EPI) equation for Japanese: Accuracy and use for population estimates. Am J Kidney Dis 2010; 56: 32–38.
- 20.
Kidney Disease: Improving Global Outcomes (KDIGO) CKD Work Group. KDIGO 2012 clinical practice guideline for the evaluation and management of chronic kidney disease. Kidney Int Suppl 2013; 3: 19–62.
- 21.
Siu YP, Leung KT, Tong MK, Kwan TH. Use of allopurinol in slowing the progression of renal disease through its ability to lower serum uric acid level. Am J Kidney Dis 2006; 47: 51–59.
- 22.
Spencer HW, Yarger WE, Robinson JR. Alterations of renal function during dietary-induced hyperuricemia in the rat. Kidney Int 1976; 9: 489–500.
- 23.
Kang DH, Nakagawa T, Feng L, Watanabe S, Han L, Mazzali M, et al. A role for uric acid in the progression of renal disease. J Am Soc Nephrol 2002; 13: 2888–2897.
- 24.
Mazzali M, Hughes J, Kim YG, Jefferson JA, Kang DH, Gordon KL, et al. Elevated uric acid increases blood pressure in the rat by a novel crystal-independent mechanism. Hypertension 2001; 38: 1101–1106.
- 25.
Mazzali M, Kanellis J, Han L, Feng L, Xia YY, Chen Q, et al. Hyperuricemia induces a primary renal arteriolopathy in rats by a blood pressure-independent mechanism. Am J Physiol Renal Physiol 2002; 282: F991–F997.
- 26.
Chang HY, Lee PH, Lei CC, Tung CW, Hsu YC, Huang TJ, et al. Hyperuricemia is an independent risk factor for new onset micro-albuminuria in a middle-aged and elderly population: A prospective cohort study in Taiwan. PLoS One 2013; 8: e61450, doi:10.1371/journal.pone.0061450.
- 27.
Suzuki K, Konta T, Kudo K, Sato H, Ikeda A, Ichikawa K, et al. The association between serum uric acid and renal damage in a community-based population: The Takahata Study. Clin Exp Nephrol 2013; 17: 541–548.
- 28.
Sánchez-Lozada LG, Tapia E, Avila-Casado C, Soto V, Franco M, Santamaría J, et al. Mild hyperuricemia induces glomerular hypertension in normal rats. Am J Physiol Renal Physiol 2002; 283: F1105–F1110.
- 29.
Kang DH, Park SK, Lee IK, Johnson RJ. Uric acid-induced C-reactive protein expression: Implication on cell proliferation and nitric oxide production of human vascular cells. J Am Soc Nephrol 2005; 16: 3553–3562.
- 30.
Corry DB, Eslami P, Yamamoto K, Nyby MD, Makino H, Tuck ML. Uric acid stimulates vascular smooth muscle cell proliferation and oxidative stress via the vascular renin-angiotensin system. J Hypertens 2008; 26: 269–275.
- 31.
Yu S, Hong Q, Wang Y, Hou K, Wang L, Zhang Y, et al. High concentrations of uric acid inhibit angiogenesis via regulation of the Krüppel-like factor 2-vascular endothelial growth factor-A axis by miR-92a. Circ J 2015; 79: 2487–2498.
- 32.
Deckert T, Feldt-Rasmussen B, Borch-Johnsen K, Jensen T, Kofoed-Enevoldsen A. Albuminuria reflects widespread vascular damage: The Steno hypothesis. Diabetologia 1989; 32: 219–226.