Abstract
Background:
Echocardiography (ECHO) plays a key role in both the diagnosis and prognosis of pulmonary hypertension (PH). Many equations have been published to assess right heart hemodynamics using ECHO. The objective of this study was to test the accuracy and precision of different echocardiographic equations in comparison with the right heart catheterization.
Methods and Results:
Complete right heart hemodynamic assessments were prospectively obtained from 115 individuals (mean age 66±1 years; 57 males) who had known or suspected PH. Several equations were tested for the estimation of right atrial pressure, mean and systolic pulmonary artery pressure (MPAP), cardiac output, pulmonary capillary wedge pressure (PCWP), and pulmonary vascular resistance (PVR). The accuracy of ECHO was good, with a mean difference <2 mmHg for all of the pressure calculations and ±0.6 L/min for cardiac output. However, the PVR estimation was weak using any one of the formulae. For all the parameters, the precision of ECHO was moderate. The MPAP calculation detected PH with a sensibility of 97% and specificity of 83%. However, ECHO underdiagnosed post-capillary PH.
Conclusions:
ECHO is a good method for the diagnosis of PH, with an adequate calculation of right pressures, but cannot accurately calculate PCWP and PVR. (Circ J 2016; 80: 2019–2025)
Right heart catheterization (RHC) is the gold standard for the diagnosis and hemodynamic assessment of pulmonary hypertension (PH).1
Although safe,2
this invasive procedure is unsuitable for widespread application.3
As an alternative, current guidelines recommend transthoracic Doppler echocardiography (ECHO) as the best method to diagnose PH, evaluate hemodynamic impairment, monitor disease progression over time, determine some prognostic factors and evaluate the response to therapy.1,4–8
The merits of both methods are often compared, especially for the estimation of systolic pulmonary artery pressure (SPAP).9
However, SPAP does not describe all of the hemodynamic parameters involved in the progression and prognosis of PH. Other hemodynamic parameters have also been separately validated for ECHO using various equations, in animal and human studies and under different clinical conditions (including PH).10–16
A complete right heart hemodynamic profile assessment is critical for PH and directly influences disease management and treatment. All the published and validated equations and methods of calculating right heart hemodynamics have mainly been compared separately, each focusing on 1 parameter.10,13,15,17–21
The aims of this study were to: (1) assess right heart hemodynamic profiles using different ECHO equations in the same series of patients, (2) determine the accuracy and precision of all the equations when compared with RHC values, and (3) assess the clinical applicability of ECHO, comparing the different equations in PH.
Methods
This prospective single-center study was conducted from May 2011 to June 2012 and consecutively included all patients with suspected or known PH. Both ECHO and RHC were consecutively performed (mean delay, 16 min) and under the same conditions (at rest, supine and without sedation and oxygen supplementation). The study conformed to the ethical Declaration of Helsinki and was approved by the institutional ethics committee. All the participants provided written informed consent. Exclusion criteria were poor quality of the ECHO imaging or incomplete invasive measurements.
Right Heart Catheterization
RHC was performed without sedation by 2 experienced pneumologists who were blinded to the ECHO features (MC and IE). Using continuous pressure monitoring (Solar 9500, GE Medical System; Freiburg, Germany), the catheter was positioned in the right heart cavity and pulmonary artery. After calibrating the transducer at the middle of the chest, hemodynamic and electrical signals were digitized with a sampling rate of 12 kHz, stored on a PC, and analyzed using Chart 5 software (ADInstrument; Oxford, UK). The right atrial pressure (RAP, mmHg), systolic and mean pulmonary artery pressures (SPAP and MPAP, mmHg), and pulmonary capillary wedge pressure (PCWP, mmHg) were recorded at the end of a normal expiration. Cardiac output (CO, L/min) was calculated based on the Fick method using a direct measure of the oxygen uptake (V̇O2, ml/min; CPX, MedGraphics; St. Paul, MN, USA). The pulmonary vascular resistance (PVR, WU) was calculated as PVR=(MPAP–PCWP)/CO. Hemodynamic definitions of PH used cut-off values ≥25 mmHg and ≤15 mmHg for both the diagnosis of PH and distinguishing between pre- and post-capillary PH.1
Transthoracic Doppler ECHO
ECHO was performed with an IE 33 device (Philips Medical System; Bothell, WA, USA) using a 3-MHz transducer in the left lateral position except for the ICV diameter measurement. Doppler images were recorded at a sweep speed of 100 mm/s, and all measurements were calculated as the mean of at least 3 heart cycles (5 cycles for the patients in atrial fibrillation [AF]) during a short, normal end-expiratory pause. All measurements were made by the same experienced sonographer (SD) and analyzed off-line (Medseen personal 1.5.1 software, Softway Medical; Meyreuil, France) by 2 trained cardiologists (SD and PDM) who were blinded to the invasive hemodynamics, in accordance with the European Society of Echocardiography guidelines.22,23
The following echocardiographic data were obtained:
• right atrial area (cm2) and volume (ml), indexed by body surface area
• inferior vena cava (IVC) diameter (mm) and its collapse during a “sniff” maneuver while supine; RAP estimation was expressed as normal (0–5 mmHg), intermediate (5–10 mmHg), or high (10–20 mmHg)
• right ventricle (RV) outflow tract velocity time integral (VTI, cm) and acceleration time (AT, ms); a midsystolic notch on the ventricular outflow tract VTI was systematically inspected
• mitral and tricuspid Doppler inflow patterns to measure early (Em, Et) wave peak velocities (cm/s); lateral Doppler tissue imaging of mitral and tricuspid annuli early (E’m, E’t) peak velocities (cm/s); E/E’ ratio was used in RAP (for tricuspid) and PCWP (for mitral) calculations
• tricuspid regurgitation (TR) velocity (TRV, m/s) from multiple views
• CO was calculated as (π×LVOT2/4)×VTILVOT
×HR, where LVOT is the left ventricular outflow tract and HR is the heart rate (beats/min).
The right heart hemodynamic data were calculated using various published equations (Table 1). When an equation was dependent on other calculated hemodynamic parameters, the value of the best method was used.
Table 1.
Equations Used in Echocardiography for Hemodynamic Parameters (See Superscript Numbers for References)
| Calculated parameters |
Equations used |
| RAP (mmHg) |
RAP (1)=IVC diameter and collapsibility index (“sniff”)36* |
| RAP (2)=0.8+1.7×Et/E’t37 |
| SPAP (mmHg) |
SPAP=4×TRV2+RAP23 |
| MPAP (mmHg) |
MPAP (1)=mean gradient method13 |
| MPAP (2)=0.61×SPAP+228 |
| Log10MPAP (3)=−0.0068×AT+2.129 |
| MPAP (4)=90−0.62×AT38 |
| CO (L/min) |
CO=(π×LVOT2/4)×VTILVOT×HR23 |
| PCWP (mmHg) |
PCWP (mmHg)=(1.24×Em/E’m)+1.931 |
| PVR (WU) |
PVR (1)=TRV/TVIRVOT×10+0.1611 |
| PVR (2)=(MPAP−PCWP)/CO |
| PVR (3)=SPAP/TVIRVOT33 |
| PVR (4)=SPAP/TVIRVOT+0 or 314** |
*Collapsibility index=([IVCmax−IVCmin]/IVCmax); RAP estimation is expressed as normal (0–5 mmHg), intermediate (5–10 mmHg), or high (10–20 mmHg); the midrange values of 3, 8 and 15 were used to calculate the mean and the SEM; **When right ventricular outflow tract velocity time integral midsystolic notching was present, a constant value of 3 UW was added. AT, acceleration time of the right ventricle outflow; CO, cardiac output; Em, early mitral Doppler inflow wave peak velocity; E’m, Doppler tissue imaging of early mitral annuli peak velocity; Et, early tricuspid Doppler inflow wave peak velocity; E’t, Doppler tissue imaging of early tricuspid annuli peak velocity; HR, heart rate; IVC, inferior vena cava; LVOT, left ventricle outflow tract; MPAP, mean pulmonary artery pressure; PCWP, pulmonary capillary wedge pressure; PVR, pulmonary vascular resistance; RAP, right atrial pressure; SPAP, systolic pulmonary artery pressure; TRV, tricuspid regurgitation velocity; VTI, velocity time integral.
All data are expressed as mean±standard error of the mean. Analyses were performed using GraphPad software (La Jola, CA, USA). ECHO and RHC hemodynamic values were correlated using linear regression analysis (expressed as a Pearson’s correlation coefficient after testing for normal distribution) and compared using a Bland-Altman analysis.24
The accuracy of each formula was assessed by estimating the mean difference between the ECHO and RHC values and their 95% confidence interval (CI). Precision was assessed by calculating the lower and upper limit of agreement (mean difference±1.96*[standard deviation of the differences, after testing for normal distribution of the differences]) and by estimating the proportion of tolerated measures, defined for each parameter. The difference between 2 methods was assessed by one-way analysis of the variance. Sensitivity, specificity, and positive and negative predictive values were calculated for the RAP(1) and Em/E’m ratio. A P value <0.05 was considered statistically significant.
Results
This study included 115 patients; 9 patients (7.8%) were excluded because of poor quality echocardiographic images. The characteristics of the other 106 patients are summarized in
Table 2. All patients except 19 (17.9%) were in sinus rhythm. Patients in AF were analyzed separately; however, because the results were the same (data not shown), we chose to present the results for the entire population. Eighteen patients (16.9%) did not have hemodynamic criteria for PH based on the RHC. The intra- and interobserver variabilities were <5% for all parameters. The invasive hemodynamic and Doppler echocardiographic data are presented in
Table 3. The differences between ECHO and RHC for all parameters are shown in
Table 4
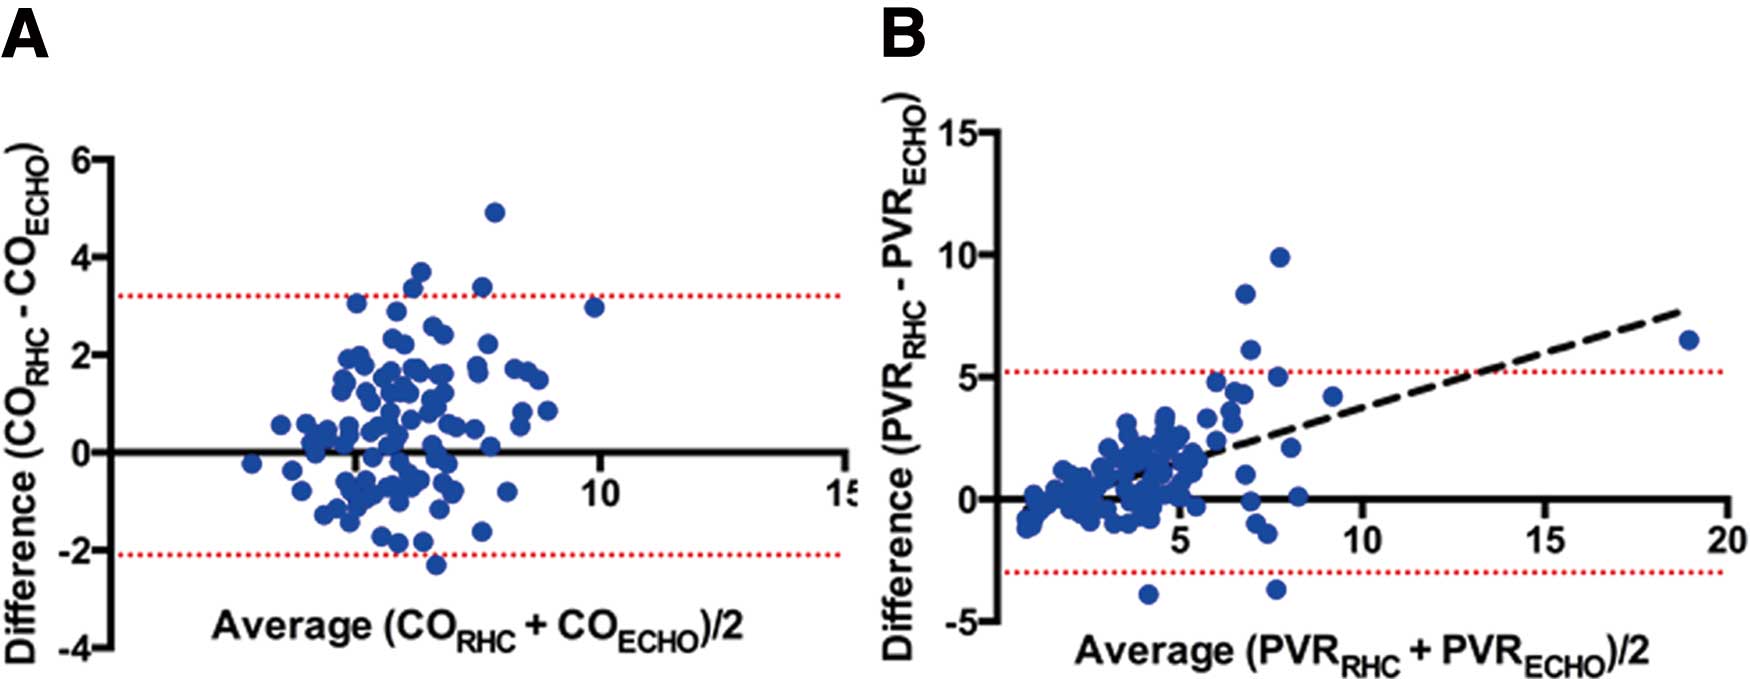
for the entire population. A separate analysis has been separately made for the PH of the group 1 with the same results and conclusions (data not shown). Bland-Altman plots of ECHO and RHC hemodynamic values for the best equations (see later) are shown in
Figures 1
and
2. There was a significant difference between the various equations for the hemodynamic parameters calculated.
Table 2.
Demographic Data, Clinical Classification, and Functional Status of the 106 Patients With PH
| Age (year) |
65.6±1.1 [37.7–89.3] |
| Female/male, n (%) |
49 (46.2)/57 (53.8) |
| AF, n (%) |
19 (17.9) |
| BMI |
28.5±0.7 [12.5–48.9] |
| Cause of PH, n (%) |
| No HP |
18 (16.9) |
| Group 1 |
46 (43.4) |
| Group 1’ |
4 (3.8) |
| Group 2 |
11 (10.4) |
| Group 3 |
12 (11.3) |
| Group 4 |
13 (12.3) |
| Group 5 |
2 (1.9) |
| NYHA class, n (%) |
| I |
4 (3.8) |
| II |
36 (33.9) |
| III |
55 (51.9) |
| IV |
11 (10.4) |
Groups defined by the Cologne Consensus Conference on PH.39 AF, atrial fibrillation; BMI, body mass index; NYHA, New York Heart Association; PH, pulmonary hypertension.
Table 3.
RHC and Doppler Echocardiographic Hemodynamic Measurements
| |
RHC |
ECHO |
| HR (beats/min) |
77 15 [52~123] |
75±13 [50~110] |
| SpO2 (%) |
91±5 [77~99] |
92±5 [78~99] |
| MBP (mmHg) |
95±1 [70~140] |
94±2 [71~139] |
| RAP (mmHg) |
8±1 [0~30] |
6±1(1) [0~20] |
| 8±0(2) [3~28] |
| SPAP (mmHg) |
60±2 [18~109] |
59±2 [18~113] |
| MPAP (mmHg) |
38±1 [10~67] |
37±1(1) [12~64] |
| 34±1(2) [14~64] |
| 37±1(3) [10~84] |
| 38±1(4) [−9~66] |
| CO (L/min) |
6.3±0.2 [2.8~11.4] |
5.7±0.1 [3~8.5] |
| PCWP (mmHg) |
11±1 [1~28] |
13±0 [2~35] |
| PVR (WU) |
4.7±0.3 [0.2~22.2] |
2.1±0.1(1) [1.1~6.6] |
| 4.6±0.3(2) [−0.2~6.3] |
| 3.6±0.2(3) [0.9~15.7] |
| 5.9±0.3(4) [0.9~18.7] |
Numbers in parentheses represent the equation used for the ECHO calculation (see Table 1 for the formulae). ECHO, echocardiography; MBP, mean blood pressure; SpO2, oxygen saturation measured by pulse oximetry. Other abbreviations as in Table 1.
Table 4.
Correlations and Limits of Agreement Between RHC and ECHO
| ECHO |
r |
Mean difference (95% CI) |
SD of differences |
Limit of agreement (95% CI) |
Median (range) |
Limit of the parameter |
No. (%) within limit |
| Lower |
Upper |
Absolute difference |
| RAP (1) |
0.70 |
1.9 (1~2.7) |
4.1 |
−6.1 |
9.9 |
2.5 (0.5~13.5) |
5 mmHg |
84 (79) |
| RAP (2) |
0.40 |
0.3 (−0.6~1.3) |
5 |
−9.4 |
10.1 |
−0.2 (−12.2~−15.7) |
5 mmHg |
78 (74) |
| SPAP (1) |
0.84 |
1.4 (−0.9~3.8) |
12.2 |
−22.6 |
25.4 |
1.5 (−29.5~37.5) |
10 mmHg |
72 (68) |
| MPAP (1) |
0.85 |
1.1 (−0.3~2.5) |
7.1 |
−12.9 |
15.1 |
0.6 (−19.4~21.4) |
10 mmHg |
89 (84) |
| MPAP (2) |
0.78 |
3.4 (1.7~5)* |
8.6 |
−13.4 |
20.2 |
2.1 (−17.2~28.5) |
10 mmHg |
78 (74) |
| MPAP (3) |
0.55 |
0.8 (−1.8~3.4)** |
13.3 |
−25.3 |
27.0 |
−0.3 (−73.9~28.2) |
10 mmHg |
67 (63) |
| MPAP (4) |
0.61 |
−0.5 (−2.9~1.9) |
12.5 |
−25.0 |
24.0 |
−1.3 (−34.2~39.2) |
10 mmHg |
68 (64) |
| CO |
0.72 |
0.6 (0.3~0.9) |
1.1 |
−2.1 |
3.2 |
0.5 (−2.3~4.9) |
1 L/min |
70 (66) |
| PCWP |
0.51 |
−1.2 (−2.1~−0.2) |
5.0 |
−11.0 |
8.6 |
−1.6 (−13.1~17.5) |
5 mmHg |
75 (71) |
| PVR (1) |
0.70 |
2.6 (2~3.1)§ |
2.7 |
−2.6 |
7.8 |
2.2 (−1.7~15.6) |
1 WU |
27 (25) |
| PVR (2) |
0.86 |
−2.2 (−2.6~−1.9)§ |
1.9 |
−5.9 |
1.5 |
−2.0 (−7.1~2.9) |
1 WU |
23 (22) |
| PVR (3) |
0.75 |
1.1 (0.7~1.5)§ |
2.1 |
−3.0 |
5.2 |
0.7 (−4~9.9) |
1 WU |
52 (49) |
| PVR (4) |
0.75 |
−1.1 (−1.5~−0.7)§ |
2.2 |
−5.3 |
3.1 |
−1.1 (−6.7~6.9) |
1 WU |
35 (33) |
Numbers in parentheses represent the equation used for the ECHO calculation (see Table 1 for formulae). *P=0.005 with methods 1 and 4; **P<0.0001 with method 4; §P<0.00001 for all other methods. Abbreviations as in Tables 1,3.

The semiquantitative formula (RAP(1)) was an accurate estimation of RAP, with an adequate evaluation found in 63/106 patients (59%) (Table 5). Among the 106 patients, 27 (25.5%) had a RAP <5 mmHg based on the RHC. Interestingly, there was a significant positive relationship between the RAP (KT) equation and the RA indexed surface and volume (r=0.62 and r=0.66, respectively; P<0.0001). The quantitative formula (RAP(2)) was also an accurate estimation, with a mean difference of only 0.3 mmHg; however, the precision was weak, with a standard deviation of differences of 5 mmHg, and 74% (78/106) of the calculated values were within the limit of 5 mmHg. The difference between the ECHO and RHC measurements significantly increased (r=0.35; P=0.0002) as the mean of these 2 measurements increased (Figure 1). The RAP estimation method (RAP(1)) was chosen for further calculations.
Table 5.
Correlation Between ECHO Estimates of RAP Based on IVC Diameter Variations and RAP Values Obtained With RHC (Normal, Intermediate, and High Indicate the Level of the Estimated RAP)
| |
RAP (RHC) |
Total |
| 0−5 |
5.1–10 |
≥10.1 |
| ECHO |
| Normal [0–5] |
25 |
28 |
4 |
57 |
| Intermediate [5–10] |
1 |
25 |
6 |
32 |
| High [10–20] |
1 |
3 |
13 |
17 |
| Total |
27 |
56 |
23 |
106 |
Abbreviations as in Tables 1,3.
As expected, SPAP and MPAP were strongly linearly correlated on RHC (MPAP=0.6×SPAP+2; r=0.97; P<0.0001).
On ECHO, TR was recorded in all patients. Notching on the RVOT signal was only present in 59% (52/88) of the patients with PH. The calculation of both SPAP and MPAP was reasonably accurate, with a mean difference between the calculated and measured values of only 1.4 mmHg for the systolic pressure and –0.5 to 3.4 mmHg for the mean pressure, depending on the method.
There was a significant difference between the 4 formulae when calculating MPAP (P=0.003). Precision was similar for the 4 methods (P=0.76). The 2nd method had the worst accuracy and was significantly different from the other 3 (P=0.005). No differences existed between equations 1, 3, and 4; however, the 1st equation was more relevant, as evidenced by the lower standard deviation of the differences (7.1 mmHg for the 1st method vs. 13.3 and 12.5 mmHg for the 3rd and 4th methods, respectively). Interestingly, the mean gradient method was more accurate and precise for the MPAP calculation than the SPAP determination, although it was not significant. The 1st method (MPAP (1)) was used to calculate the PVR in the next equation (Figure 1).
Calculation of PCWP
The calculation of an absolute value for the PCWP was accurate, with a mean difference between the calculated and measured value of only –1.2 mmHg. However, the precision was poor, with an SD of 5 mmHg, and 72% of the value within 5 mmHg (Figure 1).
Calculation of CO
The accuracy of the Doppler method for estimating CO was good, with a mean difference between the ECHO and RHC values of only 0.6 L/min, and 66% of the calculated values within 1 L/min. However, the precision was poor, with a SD of the differences of 1.1 L/min (Figure 2).
Calculation of PVR
The calculation of PVR using ECHO was globally poor. The 1st and 2nd equations had the worst accuracy and tended to systematically underestimate (1st) or overestimate (2nd) the PVR values. The 3rd formula was significantly (P<0.0001) more accurate than the 1st, with a mean difference of 1.1 WU and more values (49% vs. 26% for the 3rd and 1st methods, respectively) within the limits of ±1 WU (Figure 2). The 3rd method led to an underestimation of the value when the mean value increased (r=0.53; P<0.0001).
Overall Hemodynamic Diagnosis and Classification of PH
When the MPAP was calculated with the 1st formula (PAP (1)), it was able to diagnose PH with a sensibility of 97% and a specificity of 83%; only 3 patients were misclassified (ie, high MPAP with ECHO that was unconfirmed by RHC). Among those patients with PH diagnosed by both ECHO and RHC (n=85, 17 patients with AF), 70.6% (60/85) had mainly precapillary hypertension. Both the absolute value of PCWP and the cut-off value of ≤10 for the Em/E’m ratio to distinguish between pre- and post-capillary PH (ie, ≤15 mmHg) misclassified PH in 18.8% and 25.9% of the patients, respectively. ECHO mainly underdiagnosed post-capillary PH. However, an Em/E’m ratio >10 was never seen in precapillary PH patients (negative predictive value of 100%).
Discussion
A central hemodynamic profile is crucial for the diagnosis, classification (MPAP and PCWP), and prognosis (RAP, MPAP, or cardiac index)25
of PH. The main outcomes of this study were: (1) an examination of the accuracy and precision of results for different equations used in ECHO vs. RHC and (2) confirmation that ECHO is accurate for the diagnosis of PH, compared with RHC, but unsuitable for the classification of PH, mainly because of underdiagnosed post-capillary PH. The precision of ECHO is weak; it cannot be used to assess an individual’s right heart hemodynamic profile.
Mean RAP
Determination of RAP is unnecessary for the diagnosis of PH, although elevated values have been found to be significantly associated with death in most studies and registries,26
making an accurate assessment an important factor for the patient’s prognosis. ECHO is routinely used to evaluate RAP, using both the IVC diameter during respiration and the Et/E’t ratio. In our study, neither of these methods provided an accurate estimation of mean RAP values. The Bland-Altman analysis revealed that estimation of RAP was wide for normal values <10 mmHg: the Et/E’t ratio resulted in an underestimation, and the IVC diameter showed an important dispersion. It could be necessary to reach a certain level of RAP before observing IVC dilatation. The relationship we observed with the dilatation of the RA supports this hypothesis.
RAP is a component of the calculation for both SPAP and MPAP and one of the main sources of error in this calculation.18
In our study, only 25.5% of the patients had a normal RAP, <5 mmHg. Systematically assigning this value to the atrial pressure overestimates the RAP and secondary calculation of PAP. The influence of this RAP depends on the level of PAP and is less important in severe PH than for the diagnosis of “borderline” PH.27
Pulmonary Artery Pressure
SPAP is the commonly recommended ECHO parameter used for the evaluation of patients with known or suspected PH1
and is often the only parameter used for the hemodynamic assessment of pulmonary circulation. Because the hemodynamic definition of PH uses MPAP, the theoretical equation published by Chemla et al28
is recommended for this calculation from the ECHO SPAP value. A prospective study comparing gradient methods and Chemla’s equation for MPAP calculation concluded that they were equally suitable for clinical use,13
and a recent study of chronic thromboembolic PH had similar results.21
In our study, we chose to test the recommended equation (method 2),28
as well as other published formulae, that are based on the ventricular-atrial gradient method or the Doppler pulmonary AT. Using our 106 patients who had a range of SPAP from 17 to 109 mmHg, we found similar precision to the previously published study.13
However, our study indicated that the recommended method28
was less accurate, with a mean difference of 3.4 mmHg, similar to the study of Aduen et al.13
The relationship between SPAP and MPAP with the gradient method was significant but weaker than with RHC (r=0.82; P<0.0001).
The 2 methods that used pulmonary AT in the calculations (methods 3 and 4) were similarly accurate but less precise than the mean gradient method. This is likely because pulmonary AT has more curvilinear negative correlations with MPAP, as measured with RHC.29
Nevertheless, because the resting MPAP is the consequence of both PA resistance and RV function, a normal arterial pressure should not necessarily dissuade the clinician from suspecting PH if there is evidence of systolic dysfunction.
PCWP
PCWP is a key element in the classification of PH because it is a strong and accurate estimation of left atrial pressure.30
Although it is debated,27
the cut-off value for the diagnosis of precapillary PH is fixed at ≤15 mmHg on RHC, assuming a normal LV filling pressure. This parameter is also fundamental because the safety and efficacy of PH-targeted therapies have not been validated in group 2 PH patients.
ECHO is a validated method to calculate the LV filling pressure using the Em/E’m ratio.31
However, we did not find a good correlation between the ECHO-calculated PCWP and RHC (r=0.51; P<0.0001). This discrepancy can be explained by the difference in the 2 populations. The equation has been validated (r=0.87) in 60 cardiac patients with left impaired relaxation (E/A <1) and pseudonormal mitral pattern.31
When considering this population, the mean PCWP was 20±8 mmHg (range: 7–42 mmHg), but most had a PCWP <15 mmHg. Our study population was different; it included only patients with known or suspected PH, and the PCWP value was lower, with a mean of 11±1 mmHg (range: 1–28 mmHg). Only 23 patients (21.7%) had a PCWP above the cut-off value of 15 mmHg. None of the patients had LV dysfunction. Although disappointing, it is not necessary to calculate the absolute value of PCWP for PH classification. Indeed, ECHO only has to determine arguments that suggest LV or valvular dysfunction and select patients who eventually need left heart catheterization. Although the estimation of the LV filling pressure using the Em/E’m ratio had a good negative predictive value (100%), it must be integrated with clinical and echocardiographic findings to suggest the presence of LV dysfunction (LA size, LV ejection fraction, segmental contraction, etc).
CO
Calculation of CO is crucial for determining the prognosis of PH, as well as for the calculation of PVR. In our study, the mean bias (95% CI) was 0.6 L/min. This is less accurate than the 0.3 L/min found in a recent study that compared ECHO and thermodilution.15
We chose to use the gold standard Fick method to determine CO using RHC. Although both methods provided excellent accuracy, thermodilution is less precise, with the limits of agreement of ±1 L/min; this could explain the difference between the studies.32
PVR
Several methods have been described to calculate PVR.11,14,33
Because it is directly related to pressure changes and inversely related to pulmonary flow, all methods are based on the ratio between pulmonary pressure on one side (SPAP or TRV) and TVIRVOT
on the other side. In our study, we compared these methods with the formula used in RHC. This calculation systematically underestimated the PVR value. The mean difference of −2.2 WU and poor precision, with only 22% in the range of ±1 WU, made it unsuitable for individual clinical use. The other 3 equations were better but significantly different. The 4th formula was not precise, probably because the equation integrates an absolute value of 0 or 3 mmHg when a notching is present or absent, respectively. Unfortunately, notching was only seen in 59% of our patients with PH, similar to the 53% reported in the literature.29
This could explain the lack of accuracy observed with this method. As previously described, all the equations became less accurate when the PVR increased.33,34
Our results confirmed than estimation of PVR is not adequately established with ECHO.23
When this value is important to guide therapy, the calculation must be determined using RHC.
Conclusions
A complete assessment of right hemodynamics is possible with ECHO, which is an accurate method for the diagnosis of PH, both in patients in sinus rhythm and in AF, by estimating RAP using IVC modulation with respiration and calculating MPAP with the mean gradient method. Because this last equation is accurate, it must be used by a cardiologist. However, PCWP and PVR cannot be accurately estimated with ECHO.
ECHO lacks the precision to establish the pre- or post-capillary origin of PH, especially under-estimating post-capillary PH.
For PH diagnosis and prognosis, a complete anatomical and functional assessment of the right heart is crucial. New methods for exploring the right heart, including speckle-tracking and 3D ECHO, may now add better comprehension and evaluation of the RV anatomy and function.4
In all cases, qualitative ECHO parameters are valuable for the prediction of PH and have a similar diagnostic accuracy as the estimation of RV systolic pressure.35
Further research is required before these techniques can become part of regular clinical assessments.
Acknowledgments
We thank all the technicians in the Physiology Department and Fabienne Lebourg for their help in this study. We also thank Pr. Meyer Nicolas and M. Schaeffer Mickael for help with the statistical analysis.
References
- 1.
Galie N, Hoeper MM, Humbert M, Torbicki A, Vachiery JL, Barbera JA, et al. Guidelines for the diagnosis and treatment of pulmonary hypertension: The Task Force for the Diagnosis and Treatment of Pulmonary Hypertension of the European Society of Cardiology (ESC) and the European Respiratory Society (ERS), endorsed by the International Society of Heart and Lung Transplantation (ISHLT). Eur Heart J 2009; 30: 2493–2537.
- 2.
Hoeper MM, Lee SH, Voswinckel R, Palazzini M, Jais X, Marinelli A, et al. Complications of right heart catheterization procedures in patients with pulmonary hypertension in experienced centers. J Am Coll Cardiol 2006; 48: 2546–2552.
- 3.
Champion HC, Michelakis ED, Hassoun PM. Comprehensive invasive and noninvasive approach to the right ventricle-pulmonary circulation unit: State of the art and clinical and research implications. Circulation 2009; 120: 992–1007.
- 4.
D’Alto M, Romeo E, Argiento P, Di Salvo G, Badagliacca R, Cirillo AP, et al. Pulmonary arterial hypertension: The key role of echocardiography. Echocardiography 2014; 32: 23–37.
- 5.
Grunig E, Barner A, Bell M, Claussen M, Dandel M, Dumitrescu D, et al. Non-invasive diagnosis of pulmonary hypertension: ESC/ERS guidelines with updated commentary of the Cologne Consensus Conference 2011. Int J Cardiol 2011; 154(Suppl 1): S3–S12.
- 6.
Karas MG, Kizer JR. Echocardiographic assessment of the right ventricle and associated hemodynamics. Prog Cardiovasc Dis 2012; 55: 144–160.
- 7.
Goda A, Masuyama T. Noninvasive estimation of pulmonary vasculature: Why it is important. Circ J 2015; 79: 2324–2325.
- 8.
Yamabe S, Dohi Y, Fujisaki S, Higashi A, Kinoshita H, Sada Y, et al. Prognostic factors for survival in pulmonary hypertension due to left heart disease. Circ J 2016; 80: 243–249.
- 9.
Janda S, Shahidi N, Gin K, Swiston J. Diagnostic accuracy of echocardiography for pulmonary hypertension: A systematic review and meta-analysis. Heart 2011; 97: 612–622.
- 10.
Gupta H, Ghimire G, Naeije R. The value of tools to assess pulmonary arterial hypertension. Eur Respir Rev 2011; 20: 222–235.
- 11.
Abbas AE, Fortuin FD, Schiller NB, Appleton CP, Moreno CA, Lester SJ. A simple method for noninvasive estimation of pulmonary vascular resistance. J Am Coll Cardiol 2003; 41: 1021–1027.
- 12.
Ristow B, Schiller NB. Obtaining accurate hemodynamics from echocardiography: Achieving independence from right heart catheterization. Curr Opin Cardiol 2010; 25: 437–444.
- 13.
Aduen JF, Castello R, Daniels JT, Diaz JA, Safford RE, Heckman MG, et al. Accuracy and precision of three echocardiographic methods for estimating mean pulmonary artery pressure. Chest 2011; 139: 347–352.
- 14.
Opotowsky AR, Clair M, Afilalo J, Landzberg MJ, Waxman AB, Moko L, et al. A simple echocardiographic method to estimate pulmonary vascular resistance. Am J Cardiol 2013; 112: 873–882.
- 15.
D’Alto M, Romeo E, Argiento P, D’Andrea A, Vanderpool R, Correra A, et al. Accuracy and precision of echocardiography versus right heart catheterization for the assessment of pulmonary hypertension. Int J Cardiol 2013; 168: 4058–4062.
- 16.
Temporelli PL, Scapellato F, Eleuteri E, Imparato A, Giannuzzi P. Doppler echocardiography in advanced systolic heart failure: A noninvasive alternative to Swan-Ganz catheter. Circ Heart Fail 2010; 3: 387–394.
- 17.
Rich JD, Shah SJ, Swamy RS, Kamp A, Rich S. Inaccuracy of Doppler echocardiographic estimates of pulmonary artery pressures in patients with pulmonary hypertension: Implications for clinical practice. Chest 2011; 139: 988–993.
- 18.
Fisher MR, Forfia PR, Chamera E, Housten-Harris T, Champion HC, Girgis RE, et al. Accuracy of Doppler echocardiography in the hemodynamic assessment of pulmonary hypertension. Am J Respir Crit Care Med 2009; 179: 615–621.
- 19.
Farber HW, Foreman AJ, Miller DP, McGoon MD. REVEAL Registry: Correlation of right heart catheterization and echocardiography in patients with pulmonary arterial hypertension. Congest Heart Fail 2011; 17: 56–64.
- 20.
Kanda T, Fujita M, Iida O, Masuda M, Okamoto S, Ishihara T, et al. Novel echocardiographic approach to the accurate measurement of pulmonary vascular resistance based on a theoretical formula in patients with left heart failure: Pilot study. Circ J 2015; 79: 2408–2413.
- 21.
Kasai H, Matsumura A, Sugiura T, Shigeta A, Tanabe N, Yamamoto K, et al. Mean pulmonary artery pressure using echocardiography in chronic thromboembolic pulmonary hypertension. Circ J 2016; 80: 1259–1264.
- 22.
Lang RM, Bierig M, Devereux RB, Flachskampf FA, Foster E, Pellikka PA, et al. Recommendations for chamber quantification: A report from the American Society of Echocardiography’s Guidelines and Standards Committee and the Chamber Quantification Writing Group, developed in conjunction with the European Association of Echocardiography, a branch of the European Society of Cardiology. J Am Soc Echocardiogr 2005; 18: 1440–1463.
- 23.
Rudski LG, Lai WW, Afilalo J, Hua L, Handschumacher MD, Chandrasekaran K, et al. Guidelines for the echocardiographic assessment of the right heart in adults: A report from the American Society of Echocardiography endorsed by the European Association of Echocardiography, a registered branch of the European Society of Cardiology, and the Canadian Society of Echocardiography. J Am Soc Echocardiogr 2010; 23: 685–713; quiz 786–788.
- 24.
Bland JM, Altman DG. Statistical methods for assessing agreement between two methods of clinical measurement. Lancet 1986; 1: 307–310.
- 25.
D’Alonzo GE, Barst RJ, Ayres SM, Bergofsky EH, Brundage BH, Detre KM, et al. Survival in patients with primary pulmonary hypertension: Results from a national prospective registry. Ann Intern Med 1991; 115: 343–349.
- 26.
Saggar R, Sitbon O. Hemodynamics in pulmonary arterial hypertension: Current and future perspectives. Am J Cardiol 2012; 110: 9S–15S.
- 27.
Hoeper MM, Bogaard HJ, Condliffe R, Frantz R, Khanna D, Kurzyna M, et al. Definitions and diagnosis of pulmonary hypertension. J Am Coll Cardiol 2013; 62: D42–D50.
- 28.
Chemla D, Castelain V, Humbert M, Hebert JL, Simonneau G, Lecarpentier Y, et al. New formula for predicting mean pulmonary artery pressure using systolic pulmonary artery pressure. Chest 2004; 126: 1313–1317.
- 29.
Kitabatake A, Inoue M, Asao M, Masuyama T, Tanouchi J, Morita T, et al. Noninvasive evaluation of pulmonary hypertension by a pulsed Doppler technique. Circulation 1983; 68: 302–309.
- 30.
Nagy AI, Venkateshvaran A, Dash PK, Barooah B, Merkely B, Winter R, et al. The pulmonary capillary wedge pressure accurately reflects both normal and elevated left atrial pressure. Am Heart J 2014; 167: 876–883.
- 31.
Nagueh SF, Middleton KJ, Kopelen HA, Zoghbi WA, Quinones MA. Doppler tissue imaging: A noninvasive technique for evaluation of left ventricular relaxation and estimation of filling pressures. J Am Coll Cardiol 1997; 30: 1527–1533.
- 32.
Warburton DE, Haykowsky MJ, Quinney HA, Humen DP, Teo KK. Reliability and validity of measures of cardiac output during incremental to maximal aerobic exercise. Part II: Novel techniques and new advances. Sports Med 1999; 27: 241–260.
- 33.
Kouzu H, Nakatani S, Kyotani S, Kanzaki H, Nakanishi N, Kitakaze M. Noninvasive estimation of pulmonary vascular resistance by Doppler echocardiography in patients with pulmonary arterial hypertension. Am J Cardiol 2009; 103: 872–876.
- 34.
Rajagopalan N, Simon MA, Suffoletto MS, Shah H, Edelman K, Mathier MA, et al. Noninvasive estimation of pulmonary vascular resistance in pulmonary hypertension. Echocardiography 2009; 26: 489–494.
- 35.
Lange TJ, Baumgartner S, Arzt M, Pfeifer M. Qualitative echocardiography parameters for prediction of pulmonary hypertension. Int J Clin Pract Suppl 2013; (179): 5–12.
- 36.
Beigel R, Cercek B, Luo H, Siegel RJ. Noninvasive evaluation of right atrial pressure. J Am Soc Echocardiogr 2013; 26: 1033–1042.
- 37.
Nageh MF, Kopelen HA, Zoghbi WA, Quinones MA, Nagueh SF. Estimation of mean right atrial pressure using tissue Doppler imaging. Am J Cardiol 1999; 84: 1448–1451, A1448.
- 38.
Dabestani A, Mahan G, Gardin JM, Takenaka K, Burn C, Allfie A, et al. Evaluation of pulmonary artery pressure and resistance by pulsed Doppler echocardiography. Am J Cardiol 1987; 59: 662–668.
- 39.
Rosenkranz S, Ghofrani HA, Grunig E, Hoeper MM. Cologne Consensus Conference on pulmonary hypertension. Int J Cardiol 2011; 154(Suppl 1): S1–S2.