Abstract
Background:
Percutaneous transluminal renal angioplasty (PTRA) improves patency in atherosclerotic renal artery stenosis (ARAS), but improvement in clinic blood pressure (BP) is seen in only 20–40% of patients who undergo PTRA. This study investigated the effects of PTRA on BP lowering, assessed on 24-h ambulatory BP monitoring (ABPM), and identified preoperative features predictive of satisfactory BP improvement after PTRA.
Methods and Results:
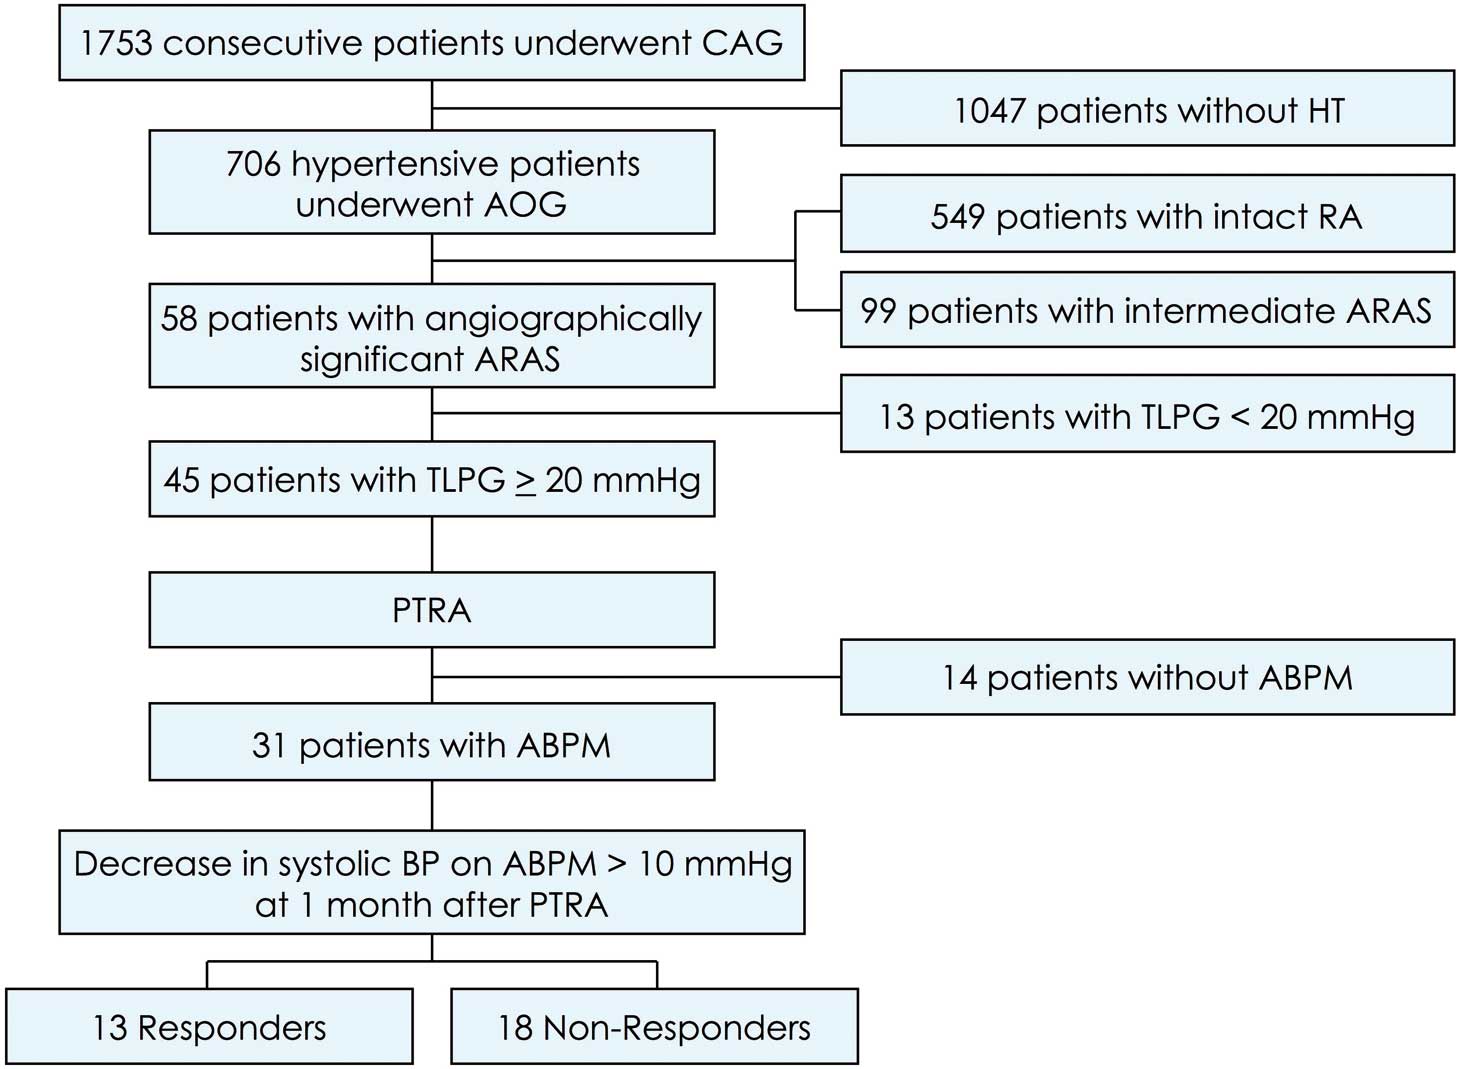
Of 1,753 consecutive patients undergoing coronary angiography, 31 patients with angiographically significant ARAS and translesional pressure gradient (TLPG) >20 mmHg underwent PTRA. ABPM was performed before, at 1 month and at 1 year after PTRA; patients with average systolic ABPM-BP decrease >10 mmHg at 1 month from baseline were categorized as responders. There was no obvious relationship between clinic BP and ABPM-BP at baseline. ABPM-BP was significantly higher in responders at baseline (SBP: 148 vs. 126 mmHg, P<0.01) and was improved 1 month after PTRA. This difference persisted until 1 year after PTRA. Night-time BP improved more than daytime BP in responders. Patients with higher baseline ABPM-BP achieved a larger decrease in ABPM-BP, but the severity of stenosis reflected by TLPG; renal duplex findings; and neurohumoral parameters other than baseline renal function, did not differ between the groups.
Conclusions:
Clinic BP does not represent daily hemodynamic status, whereas high ABPM-BP is a potent predictor of satisfactory BP response to PTRA. (Circ J 2016; 80: 1922–1930)
High blood pressure (BP) is the most potent risk factor for cardiovascular diseases, which include stroke, coronary artery disease (CAD), heart failure, chronic kidney disease (CKD), and peripheral artery disease (PAD).1
A reduction of 20 mmHg in systolic BP (SBP) or 10 mmHg in diastolic BP (DBP) is associated with a more than twofold difference in mortality due to stroke and ischemic heart disease.2
Despite several decades’ sustained efforts towards better BP control, the prevalence of hypertension continues to increase.3
Editorial p 1898
One of the secondary etiologies of hypertension is renovascular hypertension, which occurs in 1–5% of hypertensive patients4,5
and frequently accompanies CAD and PAD.6,7
Atherosclerotic renal artery stenosis (ARAS) leads to renal parenchymal ischemia and renin-angiotensin-aldosterone system (RAAS) activation. Since the late 1990 s, renal angioplasty has been a promising option for treating refractory hypertension caused by ARAS. This intervention improves renal artery patency, but reduction in clinic BP is achieved in only 20–40% of patients who undergo percutaneous transluminal renal angioplasty (PTRA).8,9
Even in the stent era, the ASTRAL trial showed no significant advantages, in either the short or long term, for PTRA over medication alone in terms of BP and renal function.10
Moreover, recent large clinical trials were unable to demonstrate a beneficial clinical effect of renal artery stenting on major events in the heart, kidney, or brain.11,12
‘Overdiagnosis’ of the degree of ARAS is probably the main cause of the unsatisfactory results of PTRA.13
In contrast, the CORAL, HERACULES, and J-RAS trials, which included a limited number of patients, reported that a sufficient reduction in BP could be anticipated provided that real candidates for PTRA were identified by aggregating evidence.11,14,15
They suggest that revascularization to improve renal blood flow still remains an essential therapy for high-risk patients with severe ARAS.16
Among treated or untreated patients with hypertension, 24-h ambulatory BP monitoring (ABPM) has been reported to be a significantly better predictor of cardiovascular and cerebrovascular events than clinic BP.17–19
Moreover, nocturnal hypertension has been reported to best correspond with long-term cardiovascular events.20,21
Therefore, BP kinetics should be assessed mainly on the basis of diurnal variation. To date, however, reports of BP evaluation using 24-h monitoring after PTRA are limited.22–25
The aim of this study was therefore to identify the preoperative features predictive of satisfactory BP response to PTRA, on 24-h ABPM.
Methods
Subjects
This study evaluated 1,753 consecutive patients who underwent coronary angiography (CAG), presenting with acute coronary syndrome, stable angina, chest pain of uncertain origin, markedly positive stress test or coronary calcification on computed tomography, in a single cardiovascular center between January 2011 and December 2013. Patients with hypertension were followed using abdominal aortography for etiological screening. In all patients who had angiographically significant ARAS, the translesional pressure gradient (TLPG) was measured using a pressure guidewire (Pressure Wire Certus, St. Jude Medical) under hyperemic conditions induced by 30 mg intra-arterial papaverine in the renal artery. Forty-five patients with refractory hypertension and TLPG >20 mmHg underwent staged PTRA.25–29
Of these, 31 patients who had 24-h ABPM recordings were prospectively enrolled and analyzed. The study protocol was approved by the hospital ethics committee. All participants provided written informed consent. Patient enrollment was carried out according to the principles of the Declaration of Helsinki.
Treatment Protocols and Definitions
PTRA was scheduled for patients who had proven angiographic and functional stenosis in the renal artery and refractory hypertension, provided that none of the following exclusion criteria applied: (1) maintenance hemodialysis, (2) active bleeding, or (3) chronic total occlusion of the target renal artery. In patients with bilateral ARAS, the procedural and duplex ultrasound parameters of the more severe side were included in the analysis.
For the PTRA procedure, a 6-Fr guiding catheter (JR4 or MPA1, Cordis, USA) was engaged in the ostium of the target renal artery via a 6-Fr sheath in the left brachial artery or the common femoral artery on either side. A guidewire was advanced to the stenotic lesion through the renal artery, followed by intravascular ultrasound (IVUS; iLab; Boston Scientific, USA) in all cases. In most cases, balloon angioplasty was performed before stenting. An Express SD stent (Boston Scientific) or Palmaz Genesis stent (Cordis) was selected for implantation. Stent apposition was verified on IVUS and a larger-size balloon was used if incomplete apposition was observed.
Patients were selected for PTRA due to the combination of persistent hypertension documented at least 3 times on different clinic visits and TLPG >20 mmHg at hyperemic condition. Hypertension was diagnosed in the presence of SBP >140 mmHg and/or DBP >90 mmHg on ≥2 anti-hypertensive medications.10,25,30,31
Daytime BP was defined as the average BP from 09.00 hours to 21.00 hours, and night-time BP as the average BP from 01.00 hours to 06.00 hours, corresponding to the actual waking and sleeping BP.32
Night-time/daytime SBP ratio was calculated from these values.20,21
On the 24-h BP recording with ABPM, the average drop in night-time SBP (%) was calculated as (1–[night-time SBP/daytime SBP])×100%. On this basis, patients were classified as follows: drop <0% (ie, increase), reverse-dipper type; 0–10%, non-dipper type; 10–20%, dipper type; and >20%, extreme-dipper hypertension.1
Angiographic diameter stenosis ≥75% on visual estimation by 2 independent cardiologists was defined as significant, and 50–75% as intermediate.
Data Collection
ABPM-BP was recorded using a well-validated automatic ABPM device (TM-2431; A&D, Saitama, Japan) every 30 min for 24 h and was performed on an outpatient basis, before, at 1 month and at 1 year after PTRA. Clinic BP was measured using sphygmomanometer in the hospital office, and the mean of 2 successive SBP and DBP measurements was recorded on the day that the patient was provided with the ABPM device. Patients who underwent PTRA were categorized as responders if they had an average decrease in ABPM-SBP from baseline >10 mmHg at 1 month after PTRA.33
Clinic BP, renal duplex parameters (peak systolic velocity [PSV] of renal blood flow, renal/aortic PSV ratio, acceleration time, and resistive index), as well as laboratory data (serum creatinine, estimated glomerular filtration rate [eGFR], and creatinine clearance for renal function; plasma renin activity [PRA], plasma aldosterone concentration [PAC], and brain natriuretic peptide [BNP] as neurohumoral factors) were evaluated before PTRA. The IVUS findings during PTRA were recorded for assessment of the degree of stenosis by 2 independent cardiologists. All parameters were compared retrospectively between responders and non-responders.
Statistical Analysis
Data are given as mean±SD and percentiles, or mean±SE. Independent Student’s t-test or the non-parametric equivalent Mann-Whitney U-test was used to compare continuous parameters between responders and non-responders. Fisher’s exact test was used to evaluate categorical variables. Chi-squared test was used to compare the prevalence of CAD and PAD among 3 groups, and Fisher’s exact test followed by Bonferroni correction was used to directly compare 2 out of 3 groups. Comparisons among consecutive samples from 2 groups were evaluated on multiple t-test using the Holm-Sidak method. One-way ANOVA with the Greenhouse-Geisser correction was used for comparisons of consecutive samples with baseline. Linear regression analysis was performed to test for correlation coefficients between clinic BP and ABPM-BP, and between baseline ABPM-BP and change in ABPM-BP. Propensity score matching was applied to compare clinic and ABPM-BP before and up to 1 year after PTRA between responders and non-responders. First, we performed a logistic regression to score all patients, using as covariates use of β-blockers and diuretics at 1 year after PTRA. Second, the macro searched and selected the best match of responders and non-responders according to the absolute value of the difference between the propensity score. Analyses were then performed on the 2 matched groups, stratified by pairs to account for propensity score matching. Two-sided P<0.05 was considered statistically significant. With regard to the statistical power of the difference in ABPM-BP at baseline between responders and non-responders as the primary finding, 2-tailed post-hoc analysis was performed with 0.05 α-error.
Results
The patient selection procedure is shown in
Figure 1. Of the hypertensive patients who underwent CAG, 6.4% had significant ARAS on at least 1 side. Bilateral ARAS was present in 29% of enrolled patients (5 responders and 4 non-responders; P=0.33). Finally, of the 31 patients who underwent PTRA and ABPM, 13 were categorized as responders. All 31 patients underwent elective PTRA under stable systemic conditions. Among them, 23 patients had coronary stenting, and 1 patient had CABG and stenting.
Comorbidities
Of the hypertensive patients in this study, 60% had CAD, 21% PAD, and 16% both (Figures S1A–C). According to ARAS severity, patients with angiographically significant or intermediate stenosis had a significantly higher rate of comorbidity with CAD and PAD compared with patients with intact renal arteries (Figures 1D–F).
Baseline Characteristics and Procedural Parameters
Baseline patient characteristics are listed in
Table 1. Patients were typically elderly (average age, 75 years) with normal body mass index and diverse comorbidities, including hypertension, diabetes, CAD, CKD, and fatty acid profiles. Responders and non-responders were no statistically significantly different in any parameter except those related to renal function. Baseline renal function, measured on serum creatinine, eGFR, and creatinine clearance, was significantly poorer in responders. More than 90% of responders had CKD worse than grade 3, and their average was 1.6-fold higher than that of non-responders (P=0.026;
Table 1). Neither group had improved renal function after PTRA (Figure S2). In addition, procedure-related acute kidney injury (defined as a >0.3-mg/dl increase in serum creatinine) appeared in 3 cases (9.7%; P=NS between the groups). Potassium concentration was significantly higher in responders (P<0.01). No patient had LVEF <40%, and only 1 non-responder was diagnosed with heart failure with preserved EF.
Table 1.
Patient Characteristics
| Variables |
Overall
(n=31) |
Responders
(n=13) |
Non-responders
(n=18) |
P-value |
| Age (years) |
75±7 |
76±7 |
75±8 |
0.57 |
| >75 years |
18 (58) |
9 (69) |
9 (50) |
0.46 |
| Male |
22 (71) |
11 (85) |
11 (61) |
0.24 |
| BMI (kg/m2) |
24±3 |
23±3 |
25±4 |
0.33 |
| Obesity* |
9 (29) |
2 (15) |
7 (39) |
0.24 |
| Diabetes |
9 (29) |
4 (31) |
5 (28) |
>0.99 |
| Dyslipidemia |
19 (61) |
7 (54) |
12 (67) |
0.71 |
| Current smoker |
11 (35) |
5 (38) |
6 (33) |
>0.99 |
| CKD grade 3–5† |
22 (71) |
12 (92) |
10 (56) |
0.045 |
| Coronary artery disease |
28 (90) |
11 (85) |
17 (94) |
0.56 |
| Peripheral arterial disease |
18 (58) |
9 (69) |
9 (50) |
0.46 |
| Prior MI |
9 (29) |
2 (15) |
7 (39) |
0.24 |
| Prior PCI |
23 (74) |
9 (69) |
14 (78) |
0.69 |
| Prior CABG |
7 (23) |
2 (15) |
5 (28) |
0.67 |
| Heart failure |
5 (16) |
1 (8) |
4 (22) |
0.37 |
| Atrial fibrillation |
1 (3) |
0 (0) |
1 (6) |
– |
| Laboratory data |
| Hemoglobin (g/dl) |
11.9±1.7 |
11.8±1.6 |
12.0±1.7 |
0.83 |
| Total cholesterol (mg/dl) |
159±30 |
151±30 |
165±30 |
0.18 |
| LDL-C (mg/dl) |
82±21 |
77±22 |
85±21 |
0.48 |
| LDL-C/HDL-C |
1.72±0.52 |
1.56±0.50 |
1.83±0.52 |
0.21 |
| HbA1c (%) |
6.1±1.0 |
5.9±1.0 |
6.2±1.0 |
0.36 |
| CRP (mg/L) |
0.42±0.64 |
0.31±0.39 |
0.51±0.78 |
0.64 |
| Serum creatinine (mg/dl) |
1.18±0.55 |
1.45±0.68 |
0.99±0.34 |
0.035 |
| eGFR (ml/min/1.73 m2) |
46.9±23.3 |
36.2±19.3 |
54.6±23.4 |
0.017 |
| Creatinine clearance (ml/min) |
52.0±26.4 |
39.1±15.4 |
61.4±29.0 |
0.017 |
| Sodium (mEq/L) |
140±4 |
139±6 |
141±3 |
0.94 |
| Potassium (mEq/L) |
4.2±0.4 |
4.4±0.4 |
4.1±0.4 |
<0.01 |
| EPA/AA |
0.34±0.26 |
0.29±0.28 |
0.37±0.25 |
0.17 |
| Clinic BP at baseline (mmHg) |
| SBP |
146±18 |
149±18 |
144±18 |
0.52 |
| DBP |
77±14 |
75±10 |
78±16 |
0.98 |
| Mean |
100±12 |
99±7 |
100±14 |
0.54 |
| ABPM-BP at baseline (mmHg) |
| SBP |
135±17 |
148±11 |
126±16 |
<0.01 |
| DBP |
74±9 |
81±7 |
70±8 |
<0.01 |
| Mean |
94±11 |
103±7 |
89±10 |
<0.01 |
| Daytime SBP (mmHg) |
138±16 |
147±10 |
132±16 |
0.014 |
| Night-time SBP (mmHg) |
132±25 |
150±18 |
120±22 |
<0.01 |
| Night-time/Daytime SBP |
0.96±0.15 |
1.02±0.15 |
0.91±0.14 |
0.048 |
| FMD (%) |
3.1±1.4 |
2.5±1.5 |
3.5±1.2 |
0.10 |
Data given as mean±SD or n (%). *BMI >25 kg/m2; †eGFR <60 ml/min/1.73 m2. AA, arachidonic acid; ABPM, ambulatory blood pressure monitoring; BMI, body mass index; BP, blood pressure; CABG, coronary artery bypass grafting; CKD, chronic kidney disease; CRP, C-reactive protein; DBP, diastolic blood pressure; eGFR, estimated glomerular filtration rate; EPA, eicosapentaenoic acid; FMD, flow mediated dilation; HbA1c, hemoglobin A1c; HDL-C, high-density lipoprotein cholesterol; LDL-C, low-density lipoprotein cholesterol; MI, myocardial infarction; PCI , percutaneous coronary intervention; SBP, systolic blood pressure.
There was no significant difference in anti-hypertensive medications at PTRA. A lower proportion of responders took β-blockers than non-responders (Table 2). At 1 year after PTRA, the need for anti-hypertensive medication did not differ significantly between the groups (Table S1), whereas the difference in β-blocker prevalence was significant (17% vs. 63%, P=0.024).
Table 2.
Oral Medication at Discharge
| Variables |
Overall
(n=31) |
Responders
(n=13) |
Non-responders
(n=18) |
P-value |
| Anti-hypertensives |
2.6±0.9 |
2.5±0.9 |
2.7±0.9 |
0.44 |
| Diuretics |
12 (39) |
5 (39) |
7 (39) |
>0.99 |
| β-blocker |
11 (35) |
2 (15) |
9 (50) |
0.07 |
| CCB |
26 (84) |
12 (92) |
14 (78) |
0.37 |
| ACEI/ARB |
27 (87) |
11 (85) |
16 (89) |
>0.99 |
| Direct renin inhibitor |
1 (3) |
0 (0) |
1 (6) |
– |
| α-blocker |
1 (3) |
1 (8) |
0 (0) |
– |
| Statin |
15 (48) |
6 (46) |
9 (50) |
>0.99 |
| EPA |
2 (6) |
1 (8) |
1 (6) |
>0.99 |
Data given as mean±SD or n (%). ACEI, angiotensin-converting enzyme inhibitor; ARB, angiotensin II receptor blocker; CCB, calcium channel blocker; EPA, eicosapentaenoic acid.
All lesions were de novo, but not restenotic. Almost all lesions (94%) were treated with balloon angioplasty before stenting, and stents with an average size of 5.2×18 mm were implanted. The exception was 1 responder who underwent only balloon angioplasty. The rate of pre-dilation, average stent size, and contrast volume did not differ significantly between the groups (Table 3). Of the IVUS parameters during PTRA, target lesion length, reference vessel area, final minimum stent area, degree of area stenosis, and acute area gain did not differ between the groups (Table 3).
Table 3.
PTRA Parameters
| Variables |
Overall
(n=31) |
Responders
(n=13) |
Non-responders
(n=18) |
P-value |
| Angiographic findings |
| De novo lesions |
31 (100) |
13 (100) |
18 (100) |
– |
| Bilateral lesions |
9 (29) |
5 (38) |
4 (22) |
0.43 |
| Pre-dilation |
29 (94) |
13 (100) |
16 (89) |
0.50 |
| Stent diameter (mm) |
5.2±0.6 |
5.0±0.5 |
5.3±0.6 |
0.11 |
| Stent length (mm) |
17.9±5.4 |
17.4±5.3 |
18.2±5.6 |
0.57 |
| Post-dilation |
5 (16) |
3 (23) |
2 (11) |
0.63 |
| Maximum inflation pressure (atm) |
11.6±3.2 |
11.5±4.5 |
11.6±1.9 |
0.14 |
| Contrast use (ml) |
116±71 |
130±84 |
106±62 |
0.63 |
| IVUS parameters |
| Lesion length (mm) |
12.4±5.5 |
10.7±4.0 |
13.5±6.2 |
0.36 |
| Reference vessel area (mm2) |
26.4±9.8 |
25.9±12.7 |
26.7±8.0 |
0.70 |
| Minimal lumen area (mm2) |
6.2±2.8 |
6.7±3.4 |
5.9±2.4 |
0.68 |
| % Area stenosis (%) |
75.2±11.1 |
71.0±15.5 |
77.9±6.6 |
0.46 |
| Final minimum stent area (mm2) |
19.5±5.1 |
19.8±5.0 |
19.2±5.3 |
0.92 |
| Acute gain (mm2) |
13.3±5.2 |
13.2±6.6 |
13.3±4.3 |
0.85 |
Data given as mean±SD or n (%). IVUS, intravascular ultrasound; PTRA, percutaneous transluminal renal angioplasty.
We investigated the relationship between clinic BP and ABPM-BP before PTRA (Figure 2). Only DBP showed a modest correlation (r=0.44), but there was no obvious overall correlation between baseline clinic BP and ABPM-BP.
For the entire subject group, ABPM-BP did not show a significant decrease in SBP, DBP, or mean BP after PTRA (Figure S3). ABPM-BP was significantly higher in responders at baseline (SBP: P<0.01), and decreased only in responders at 1 month after PTRA, and was preserved up to 1 year. Non-responders had no significant change in ABPM-BM during the observation period (Figure 3).
In contrast, clinic BP was similar between responders and non-responders at baseline, and was significantly lower in responders at 1 month after PTRA (Figure S4). Clinic BP at 1 year, however, was not significantly different between the groups, even though a significant reduction in clinic SBP from baseline remained in the responders.
Daytime and Night-Time BP
SBP decreased after PTRA in responders only during night-time, and the reduction in night-time SBP was maintained up to 1 year after PTRA (Figure 4A). In contrast, in non-responders, neither daytime nor night-time SBP decreased after PTRA (Figure 4B). At baseline, daytime and night-time SBP were similar in responders, whereas daytime BP was higher than night-time SBP in non-responders, although the difference was not statistically significant (Figures 4A,B). Consistent with these findings, the ratio of night-time/daytime SBP was significantly higher in responders at baseline, but the significance disappeared at 1 month after PTRA (Figure 4C). Night-time/daytime SBP significantly decreased after PTRA only in responders.

Patients were classified into 4 groups according to drop in night-time SBP. Responders included fewer normal dipper types at baseline, compared with non-responders (8% vs. 33%,
Figure 4D). The number of patients with dipper-type BP increased at 1 month only in responders, and this improvement in type persisted until 1 year after PTRA. In contrast, PTRA did not affect BP type at any time point after PTRA. Collectively, PTRA decreased night-time BP and improved hypertension types in responders.
PTRA Response Profile
The relationship between baseline BP and change in ABPM-BP is shown in
Figure S5. There was a significant negative correlation between baseline ABPM-BP and change in ABPM-BP. Higher baseline ABPM-BP was associated with a larger decrease in ABPM-BP after PTRA. On Pearson’s correlation analysis, patients with >10-mmHg decrease in ABPM-SBP had a baseline >147 mmHg (Figure S5A). Additionally, on receiver operating characteristic analysis of baseline ABPM-BP between responders and non-responders, area under the curve was 0.86 (P<0.001;
Figure S6).
In contrast, baseline hyperemic TLPG evaluated on pressure wire was not significantly different between the groups (Table 4). None of the 4 parameters from renal duplex ultrasound before PTRA was statistically significantly different between the groups (Table 4). Neurohumoral factors PRA, PAC, PAC/PRA ratio, and BNP at baseline also did not differ between the groups (Table 4). PAC was decreased in responders after PTRA; conversely, it was increased in non-responders. The difference between the groups, however, did not reach statistical significance in this small study (Figure S7). Reference values for
Table 4
are listed in
Table S2.
Table 4.
Baseline Parameters Associated With Renal Artery Stenosis
| Variables |
Overall
(n=31) |
Responders
(n=13) |
Non-responders
(n=18) |
P-value |
| TLPG (mmHg) |
49±26 |
53±34 |
45±20 |
0.94 |
| Duplex parameters |
| Peak systolic velocity (cm/s) |
203±90 |
211±88 |
198±93 |
>0.99 |
| Renal/Aortic ratio |
3.5±1.7 |
3.6±1.6 |
3.5±1.9 |
0.84 |
| Acceleration time (ms) |
86±25 |
76±20 |
91±27 |
0.30 |
| Resistive index |
0.82±0.09 |
0.83±0.08 |
0.82±0.09 |
0.86 |
| Neurohumoral parameters |
| PRA (ng/ml/h) |
3.1±4.7 |
3.8±5.0 |
2.6±4.6 |
0.30 |
| PAC (pg/ml) |
67±34 |
77±27 |
60±38 |
0.17 |
| PAC/PRA |
76±110 |
68±90 |
81±126 |
0.53 |
| BNP (pg/ml) |
131±157 |
83±75 |
165±192 |
0.41 |
Data given as mean±SD. BNP, brain natriuretic peptide; eGFR, estimated glomerular filtration rate; PAC, plasma aldosterone concentration; Renal/Aortic ratio, the ratio of the PSV in the renal artery to the PSV in the aorta; PRA, plasma renin activity; TLPG, translesional pressure gradient.
A higher proportion of responders received β-blockers and diuretics than non-responders. Even after propensity score matching with β-blockers and diuretics as covariates at 1 year after PTRA, however, BP kinetics up to 1 year in both groups were similar to the non-background-matched group (Table S3;
Figure S8). Collectively, high baseline ABPM-BP predicted satisfactory BP response to PTRA, whereas ARAS severity and neurohumoral factors did not.
Discussion
This study evaluated the BP response to PTRA on ABPM in patients with functionally significant ARAS. Elective PTRA was carried out in hypertensive patients with ARAS and TLPG >20 mmHg. Responders had higher baseline BP on ABPM and impaired renal function compared with non-responders, but neither clinic baseline BP, degree of stenosis nor neurohumoral parameters significantly affected the BP response to PTRA.
Clinic and ABPM BP
Although most of the evidence for the prognostic value of ABPM comes from untreated hypertensive patients, a recent study provided considerable evidence that ABPM-BP recorded under medical treatment was also a potent determinant of subsequent cardiovascular events.17
Evaluating the relationships between clinic BP and ABPM-BP at baseline, we found only a weak association for DBP. Although clinic BP was similar between responders and non-responders before PTRA, responders had >20 mmHg higher ABPM-BP than non-responders at baseline. Additionally, a BP-lowering effect in all ABPM-BP parameters persisted for ≥1 year after PTRA in responders. In contrast, responders had clinic BP reduction only at 1 month after PTRA, and significance in DBP and mean clinic BP disappeared at 1 year. Therefore, spot BP in the clinic does not represent daily hemodynamics and would not be able to identify real candidates for PTRA.
Night-Time BP
Baseline prevalence of hypertension type differed between responders and non-responders. On ABPM evaluation, responders included fewer normal dipper hypertension types than did non-responders, while PTRA clearly reduced night-time BP in responders, modifying hypertension type. Night-time BP better corresponds to increase in cardiovascular events than daytime BP in hypertensive patients.21,34
Additionally, night-time/daytime BP ratio predicts mortality, even after adjustment for 24-h BP.21
PTRA may improve long-term clinical prognosis in responders via improvement of high night-time/daytime BP ratio, possibly through the suppression of nocturnal activation of the sympathetic nervous system such as β-blockers. The real candidates for PTRA are not those with transient high clinic BP, but those with persistent high BP, especially at night-time. Therefore, ABPM should be performed before PTRA, so that diurnal variation may be assessed in a way that can predict the BP-lowering effect.
Predictors of Sufficient BP Response to PTRA
The parameter most representative of >20 mmHg TLPG was PSV on renal duplex ultrasound,35
in that PSV cut-off of 219 cm/s gave a correlation coefficient between TLPG and PSV as high as 0.74. Only a well-trained sonographer can produce reliable results on renal duplex tests. Moreover, if a stenosis is located in the mid-distal portion of the renal artery stem, rather than in the ostial region, exact detection of target blood flow is difficult even for experts. This may explain why the degree of ARAS is misestimated or undetectable on renal duplex evaluation in some cases. The present results, however, suggest that a more easily detectable parameter for sufficient achievement of BP reduction after PTRA is baseline BP measured on ABPM, rather than the anatomical severity of renal artery stenosis. Not only clinic BP but also ABPM-BP depends on patient condition, given that some patients with lower ABPM-BP at baseline had increased ABPM-BP after PTRA. Compared with other factors affecting BP, high ABPM-BP at baseline had a significant trend toward greater decrease after PTRA. The present sample size was small, but the calculated statistical power of baseline ABPM-BP was sufficient at 0.929 (Figure S9). Most parameters related to stenosis degree, as opposed to renal function, were not statistically significantly different between the groups. This may be due to the present small sample size, although those parameters varied among patients with large standard deviations, indicating that they were insensitive and unreliable predictors. This suggests that non-responders had ARAS, but did not have renovascular hypertension. Renovascular hypertension can be better derived from functional status rather than anatomical status. In terms of oral medications, only β-blocker had a tendency to be administered more frequently in non-responders, and this became significant 1 year after PTRA. Non-responder group consisted of patients with younger age, lower prevalence of PAD, and higher prevalence of heart failure, although these parameters were not significantly different from responders group, suggesting higher tolerability for β-blocker in non-responders than responders. Considering that β-blocker decreases renovascular resistance and prevents reduction in renal blood flow in hypertensive patients with renal insufficiency,36
hypertension in patients with RAS with contraindications to β-blockers may require mechanical intervention.
Renal Function and Neurohumoral Parameters
Chronic ischemia in the kidney medulla prompts the release of neurohumoral agents, while ischemic-damaged organs are considered to be hibernating, and have the potential for the damage to be reversed.37,38
Renovascular hypertension usually presents with low serum potassium due to high aldosterone concentration. In contrast, higher serum potassium concentration before PTRA may reflect more severe ischemic damage to the renal parenchyma in responders. Additionally, none of the neurohumoral factors at baseline affected BP kinetics. One of the possible reasons is that the combination of anti-RAAS medications at baseline may have already modified patient status, given the prevalence of angiotensin-converting enzyme inhibitors or angiotensin receptor blockers of nearly 90% in both groups. The severity of renal parenchymal ischemia could be associated with the efficacy of BP lowering after PTRA, but PTRA had no beneficial effect on renal function in either responders or non-responders.
Study Limitations
We tested small numbers of candidates within a limited observation period; therefore, it was difficult to clarify conclusively whether any of the TLPG, IVUS, renal duplex, or neurohumoral parameters had a significant relationship with the BP-lowering effect of PTRA. We could claim only that baseline ABPM-BP was a sensitive and potent predictor of sufficient response to PTRA, and larger scale studies with a longer observation period are required to confirming the present findings. Second, we used clinic BP recorded on the day of ABPM-BP monitoring; therefore even patients who had met the criteria of refractory hypertension may occasionally have had normal clinic BP after antihypertensive drug treatment. Third, patients with angiographically intermediate ARAS were not tested for TLPG to determine functional severity. Fourth, because there was no evidence of the patency of the deployed stent in the chronic phase, it is still unknown whether renal artery patency affects BP kinetics after PTRA. Finally, the relatively low number of oral anti-hypertensives and the low prevalence of diuretics/β-blockers and high prevalence of calcium-channel blocker may have affected the results.
Conclusions
Clinic BP did not represent the daily hemodynamic status of hypertensive patients, while high 24-h BP was a potent predictor of satisfactory BP response to PTRA. These findings may help clinicians to optimize the cost-benefit profile of PTRA and reduce unnecessary interventions.
Acknowledgment
We would like to thank Editage (www.editage.jp) for English language editing.
Sources of Funding
Not applicable.
Disclosure
The authors declare no conflicts of interest.
Grants
This study was not financially supported by any company, grant, or fund, and none of the authors has any conflict of interest.
The study was registered at University Hospital Medical Information Network Clinical Trials Registry (UMIN-CTR) with the identifier UMIN000017110. (http://www.umin.ac.jp/ctr/index.htm)
Supplementary Files
Supplementary File 1
Supplementary Material
Figure S1.
Coexistence of coronary artery disease (CAD) and peripheral artery disease (PAD) in patients with (A–C) hypertension and (D–F) hypertensive patients according to angiographic atherosclerotic renal artery stenosis severity.
Figure S2.
Kinetics of renal functions.
Figure S3.
(A) Systolic, (B) diastolic and (C) mean 24-h ambulatory blood pressure monitoring (ABPM) blood pressure (BP) at baseline, 1 month and 1 year after percutaneous transluminal renal angioplasty for the whole subject group.
Figure S4.
(A) Systolic, (B) diastolic and (C) mean clinic blood pressure (BP) at baseline, 1 month and 1 year after percutaneous transluminal renal angioplasty vs. response.
Figure S5.
Baseline vs. change in (A) systolic, (B) diastolic and (C) mean 24-h ambulatory blood pressure monitoring (ABPM) blood pressure (BP) 1 month after percutaneous transluminal renal angioplasty.
Figure S6.
Receiver operating characteristic (ROC) curve for baseline 24-h ambulatory blood pressure monitoring (ABPM) blood pressure (BP; 13 responders and 18 non-responders).
Figure S7.
Kinetics of neurohumoral parameters.
Figure S8.
Blood pressure (BP) kinetics after propensity score matching.
Figure S9.
Statistical power vs. sample size.
Table S1.
Oral medications at 1 year after PTRA
Table S2.
Reference values for Table 4
Table S3.
Patient characteristics after propensity score matching
Please find supplementary file(s);
http://dx.doi.org/10.1253/circj.CJ-16-0347
References
- 1.
Kario K. Morning surge in blood pressure and cardiovascular risk: Evidence and perspectives. Hypertension 2010; 56: 765–773.
- 2.
Lewington S, Clarke R, Qizilbash N, Peto R, Collins R; Prospective Studies Collaboration. Age-specific relevance of usual blood pressure to vascular mortality: A meta-analysis of individual data for one million adults in 61 prospective studies. Lancet 2002; 360: 1903–1913.
- 3.
Lenfant C, Chobanian AV, Jones DW, Roccella EJ; Joint National Committee on the Prevention, Detection, Evaluation, and Treatment of High Blood Pressure. Seventh report of the Joint National Committee on the Prevention, Detection, Evaluation, and Treatment of High Blood Pressure (JNC 7): Resetting the hypertension sails. Hypertension 2003; 41: 1178–1179.
- 4.
Derkx FH, Schalekamp MA. Renal artery stenosis and hypertension. Lancet 1994; 344: 237–239.
- 5.
Ram CV. Renovascular hypertension. Curr Opin Nephrol Hypertens 1997; 6: 575–579.
- 6.
Olin JW, Melia M, Young JR, Graor RA, Risius B. Prevalence of atherosclerotic renal artery stenosis in patients with atherosclerosis elsewhere. Am J Med 1990; 88: 46N–51N.
- 7.
Harding MB, Smith LR, Himmelstein SI, Harrison K, Phillips HR, Schwab SJ, et al. Renal artery stenosis: Prevalence and associated risk factors in patients undergoing routine cardiac catheterization. J Am Soc Nephrol 1992; 2: 1608–1616.
- 8.
Dorros G, Jaff M, Mathiak L, Dorros II, Lowe A, Murphy K, et al. Four-year follow-up of Palmaz-Schatz stent revascularization as treatment for atherosclerotic renal artery stenosis. Circulation 1998; 98: 642–647.
- 9.
Ramsay LE, Waller PC. Blood pressure response to percutaneous transluminal angioplasty for renovascular hypertension: An overview of published series. BMJ 1990; 300: 569–572.
- 10.
ASTRAL Investigators, Wheatley K, Ives N, Gray R, Kalra PA, Moss JG, Baigent C, et al. Revascularization versus medical therapy for renal-artery stenosis. N Engl J Med 2009; 361: 1953–1962.
- 11.
Cooper CJ, Murphy TP, Cutlip DE, Jamerson K, Henrich W, Reid DM, et al. Stenting and medical therapy for atherosclerotic renal-artery stenosis. N Engl J Med 2014; 370: 13–22.
- 12.
Bax L, Woittiez AJ, Kouwenberg HJ, Mali WP, Buskens E, Beek FJ, et al. Stent placement in patients with atherosclerotic renal artery stenosis and impaired renal function: A randomized trial. Ann Intern Med 2009; 150: 840–848.
- 13.
Drieghe B, Madaric J, Sarno G, Manoharan G, Bartunek J, Heyndrickx GR, et al. Assessment of renal artery stenosis: Side-by-side comparison of angiography and duplex ultrasound with pressure gradient measurements. Eur Heart J 2008; 29: 517–524.
- 14.
Jaff MR, Bates M, Sullivan T, Popma J, Gao X, Zaugg M, et al. Significant reduction in systolic blood pressure following renal artery stenting in patients with uncontrolled hypertension: Results from the HERCULES trial. Catheter Cardiovasc Interv 2012; 80: 343–350.
- 15.
Fujihara M, Yokoi Y, Abe T, Soga Y, Yamashita T, Miyashita Y, et al. Clinical outcome of renal artery stenting for hypertension and chronic kidney disease up to 12 months in the J-RAS Study: Prospective, single-arm, multicenter clinical study. Circ J 2015; 79: 351–359.
- 16.
Mukoyama M, Nakayama Y, Adachi M. Renal angioplasty for atherosclerotic renal artery stenosis revisited: Efficacy and safety of renal artery stenting in the J-RAS study. Circ J 2015; 79: 295–296.
- 17.
Verdecchia P, Angeli F, Gattobigio R. Clinical usefulness of ambulatory blood pressure monitoring. J Am Soc Nephrol 2004; 15(Suppl 1): S30–S33.
- 18.
Salles GF, Leite NC, Pereira BB, Nascimento EM, Cardoso CR. Prognostic impact of clinic and ambulatory blood pressure components in high-risk type 2 diabetic patients: The Rio de Janeiro Type 2 Diabetes Cohort Study. J Hypertens 2013; 31: 2176–2186.
- 19.
JCS Joint Working Group. Guidelines for the clinical use of 24 hour ambulatory blood pressure monitoring (ABPM) (JCS 2010): Digest version. Circ J 2012; 76: 508–519.
- 20.
O’Brien E, Parati G, Stergiou G. Ambulatory blood pressure measurement: What is the international consensus? Hypertension 2013; 62: 988–994.
- 21.
Fagard RH, Celis H, Thijs L, Staessen JA, Clement DL, De Buyzere ML, et al. Daytime and nighttime blood pressure as predictors of death and cause-specific cardiovascular events in hypertension. Hypertension 2008; 51: 55–61.
- 22.
Zeller T, Frank U, Müller C, Bürgelin K, Sinn L, Bestehorn HP, et al. Predictors of improved renal function after percutaneous stent-supported angioplasty of severe atherosclerotic ostial renal artery stenosis. Circulation 2003; 108: 2244–2249.
- 23.
Symonides B, Frank U, Müller C, Bürgelin K, Sinn L, Bestehorn HP, et al. Effects of the correction of renal artery stenosis on blood pressure, renal function and left ventricular morphology. Blood Press 1999; 8: 141–150.
- 24.
Kadziela J, Januszewicz A, Prejbisz A, Michałowska I, Januszewicz M, Florczak E, et al. Prognostic value of renal fractional flow reserve in blood pressure response after renal artery stenting (PREFER study). Cardiol J 2013; 20: 418–422.
- 25.
Mangiacapra F, Trana C, Sarno G, Davidavicius G, Protasiewicz M, Muller O, et al. Translesional pressure gradients to predict blood pressure response after renal artery stenting in patients with renovascular hypertension. Circ Cardiovasc Interv 2010; 3: 537–542.
- 26.
Leesar MA, Varma J, Shapira A, Fahsah I, Raza ST, Elghoul Z, et al. Prediction of hypertension improvement after stenting of renal artery stenosis: Comparative accuracy of translesional pressure gradients, intravascular ultrasound, and angiography. J Am Coll Cardiol 2009; 53: 2363–2371.
- 27.
Mitchell JA, Subramanian R, White CJ, Soukas PA, Almagor Y, Stewart RE, et al. Predicting blood pressure improvement in hypertensive patients after renal artery stent placement: Renal fractional flow reserve. Catheter Cardiovasc Interv 2007; 69: 685–689.
- 28.
Subramanian R, White CJ, Rosenfield K, Bashir R, Almagor Y, Meerkin D, et al. Renal fractional flow reserve: A hemodynamic evaluation of moderate renal artery stenoses. Catheter Cardiovasc Interv 2005; 64: 480–486.
- 29.
Jones NJ, Bates ER, Chetcuti SJ, Lederman RJ, Grossman PM. Usefulness of translesional pressure gradient and pharmacological provocation for the assessment of intermediate renal artery disease. Catheter Cardiovasc Interv 2006; 68: 429–434.
- 30.
Gifford RW Jr, Tarazi RC. Resistant hypertension: Diagnosis and management. Ann Intern Med 1978; 88: 661–665.
- 31.
Setaro JF, Black HR. Refractory hypertension. N Engl J Med 1992; 327: 543–547.
- 32.
Mancia G, Fagard R, Narkiewicz K, Redon J, Zanchetti A, Bohm M, et al. 2013 ESH/ESC guidelines for the management of arterial hypertension: The Task Force for the Management of Arterial Hypertension of the European Society of Hypertension (ESH) and of the European Society of Cardiology (ESC). Eur Heart J 2013; 34: 2159–2219.
- 33.
Zuern CS, Eick C, Rizas KD, Bauer S, Langer H, Gawaz M, et al. Impaired cardiac baroreflex sensitivity predicts response to renal sympathetic denervation in patients with resistant hypertension. J Am Coll Cardiol 2013; 62: 2124–2130.
- 34.
Sega R, Facchetti R, Bombelli M, Cesana G, Corrao G, Grassi G, et al. Prognostic value of ambulatory and home blood pressures compared with office blood pressure in the general population: Follow-up results from the Pressioni Arteriose Monitorate e Loro Associazioni (PAMELA) study. Circulation 2005; 111: 1777–1783.
- 35.
Kawarada O, Yokoi Y, Takemoto K, Morioka N, Nakata S, Shiotani S. The performance of renal duplex ultrasonography for the detection of hemodynamically significant renal artery stenosis. Catheter Cardiovasc Interv 2006; 68: 311–318.
- 36.
Hart PD, Bakris GL. Should beta-blockers be used to control hypertension in people with chronic kidney disease? Semin Nephrol 2007; 27: 555–564.
- 37.
Meschi M, Detrenis S, Musini S, Strada E, Savazzi G. Facts and fallacies concerning the prevention of contrast medium-induced nephropathy. Crit Care Med 2006; 34: 2060–2068.
- 38.
Warncke J, David S, Kümpers P, Opherk JP, Haller H, Fliser D. A hibernating kidney: Ischemic preconditioning in a renal transplant recipient with a proximal stenosis of the iliac artery. Clin Nephrol 2008; 70: 168–171.