Abstract
Background:
In patients with proximal pulmonary artery (PA) thromboembolism, an increased PA resistance contributes to abnormal right ventricular (RV) afterload. However, the effects of proximal thromboembolism on the dynamic properties of RV afterload, which is determined by PA impedance, have not been analyzed quantitatively. The present study aimed to identify changes in PA impedance after the pulmonary perfusion volume was greatly reduced by unilateral proximal PA occlusion.
Methods and Results:
Ten male Sprague-Dawley rats were used. PA flow and pressure waveforms were recorded during irregular pacing, before and 10 min after left PA occlusion. PA impedance was parameterized by using a three-element Windkessel model consisting of peripheral resistance (RP), arterial compliance (CP) and characteristic impedance (ZC). After proximal PA occlusion, PA impedance modulus increased over a frequency range of interest.
ZC
increased significantly (after PA occlusion vs. baseline: 0.128±0.016 vs. 0.074±0.010 mmHg·min/ml, P<0.001), whereas
CP
and
RP
did not change significantly.
Conclusions:
Proximal PA occlusion increased
ZC
with the attenuation of
RP
increase and
CP
decrease predicted from the decreased pulmonary perfusion volume. The insignificant changes in
RP
and
CP
indicate that a recruitment phenomenon may result in this attenuation. The existence of compensation by a recruitment mechanism suggests the relative importance of increased
ZC
in defining abnormal RV afterload in patients with proximal PA thromboembolism. (Circ J 2016; 80: 2010–2018)
Acute pulmonary thromboembolism (PTE) leads to hemodynamic instability and fatal events.1–3
In patients with massive PTE, mortality is approximately 70% within the first presentation,4
and mortality correlates strongly with the degree of right ventricular (RV) dysfunction.5
The RV dysfunction is induced by an abnormal increase in RV afterload. Thus, understanding changes in RV afterload after thromboembolism may provide an important clue to establish treatment strategies in patients with PTE. RV afterload is commonly evaluated in terms of total pulmonary resistance (TPR) or pulmonary vascular resistance (PVR). The former is calculated from mean pulmonary artery (PA) pressure divided by mean PA flow, whereas the latter is calculated from the difference between mean PA pressure and mean PA wedge pressure (or mean left atrial [LA] pressure) divided by mean PA flow. While TPR and PVR reflect the static properties of the pulmonary vascular bed, they do not take into account the important contribution of pulsatile circulation to RV afterload. In the pulsatile circulation, RV afterload can be expressed in detail using PA impedance, which reflects the dynamic properties of the pulmonary vascular bed.6
PA impedance can be parameterized using a three-element Windkessel (3-WK) model (Figure 1),7,8
consisting of peripheral resistance (RP), arterial compliance (CP), and characteristic impedance of the proximal PA (ZC). Hereinafter, PA impedance at 0 Hz in the 3-WK model9
is referred to as direct current (DC) resistance, which is given by the sum of
ZC
and
RP. DC resistance corresponds theoretically to PVR in the clinical setting.

The pulmonary vascular perfusion volume in patients with acute PTE is reduced by more than 50%, and the reduction of pulmonary vascular perfusion correlates with increases in TPR and PVR.10,11
However, how the reduction of the pulmonary vascular perfusion volume affects dynamic characteristics of RV afterload remains largely unknown. Although reduction of the perfused pulmonary vascular bed in unilateral lung is expected to double both
RP
and
ZC
and halve
CP,12
the pulmonary circulation is unique in that a recruitment phenomenon, that is, opening up of previously closed peripheral vessels, occurs when PA flow and pressure increase.13,14
As the recruitment phenomenon likely compensates for the increase in
RP
with little impact on
ZC,
RP
may not increase proportionally to
ZC
when a large volume of the pulmonary vascular bed is lost, such as in the case of acute PTE in the proximal PA. The fact that the ratio of
ZC
to
RP
in the pulmonary circulation is not as small as that in the systemic circulation15,16
also indicates the importance of assessing both
ZC
and
RP
in the pulmonary circulation. However, to the best of our knowledge, changes in
RP
and
ZC
after the reduction of a large volume of pulmonary perfusion have not been examined quantitatively. To what extent the recruitment phenomenon in the peripheral arteries compensates for the expected decrease in
CP
after losing a large perfusion volume also remains undetermined, because the effect of the recruitment phenomenon may depend on the relative distribution of
CP
from the proximal to the distal PAs.
We have recently established techniques to measure PA impedance in vivo over a wide frequency of interest in rats.17
To address the above-mentioned questions, we examined changes in the 3-WK parameters (RP,
CP
and
ZC) of PA impedance before and after unilateral proximal PA occlusion in anesthetized normal rats. We tested the following hypotheses: (1) increase in
ZC
is greater than the increase in
RP; and (2) a potential decrease in
CP
is compensated by the recruitment phenomenon after proximal PA occlusion.
Methods
Experiments were performed in 10 male Sprague-Dawley rats (380–470 g in weight) at 13.6 weeks (median, range 11.3–17.1 weeks) of age. Animal care was provided in accordance with the “Guiding Principles for the Care and Use of Animals in the Field of Physiological Sciences”, approved by the Physiological Society of Japan. The experimental protocols were reviewed and approved by the Animal Subjects Committee at the National Cerebral and Cardiovascular Center, Japan.
Surgical Preparation
Rats were anesthetized with an intraperitoneal injection (2 ml/kg) of α-chloralose (40 mg/ml) and urethane (250 mg/ml). Mechanical ventilation was performed via a tracheotomy with a mixture of room air and oxygen to prevent hypoxia. Partial pressure of oxygen in arterial blood was supranormal during the experiment (>200 mmHg). Ventilation was conducted at a rate of 80 breaths per min and a tidal volume of 2.0–2.5 ml. A heating pad was used to maintain body temperature at approximately 38℃. An arterial catheter was inserted into the right femoral artery to measure systemic arterial (SA) pressure and heart rate (HR) using a fluid-filled pressure sensor (DX-200; Nihon-Kohden, Tokyo, Japan) and a cardiotachometer (AT-601G; Nihon-Kohden), respectively. A venous catheter was introduced into the right femoral vein to administer a maintenance dose of the anesthetic mixture described above (0.1–0.15 ml·kg–1·h–1). A left-sided thoracotomy with an incision from the border of the sternum to the anterior axillary line was performed to expose the hilum of the left lung. After partially removing the pericardium, an ultrasound transit-time flow probe (MA-2.5PSB; Transonic Systems, Ithaca, NY, USA) was placed around the main PA to record PA flow at a cut-off filter above 160 Hz. A high fidelity catheter-tipped micromanometer (SPR-320; Millar Instruments, Houston, TX, USA) was introduced into the main PA by penetrating the RV free wall. A pair of polyurethane-coated stainless steel lead wires was attached to the LA appendage to pace the heart.
Protocol
First, hemodynamic parameters (HR, SA pressure, PA flow and pressure) were measured simultaneously during sinus rhythm. Thereafter, PA flow and pressure were recorded during irregular pacing (R-R intervals uniformly distributed between 100 and 150 ms) for calculation of PA impedance with high frequency resolution over a wide frequency range. Note that a sufficient input power of PA flow is necessary for the stable calculation of PA impedance. Hence, PA impedance can be estimated reliably only at frequencies related to the heart beat and mechanical ventilation and their harmonics under sinus rhythm.17
Irregular pacing increases the input power of PA flow outside the frequencies afforded by sinus rhythm, enabling an accurate estimation of the mechanical properties of pulmonary vasculature. Second, the left PA was ligated at the hilum of the left lung using a 5-0 silk thread, without involving the main left bronchus and pulmonary veins. The distal end of the intubation tube was maintained in the trachea throughout the experiment, and not moved into the main right bronchus for one-lung ventilation after left PA ligation. Ten minutes later, when hemodynamic stabilized to a new steady state, the hemodynamic parameters were measured during sinus rhythm and irregular pacing.
Data Analysis
Data were digitized at 1,000 Hz using a 16-bit analog-to-digital converter. PA impedance was calculated as a transfer function between PA flow as an input and PA pressure as an output. The input-output pairs of the PA flow and pressure waveforms were divided into 12 sets of half-overlapping segments of 213
data points each. The segment length was 8.192 s, the frequency resolution was 0.122 Hz, and the total data length was 53.248 s. For each segment, a linear trend was subtracted and a Hanning spectral window was applied. The input and output frequency spectra were obtained using a fast Fourier transform. Thereafter, the power of PA flow [SQQ(f)], power of PA pressure [SPP(f)], and cross-spectrum between PA pressure and PA flow [SPQ(f)] were ensemble averaged over the 12 segments. PA impedance was estimated as the transfer function [Z(f)] from PA flow to PA pressure using Eq. 1:18
 Eq. 1
Eq. 1
The magnitude-squared coherence function [Coh(f)], which represents the linear dependence between the input and output, was calculated using Eq. 2:18
 Eq. 2
Eq. 2
Changes in PA impedance were evaluated at each frequency by calculating the ratio of the modulus [Rmodulus(f)] and the difference in the phase [Dphase(f)] as follows:
 Eq. 3
Eq. 3
 Eq. 4
Eq. 4
where [Zbase(f)] and [Zoccl(f)] represent PA impedance values at baseline and after proximal PA occlusion, respectively.
The input impedance of the 3-WK model [Z3WK(f)] is expressed by Eq. 5:19
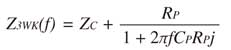 Eq. 5
Eq. 5
where
f
and
j
represent the frequency and imaginary units, respectively.
RP,
CP, and
ZC
of the measured PA impedance were estimated by fitting
Z3WK(f) to
Z(f) up to 24.4 Hz using an iterative non-linear least squares fitting method. The following error function was minimized:
 Eq. 6
Eq. 6
where
k
is an index of a discrete Fourier transform and
f0
is the fundamental frequency (f0=0.122 Hz). DC resistance was derived from
ZC+RP.
HR, mean SA pressure, mean PA flow and pressure during sinus rhythm were calculated by averaging the respective data for 53.248 s. The data length was the same as the total data length in the PA impedance calculation during irregular pacing. TPR was obtained by the ratio of mean PA pressure to flow, without subtracting LA pressure.
Statistical Analysis
All data are presented as mean±standard error. Hemodynamic parameters before and after proximal PA occlusion were compared by using the Wilcoxon signed-rank test for paired comparison. P values less than 0.05 were considered statistically significant.
Results
Hemodynamic parameters during sinus rhythm at baseline and after proximal PA occlusion are shown in
Table 1. HR, mean PA pressure, mean PA pulse pressure, and TPR increased, while mean PA flow decreased significantly after proximal PA occlusion.
Table 1.
Hemodynamic Parameters at Baseline and After Proximal PA Occlusion
| |
Baseline |
Proximal PA occlusion |
P value |
| HR, beats/min |
407±8 |
434±7 |
<0.01 |
| QPA, ml/min |
32.1±2.0 |
25.0±2.0 |
0.01 |
| PPA, mmHg |
17.0±0.8 |
19.7±1.0 |
<0.01 |
| PPPA, mmHg |
15.5±1.0 |
19.2±2.1 |
<0.01 |
| PSA, mmHg |
100.2±5.3 |
110.9±6.9 |
0.06 |
| TPR, mmHg·min/ml |
0.55±0.04 |
0.82±0.07 |
<0.01 |
Values are expressed as mean±SE. HR, heart rate; PA, pulmonary artery; PPA, mean PA pressure; PPPA, mean pulse pressure of PA pressure; PSA, mean systemic arterial pressure; QPA, mean PA flow; TPR, total pulmonary resistance calculated from PPA/QPA. P values were calculated using Wilcoxon signed-rank test for paired comparison.
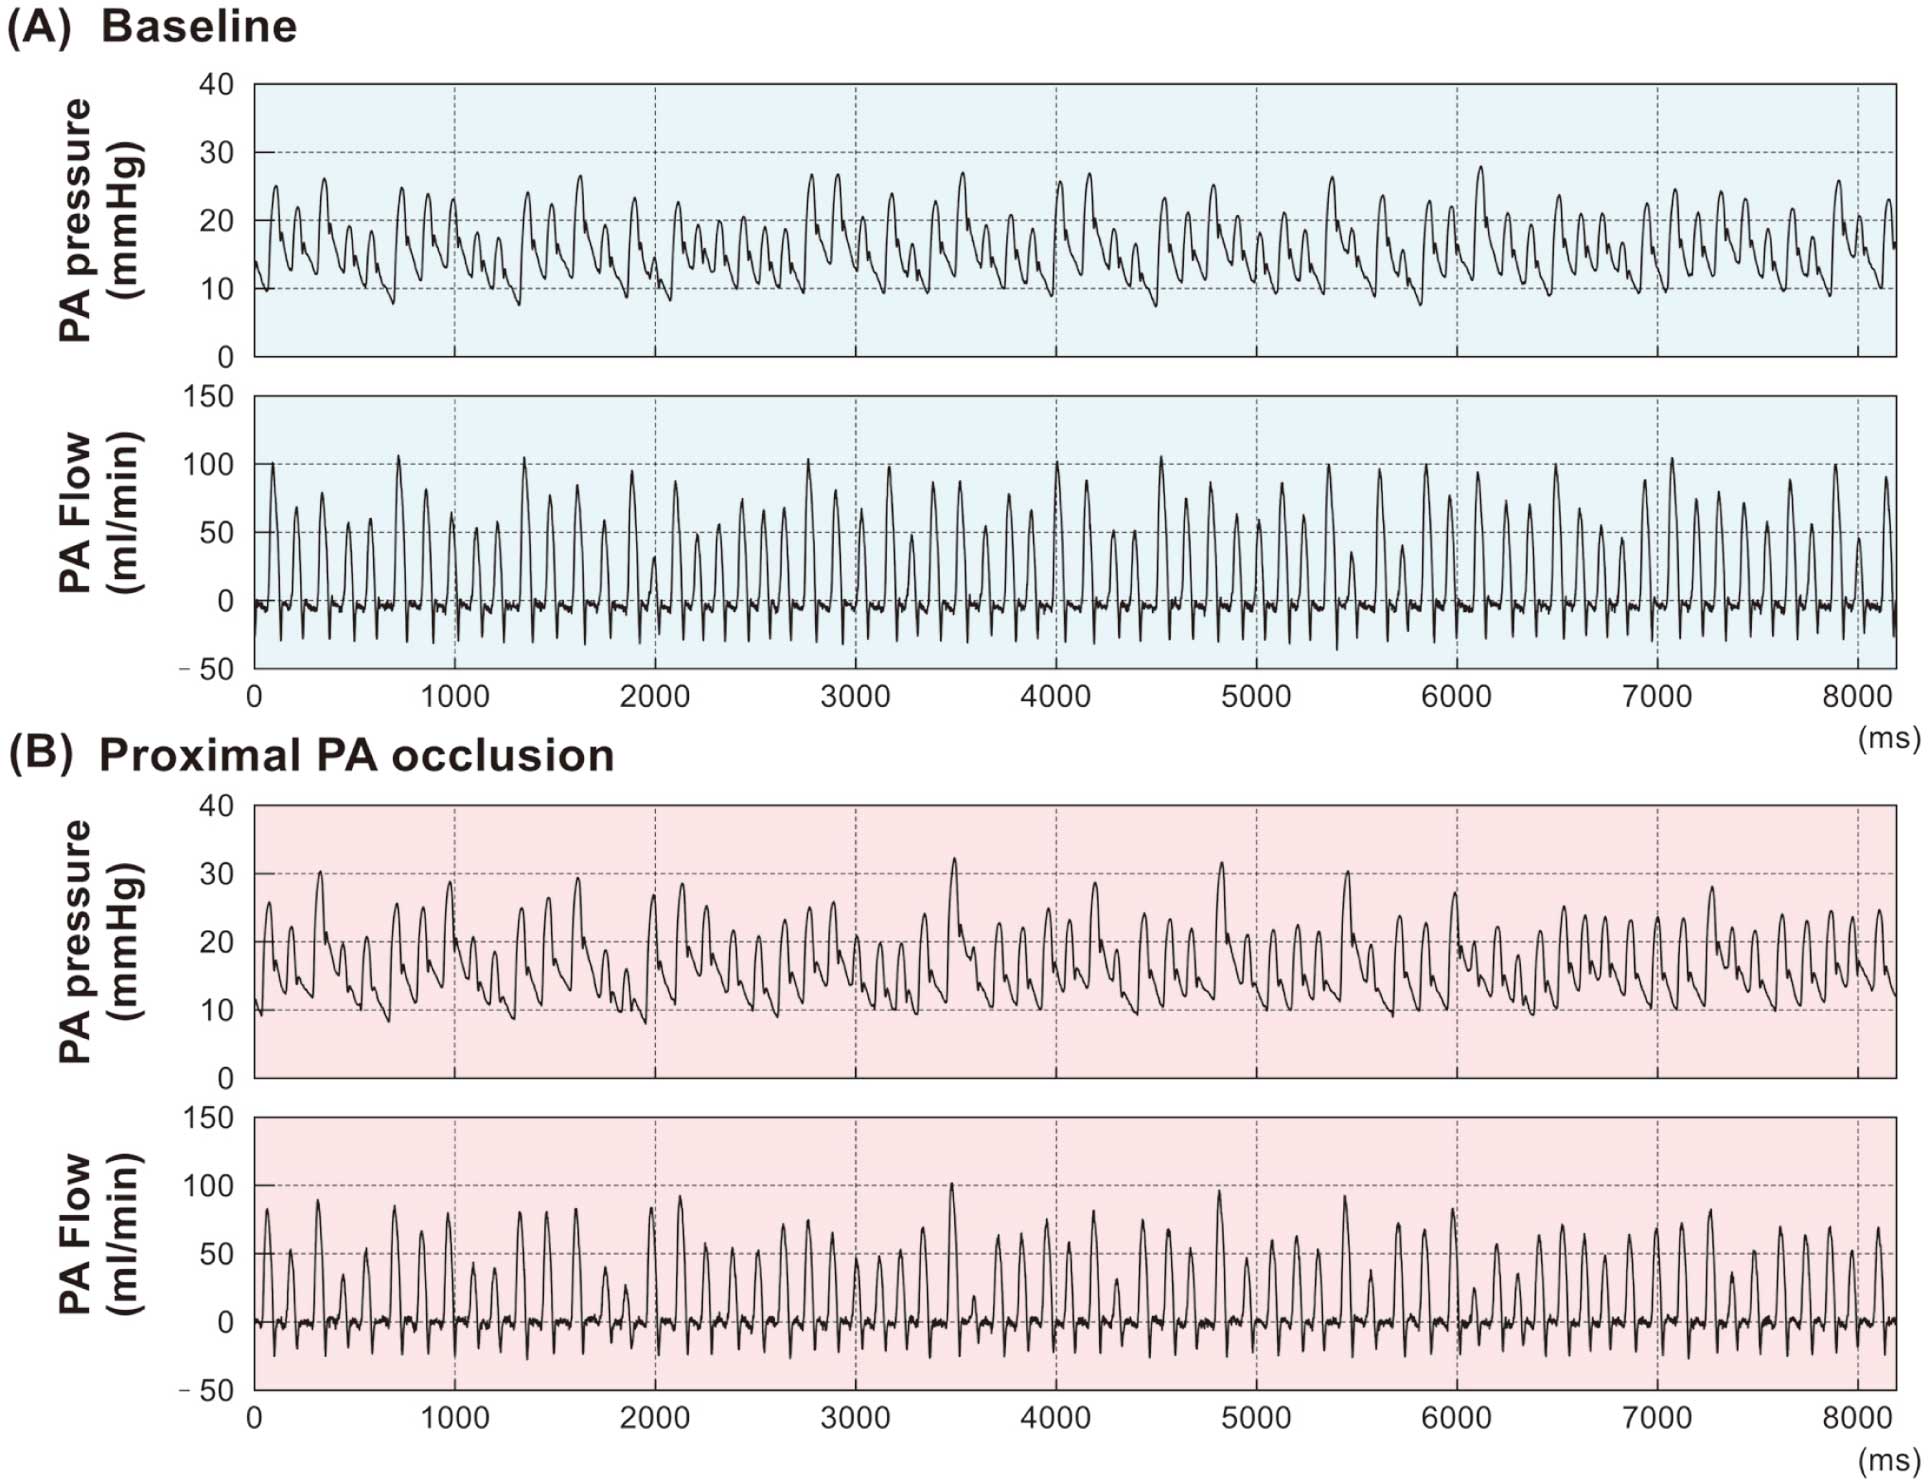
Shown in
Figure 2
are the typical time series of PA pressure and flow during irregular pacing at baseline (A) and after proximal PA occlusion (B) in a rat. On average, pulse pressure of the PA was higher and peak PA flow was lower after proximal PA occlusion compared with baseline.
Figure 3
shows the power spectra of PA flow and pressure at baseline (left panels) and after proximal PA occlusion (right panels) pooled for 10 animals. The power spectrum of PA flow averaged below 15 Hz was 3.5±0.6 (ml/min)2
at baseline, and decreased significantly to 1.7±0.3 (ml/min)2
after proximal PA occlusion (P=0.02). The power spectrum of PA pressure averaged below 15 Hz was 0.036±0.005 mmHg2
at baseline, and increased significantly to 0.053±0.010 mmHg2
after proximal PA occlusion (P=0.04).

Figure 4
shows the PA impedance modulus plotted on linear and logarithmic scales, the PA impedance phase, and coherence function pooled for 10 animals. PA impedance revealed a combination of low pass characteristics and a frequency-independent modulus in the higher frequency range. The PA impedance modulus averaged below 1 Hz, was 0.303±0.033 mmHg·min/ml at baseline, and increased significantly to 0.438±0.039 mmHg·min/ml after proximal PA occlusion (P=0.02). The PA impedance modulus averaged between 15 and 25 Hz was 0.063±0.006 mmHg·min/ml, and increased significantly to 0.124±0.015 mmHg·min/ml after proximal PA occlusion (P<0.01). Both at baseline and after proximal PA occlusion, the phase of PA impedance switched from a negative to positive value at ~15 Hz. The coherence function indicated high linearity between PA pressure and flow in the frequency range up to 25 Hz, except the troughs at the frequency of mechanical ventilation (approximately 1.3 Hz) and its harmonics.

As illustrated in
Figure 5, the ratio of PA impedance modulus after proximal PA occlusion to that at baseline was relatively constant at approximately 1.5 for the frequency range below 2 Hz, and then increased with increasing frequency up to roughly 20 Hz. Above this frequency, the ratio of the modulus distributed around 1.5 with large variance, probably due to the decreased accuracy of the PA impedance estimation in the higher frequency range above 20 Hz. The difference of the PA impedance phase was approximately zero over the tested frequency range.

The parameters of PA impedance estimated by fitting the 3-WK model to the measured PA impedance are summarized in
Table 2.
ZC
increased significantly after proximal PA occlusion compared with that at baseline. However,
CP
and
RP
after proximal PA occlusion were not significantly different from those at baseline. DC resistance was significantly elevated from baseline, and the ratio of
ZC
to
RP
increased significantly after proximal PA occlusion.
Table 2.
Parameters of the 3-Element Windkessel Model at Baseline and After Proximal PA Occlusion
| |
Baseline |
Proximal PA occlusion |
P value |
| DC resistance, mmHg·min/ml |
0.357±0.038 |
0.466±0.032 |
0.03 |
| ZC, mmHg·min/ml |
0.074±0.010 |
0.128±0.016 |
<0.001 |
| RP, mmHg·min/ml |
0.283±0.033 |
0.338±0.025 |
0.14 |
| CP, ml/mmHg |
0.453±0.071 |
0.367±0.032 |
0.11 |
| ZC/RP |
0.281±0.033 |
0.389±0.048 |
0.002 |
Values are expressed as mean±SE. CP, pulmonary artery compliance in the 3-element Windkessel model fitted to the measured pulmonary artery impedance; DC resistance, direct current resistance calculated from the summation of ZC and RP; PA, pulmonary artery; RP, peripheral resistance; ZC, characteristic impedance; ZC/RP, the ratio of ZC to RP. P values were calculated using Wilcoxon signed-rank test for paired comparison.
Discussion
To the best of our knowledge, this study is the first to quantify changes in PA impedance during irregular pacing after unilateral proximal PA occlusion in anesthetized rats. The main findings are that the proximal PA occlusion increased DC resistance and
ZC
without a comparable increase in
RP. The change in
CP
after proximal PA occlusion was not significant, suggesting that the recruitment of peripheral vasculature may have compensated for the potential changes in
RP
and
CP
predicted from simply considering the reduction of a large perfusion volume of the pulmonary circulation. The effect of proximal PA occlusion on PA impedance was frequency-dependent (Figure 5), which may have pathophysiological significance for the understanding of RV dysfunction associated with acute PTE.
Changes in Pulmonary Artery Impedance
The present study quantified changes in the dynamic properties of the pulmonary vascular bed after proximal PA occlusion. While RV hypokinesis on echocardiography is an independent risk of death in patients with acute PTE,5
RV afterload abnormality in terms of dynamic properties remains largely unknown. Although
ZC
is only 5–7% of
RP
in the systemic circulation,16
the ratio of
ZC
to
RP
in the pulmonary circulation is not as small as that in the systemic circulation.15
In the present study,
ZC
was 28±3% of
RP
at baseline and increased to 39±5% after proximal PA occlusion (Table 2). While
RP
remains a major determinant of DC resistance,
ZC
may have increased significance in defining abnormal RV afterload after proximal PA occlusion.
In previous studies, a proximal PA ensnarement increased TPR and
ZC.20–22
Lucas et al reported that excision of the left lung chronically increased TPR and
ZC
in dogs.23
However, in these studies, PA impedance was estimated without irregular pacing, and changes in
RP
were not explicitly reported. Therefore, the effect of a large reduction of volume perfused by the pulmonary vascular bed on
RP
remains to be clarified. We estimated PA impedance using irregular pacing and employed a method of unilateral proximal PA occlusion rather than unilateral pneumonectomy to acutely reduce pulmonary perfusion volume. As afferent signals from the lung are known to exert reflex effects on autonomic nervous activities and hemodynamics,24
proximal PA occlusion may mimic acute PTE better than pneumonectomy in that the afferent signals from the occluded lung might have been preserved.
PA impedance constructed using mean parameters of the 3-WK model in the present study is illustrated in
Figure 6. The broken blue lines show PA impedance at baseline. If one-half of the pulmonary perfusion is reduced by unilateral proximal PA occlusion with no changes in vascular properties in the unoccluded lung, PA impedance can be predicted by doubling
ZC
and
RP
and halving
CP (×-marked green lines). The actually measured data (solid red lines) indicates that proximal PA occlusion increased PA impedance modulus at higher frequencies (corresponding to
ZC) to approximately two-fold the baseline value. In contrast, PA impedance modulus at lower frequencies (corresponding to DC resistance [ZC+RP]) increased by less than two-fold the baseline value. The discrepancy between the predicted and measured PA impedance after proximal PA occlusion demonstrates the importance of the recruitment phenomenon in determining RV afterload in the lower frequency range, as discussed in the next paragraph. In the pulmonary circulation, higher
ZC
would decrease RV flow and the ‘pump efficiency’ of RV, as demonstrated in an isolated feline heart preparation.25
Thus, our results suggest that an increase in
ZC
rather than
RP
may yield abnormal RV afterload, leading to RV dysfunction in patients with acute PTE in the proximal PA.

Pulmonary circulation is characterized by the recruitment of small vessels in response to hydraulic loading,13,14
and therefore the number of small vessels that contribute to effective pulmonary circulation may be increased after proximal PA occlusion. The present study suggests that the recruitment phenomenon compensated for changes in
RP
and
CP
after proximal PA occlusion. Another mechanism that needs to be considered is flow-dependent dilatation of pulmonary vasculature and distension of capillaries that are already opened. In general, vascular resistance decreases as the lumen diameter increases,26
which may have contributed to the attenuation of the
RP
increase after proximal PA occlusion. In contrast, local vascular compliance may not change with the lumen diameter or it may even start to decrease with extreme distension.26
Hence, the flow-dependent dilatation may not explain the attenuation of the
CP
decrease after proximal PA occlusion. As the recruited vessels can also be affected by the flow-dependent dilatation, it may be difficult to assess the effects of the flow-dependent dilatation separately from the recruitment phenomenon in the present experimental setting. The insignificant change in
CP
indicates that
CP
reflects the vascular properties of small arteries rather than those of large vessels in the pulmonary circulation. The results are consistent with a previous clinical study in which
CP
was observed to be distributed mainly over the distal pulmonary vascular bed.27
Taken together, the recruitment of peripheral arteries compensates for changes in
RP
and
CP, but does not attenuate the increase in
ZC
after proximal PA occlusion, because
ZC
mainly reflects the properties of the proximal PA.
Clinical Implications
Clinically, the reduction in effective pulmonary vascular perfusion can be analyzed quantitatively by nuclear scans in patients with acute PTE.11
However, the present study results suggest that quantification of perfusion volume alone does not allow prediction of changes in RV afterload. An increase in
RP
and a decrease in
CP, which are expected from the reduction of perfusion volume, will be compensated largely by the recruitment phenomenon, even when approximately one-half of the entire pulmonary circulation is lost. Although
ZC
is not usually measured in clinical settings, the insignificant changes in
RP
and
CP
after proximal PA occlusion would strengthen the pathophysiological significance of
ZC
in determining abnormal RV afterload in patients with proximal thromboembolism. While it is beyond doubt that pharmacological or surgical removal of the thrombus is indispensable for the treatment of acute PTE,28
the findings of the present study will improve our understanding of abnormal RV afterload in patients with proximal thromboembolism, and may provide an important clue for therapeutic strategies in patients with chronic pulmonary hypertension. In patients with chronic thromboembolism pulmonary hypertension, therapeutic reduction of RV afterload, which is attained by surgical intervention against the thrombus and fibrous obstructive tissue in the proximal PA,29,30
may be classified as a therapy mainly targeting changes in
ZC. In contrast, our previous study using a monocrotaline-induced rat model of pulmonary arterial hypertension demonstrated increased
RP
and decreased
CP, together with increased
ZC, in the model rats.17
Under such conditions, pharmacological therapies targeting peripheral vessels may be required to reduce
RP
and increase
CP. Further animal experiments and clinical research are warranted to select treatment strategies based on changes of PA impedance. The parameters of PA impedance (RP,
CP, and
ZC) can be clinically estimated using PA flow and pressure waveforms.6,15,31
Nevertheless, more convenient clinical parameters that may correlate with
RP,
CP, and
ZC, should be sought to facilitate the application of the present findings to clinical therapeutic strategies.
Study Limitations
First, the experiment was performed under anesthetized conditions. While baroreflex-mediated changes in sympathetic nerve activity (SNA) can be observed in the same experimental condition,32
the anesthesia might have affected SNA to a variable extent. As SNA can alter pulmonary vascular tone,33
the present study results need to be carefully interpreted when extrapolating them to the understanding of pathology of patients with acute PTE.
Second, positive pressure mechanical ventilation was performed under open-chest conditions in the present study. Mechanical ventilation has been reported to affect PA impedance in closed-chest animals.34
Although intrathoracic pressure was almost equal to atmospheric pressure under the present open-chest experimental setting, the parameters associated with mechanical ventilation (ie, tidal volume and ventilation rate) may affect the troughs of the coherence function at the frequency of ventilation (approximately 1.3 Hz) and its harmonics. In addition, ventilation was performed with oxygen-enriched room air, which might have masked hypoxia after proximal PA occlusion. As hypoxia can affect pulmonary vascular tone through changes in autonomic nervous activities,35
further investigation may be required to quantify the effects of the mechanical ventilation settings and hypoxia on the parameters of PA impedance.
Third, while this experiment provides information on changes in PA impedance 10 min after proximal PA occlusion, not only mechanical PA obstruction but also the release of humoral factors, such as serotonin and thromboxane A2, can exacerbate hemodynamics in patients with acute PTE. As the humoral factors are released by the interaction between platelets and thrombosis,36
the present study results, which are based on proximal PA occlusion without thrombosis, cannot account for the effects of the humoral factors on PA impedance. Moreover, chronic changes of
RP
and
CP
may be induced by vascular remodeling in patients with chronic thromboembolism.37,38
Further investigation is required to evaluate the effects of the humoral factors and vascular remodeling on the parameters of PA impedance.
Finally, LA pressure was not measured to simplify the surgical procedure in this study, because our preliminary investigation indicated that LA pressure had little impact on the overall estimation of PA impedance in rats.17
Nevertheless, taking into account LA pressure may eliminate the troughs of the coherence function at the frequency of ventilation and its harmonics.17
Conclusions
Proximal PA occlusion in rats resulted in significant increases in
ZC
and DC resistance with the attenuation of the expected
RP
increase and
CP
decrease. Insignificant changes in
RP
and
CP
indicate that even after a large volume of pulmonary perfusion was lost, a recruitment phenomenon effectively compensated for potential changes in
RP
and
CP. The existence of compensation by the recruitment mechanism suggests the relative importance of increased
ZC
in defining abnormal RV afterload in patients with acute PTE.
Acknowledgments
This study was supported by Intramural Research Fund (26-6-21) of the National Cerebral and Cardiovascular Center, Japan.
Conflicts of Interest
None declared.
References
- 1.
Nakamura M, Miyata T, Ozeki Y, Takayama M, Komori K, Yamada N, et al. Current venous thromboembolism management and outcomes in Japan. Circ J 2014; 78: 708–717.
- 2.
Mizuno A, Yamamoto T, Tanabe Y, Obayashi T, Takayama M, Nagao K; Tokyo CCU Network Scientific Committee. Pulmonary embolism in severity index and simplified pulmonary embolism severity index risk scores are useful to predict mortality in Japanese patients with pulmonary embolism. Circ J 2015; 79: 889–891.
- 3.
Tanaka H, Katsuragi S, Osato K, Hasegawa J, Nakata M, Murakoshi T, et al. Increase in maternal death-related venous thromboembolism during pregnancy in Japan (2010–2013). Circ J 2015; 79: 1357–1362.
- 4.
Samoukovic G, Malas T, deVarennes B. The role of pulmonary embolectomy in the treatment of acute pulmonary embolism: A literature review from 1968 to 2008. Interact Cardiovasc Thorac Surg 2010; 11: 265–270.
- 5.
Goldhaber SZ, Visani L, De Rosa M. Acute pulmonary embolism: Clinical outcomes in the International Cooperative Pulmonary Embolism Registry (ICOPER). Lancet 1999; 353: 1386–1389.
- 6.
Lankhaar JW, Westerhof N, Faes TJ, Marques KM, Marcus JT, Postmus PE, et al. Quantification of right ventricular afterload in patients with and without pulmonary hypertension. Am J Physiol Heart Circ Physiol 2006; 291: H1731–H1737.
- 7.
Westerhof N, Elzinga G, Sipkema P. An artificial arterial system for pumping hearts. J Appl Physiol 1971; 31: 776–781.
- 8.
Kind T, Faes TJ, Vonk-Noordegraaf A, Westerhof N. Proportional relations between systolic, diastolic and mean pulmonary artery pressure are explained by vascular properties. Cardiovasc Eng Technol 2011; 2: 15–23.
- 9.
Westerhof N, Lankhaar JW, Westerhof BE. The arterial Windkessel. Med Biol Eng Comput 2009; 47: 131–141.
- 10.
Crouch JD, Lucas CL, Keagy BA, Wilcox BR, Ha B. The acute effects of pneumonectomy on pulmonary vascular impedance in the dog. Ann Thorac Surg 1987; 43: 613–616.
- 11.
Azarian R, Wartski M, Collignon MA, Parent F, Hervé P, Sors H, et al. Lung perfusion scans and hemodynamics in acute and chronic pulmonary embolism. J Nucl Med 1997; 38: 980–983.
- 12.
Saouti N, Westerhof N, Postmus PE, Vonk-Noordegraaf A. The arterial load in pulmonary circulation. Eur Respir Rev 2010; 19: 197–203.
- 13.
Warrell DA, Evans JW, Clarke RO, Kingaby GP, West JB. Pattern of filling in the pulmonary capillary bed. J Appl Physiol 1972; 32: 346–356.
- 14.
West JB, Schneider AM, Mitchell MM. Recruitment in networks of pulmonary capillaries. J Appl Physiol 1975; 39: 976–984.
- 15.
Murgo JP, Westerhof N. Input impedance of the pulmonary arterial system in normal man: Effects of respiration and comparison to systemic impedance. Circ Res 1984; 54: 666–673.
- 16.
Westerhof N, Elzinga G. Normalized input impedance and arterial decay time over heart period are independent of animal size. Am J Physiol 1991; 261: R126–R133.
- 17.
Fukumitsu M, Kawada T, Shimizu S, Turner MJ, Uemura K, Sugimachi M. Development of a servo pump system for in vivo loading of pathological pulmonary artery impedance on the right ventricle of normal rats. Am J Physiol Heart Circ Physiol 2016; 310: H973–H983.
- 18.
Bendat JS, Piersol AG. Random data. Analysis and measurement procedures, 4th edition. Hoboken, N.J.: Wiley-Interscience Publication, 2010; 173–183, 207–220.
- 19.
Sunagawa K, Maughan WL, Sagawa K. Stroke volume effect of changing arterial input impedance over selected frequency ranges. Am J Physiol 1985; 248: H477–H484.
- 20.
Calvin JE Jr, Baer RW, Glantz SA. Pulmonary artery constriction produces a greater right ventricular dynamic afterload than lung microvascular injury in the open chest dog. Circ Res 1985; 56: 40–56.
- 21.
Wauthy P, Pagnamenta A, Vassalli F, Naeije R, Brimioulle S. Right ventricular adaptation to pulmonary hypertension: An interspecies comparison. Am J Physiol Heart Circ Physiol 2004; 286: H1441–H1447.
- 22.
Pagnamenta A, Vanderpool R, Brimioulle S, Naeije R. Proximal pulmonary arterial obstruction decreases the time constant of the pulmonary circulation and increases right ventricular afterload. J Appl Physiol 2013; 114: 1586–1592.
- 23.
Lucas CL, Murray GF, Wilcox BR, Shallal JA. Effects of pneumonectomy on pulmonary input impedance. Surgery 1983; 94: 807–816.
- 24.
Wang Y, Soukhova G, Proctor M, Walker J, Yu J. Bradykinin causes hypotension by activating pulmonary sympathetic afferents in the rabbit. J Appl Physiol 2003; 95: 233–240.
- 25.
Piene H, Sund T. Does normal pulmonary impedance constitute the optimum load for the right ventricle? Am J Physiol 1982; 242: H154–H160.
- 26.
Nichols WW, O’Rourke MF, Vlachopoulos C. McDonald’s blood flow in arteries. Theoretical, experimental and clinical principles, 6th edition. New York, NY: CRC, 2011; 29–31, 270–271.
- 27.
Saouti N, Westerhof N, Helderman F, Marcus JT, Stergiopulos N, Westerhof BE, et al. RC time constant of single lung equals that of both lungs together: A study in chronic thromboembolic pulmonary hypertension. Am J Physiol Heart Circ Physiol 2009; 297: H2154–H2160.
- 28.
JCS Joint Working Group. Guideline for the diagnosis, treatment and prevention of pulmonary thromboembolism and deep vein thrombosis (JCS 2009): Digest version. Circ J 2011; 75: 1258–1281.
- 29.
Mayer E, Klepetko W. Techniques and outcomes of pulmonary endarterectomy for chronic thromboembolic pulmonary hypertension. Proc Am Thorac Soc 2006; 3: 589–593.
- 30.
Tatebe S, Sugimura K, Aoki T, Miura M, Nochioka K, Yaoita N, et al. Multiple beneficial effects of balloon pulmonary angioplasty in patients with chronic thromboembolic pulmonary hypertension. Circ J 2016; 80: 980–988.
- 31.
Huez S, Brimioulle S, Naeije R, Vachiéry JL. Feasibility of routine pulmonary arterial impedance measurements in pulmonary hypertension. Chest 2004; 125: 2121–2128.
- 32.
Sata Y, Kawada T, Shimizu S, Kamiya A, Akiyama T, Sugimachi M. Predominant role of neural arc in sympathetic baroreflex resetting of spontaneously hypertensive rats. Circ J 2015; 79: 592–599.
- 33.
Shirai M, Tsuchimochi H, Nagai H, Gray E, Pearson JT, Sonobe T, et al. Pulmonary vascular tone is dependent on the central modulation of sympathetic nerve activity following chronic intermittent hypoxia. Basic Res Cardiol 2014; 109: 432.
- 34.
Cheifetz IM, Craig DM, Quick G, McGovern JJ, Cannon ML, Ungerleider RM, et al. Increasing tidal volumes and pulmonary overdistention adversely affect pulmonary vascular mechanics and cardiac output in a pediatric swine model. Crit Care Med 1998; 26: 710–716.
- 35.
Jouett NP, Watenpaugh DE, Dunlap ME, Smith ML. Interactive effects of hypoxia, hypercapnia and lung volume on sympathetic nerve activity in humans. Exp Physiol 2015; 100: 1018–1029.
- 36.
Ansari A. Acute and chronic pulmonary thromboembolism: Current perspective. Part II: Etiology, pathology, pathogenesis, and pathophysiology. Clin Cardiol 1986; 9: 449–456.
- 37.
Moser KM, Bloor CM. Pulmonary vascular lesions occurring in patients with chronic major vessel thromboembolic pulmonary hypertension. Chest 1993; 103: 685–692.
- 38.
Yamaki S, Ando M, Fukumoto Y, Higuchi Y, Kaneko K, Maeda K, et al. Histological examination by lung biopsy for the evaluation of operability and postoperative prognosis in patients with chronic thromboembolic pulmonary hypertension. Circ J 2014; 78: 476–482.