Abstract
Background:
Nonischemic dilated cardiomyopathy (NIDCM) patients, even those with a narrow QRS, are at increased risk for major adverse cardiac events (MACE). We hypothesized that 64-channel magnetocardiography (MCG) would be useful to detect prognostic left intraventricular disorganized conduction (LiDC) by overcoming the limitations of fragmented QRS (fQRS, qualitative definitions, low specificity) and late potential (abnormality undetectable in earlier QRS).
Methods and Results:
We evaluated LiDC on MCG, defined as significant deviation from a global clockwise left ventricular (LV) activation pattern, and conventional noninvasive predictors of MACE, including fQRS and late potential, in 51 NIDCM patients with narrow QRS (LV ejection fraction, 22±7%; QRS duration, 99±11 ms). MACE was defined as cardiac death, lethal ventricular arrhythmias, or LV assist device (LVAD) implantation. LiDC was present in 22 patients. Baseline characteristics were comparable between patients with and without LiDC, except for the ratio of positive late potential. During a mean follow-up of 2.9 years, MACE developed in 16 NIDCM patients (3 cardiac deaths, 9 lethal ventricular arrhythmias, and 4 LVAD). MACE was more incident in patients with LiDC (13/22) than in those without (3/29, P<0.001). Multivariate analysis revealed LiDC, but not fQRS or late potential, as the strongest independent predictor of MACE (hazard ratio 4.28, 95% confidence interval 1.30–19.39, P=0.015).
Conclusions:
MCG accurately depicts LiDC, a promising noninvasive predictor of MACE in patients with NIDCM and normal QRS.
In nonischemic dilated cardiomyopathy (NIDCM) patients, fibrosis and cellular degeneration in the left ventricular (LV) myocardium result in localized conduction block.1
As the LV conduction delay becomes pronounced, QRS duration increases and prolonged QRS is known to be associated with poor prognosis.2
However, even in NIDCM patients with apparently normal QRS duration, a cardiac event rate of 33% in approximately 1.5 years has been reported.3
The prognosis of these particular patients is indeed not favorable. Therefore, novel indicators capable of predicting cardiac events sensitively even in NIDCM patients with normal QRS duration are required.
Various methods that reflect left intraventricular conduction abnormality in NIDCM have been proposed. Although the usefulness of fragmented QRS (fQRS) observed on 12-lead ECG4,5
and late potential detected on signal-averaged ECG (SAECG)6
have been reported, their uses are limited. fQRS is defined qualitatively and can also be found as a normal variant.4,5
Late potential in the early or middle portion of the QRS complex may be buried in the QRS and undetectable.
Multichannel magnetocardiography (MCG) has been reported to have superior spatial and temporal resolution power, and allow detailed evaluation of the propagation of LV activation.7,8
In the present study, we hypothesized that MCG would detect left intraventricular disorganized conduction (LiDC) caused by localized LV conduction block, and thus be able to predict future cardiac events.
Methods
Study Population and Data Acquisition
This study was approved by the Institutional Review Board of the National Cerebral and Cardiovascular Center, with a waiver of individual consent (M23-050, M24-050-2). We retrospectively reviewed the medical records of patients with NIDCM and normal QRS duration who underwent MCG between July 2007 and March 2013.
The present study included NIDCM patients with normal QRS duration [QRS duration <120 ms, LV ejection fraction (LVEF) <35%], who underwent 12-lead ECG and SAECG around the same time as MCG and age- and sex-matched healthy subjects with no history of cardiac disease and normal 12-lead ECG (QRS duration <120 ms). The final diagnosis of NIDCM was based on the recommendations of the World Health Organization/International Society and Federation of Cardiology Task Force.9
Lethal arrhythmic events and hospital admission because of heart failure, symptoms, comorbidity, medications, and laboratory data were collected from the medical records. Lethal arrhythmic events were defined as unexpected cardiac arrest and lethal ventricular tachyarrhythmia including ventricular fibrillation, or sustained ventricular tachycardia >15 consecutive beats or lasting >30 s.
An ECG study was conducted within 7 days of the MCG study. 12-lead ECGs were recorded (Cardiofax V ECG-9321, Nihon Kohden Corp., Tokyo, Japan or FCP-7541, Fukuda Denshi, Tokyo, Japan) with a setting of 0.05–150-Hz filter, 60-Hz AC notch filter, 25 mm/s, and 10 mm/mV. According to Das et al,4
fQRS was defined as the presence of the RSR’ pattern in at least 2 contiguous leads in the major lead set, irrespective of the presence or absence of Q wave, and includes an additional R wave (R prime), notching of the R wave or S wave, and presence of 2 or more R prime. fQRS was evaluated on 12-lead ECG by 2 cardiologists, and the concordance rate of fQRS finding was 99%.
SAECG was recorded using a commercially available system (Spiderview, Ela Medical Inc., Arvada, CO, USA) that averaged 300 cycles using a bidirectional 40-Hz filter. The noise level was <0.4 μV in all cases. Late potential was assessed as positive when 2 of the following 3 criteria were met: filtered QRS duration >114 ms; duration of low amplitude (<40 μV) signal in the terminal filtered QRS >38 ms; root-mean-square voltage of the terminal 40 ms of the filtered QRS complex <20 μV.10
LVEF was primarily measured on cardiac magnetic resonance imaging (MRI), or by transthoracic echocardiography (Teichholz method or modified Simpson method) when MRI was unavailable.
Measurement and Analysis of MCG
MCG measurement and analysis have been reported in previous studies.8,11
Briefly, MCG was performed using a 64-channel device (MC-6400; Hitachi High-Technologies Corp., Tokyo, Japan) installed in a magnetically shielded room. With the patient supine, a laser marker was positioned at the xiphoid process to reproducibly match the position of the patient’s heart with that of the sensor (Figure 1). A Dewar housing enclosing superconducting quantum interference device (SQUID) sensors was placed close to the body surface for magnetic field registration.

With sensors aligned in an 8×8 matrix with a spacing of 25 mm, the normal components of magnetic flux vector were measured. The 64 MCG and 3 ECG signals for at least 30 s were recorded with a setting of 0.1–100-Hz filter, 60-Hz AC notch filter, and signal averaged using the ECG R wave peak. To evaluate the ventricular activation sequence, we used a current-arrow map, which shows approximate 2D current fluxes obtained from the partial derivatives of normal magnetic flux amplitude (in direction Z) with respect to 2 spatial distances, X and Y.11
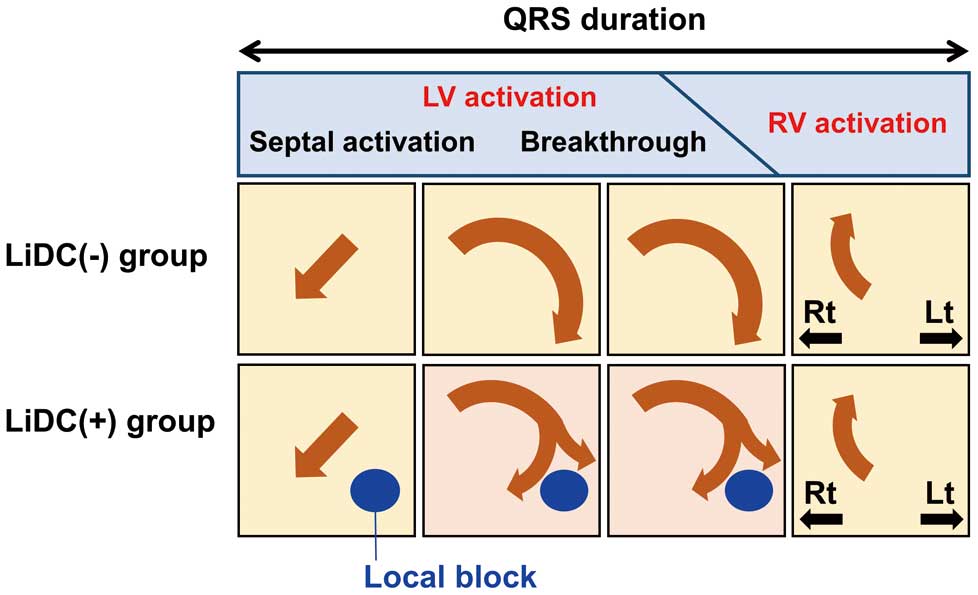
Definition of LiDC on MCG
The current-arrow maps were analyzed at intervals of 5 ms. The presence of LiDC, which deviated from the homogeneous major current observed in healthy adults, was detected quantitatively (Figure 2). The 64 current vectors in the current-arrow maps were assessed with regard to whether each vector was clockwise or anticlockwise, by computing the outer product of the vector and a vector obtained at a new position along the vector field. A small absolute value of the outer product vector (<0.03-fold the maximum absolute outer product for the whole time series) was considered indefinite. For the whole QRS duration, if an anticlockwise vector was detected in ≤4 current-arrow maps, the case was assessed as LiDC-negative (see
Figure S1
for detailed graphical explanation of the definition of LiDC).
Outcomes
We followed the NIDCM patients using their medical records for 5 years at the longest (from the day of MCG study to March 2014). The primary endpoint was a major adverse cardiac event (MACE) defined as cardiac death, lethal ventricular arrhythmias, or LV assist device (LVAD) implantation, whichever came first. Survival was compared between patients with and without fQRS on ECG, with and without late potential on SAECG, and with and without LiDC. In addition, all the variables were analyzed for whether they were predictors of MACE.
Statistical Analysis
Statistical analyses were conducted using JMP9.0 (SAS Institute Japan, Tokyo, Japan). A P-value <0.05 was considered significant. Data are expressed as mean±SD if normally distributed, or median (25–75th percentile) otherwise. For intergroup comparisons of continuous variables, t-test was used for normally distributed data, and the Wilcoxon rank sum test was used otherwise. Nominal variables were compared using the χ2
test or Fischer’s exact test.
For survival analysis, the Kaplan-Meier method was used to generate event-free survival curves, and the survival rates of the LiDC(+) and LiDC(–) groups were compared using log-rank test. To examine whether each variable predicted MACE, univariate analysis was conducted using Cox regression analysis. Factors showing P<0.05 in the univariate analysis were tested in the multivariate analysis.
Results
We enrolled 51 NIDCM patients who fulfilled the inclusion criteria; fQRS on 12-lead ECG was recognized in 25 of them (49%) and late potential on SAECG was found in 12 (24%).
Intraventricular Conduction Assessed by MCG in NIDCM Patients
We did not find LiDC in 13 healthy control subjects [age, 40 (37–45) years, 92% male]. We further demonstrated that subjects with minor findings such as left anterior fascicular block or right bundle branch block did not have LiDC (Figure S2). From the current-arrow maps of the NIDCM patients, LiDC was present in 22 patients [LiDC(+) group] and absent in 29 [LiDC(–) group]. Representative recordings of an LiDC(–) NIDCM patient, and LiDC(+) patient are shown in
Figures 3
and
S3. Noteworthy, in the patient with LiDC, fQRS on ECG was negative (Figure 3B) and late potential on SAECG was negative (Figure 3C).

Table 1
compares the baseline characteristics of the LiDC(+) and LiDC(–) groups of NIDCM patients. The 2 groups did not differ significantly in age, sex, symptoms, history of lethal arrhythmic events, or laboratory data. There were no significant intergroup differences in 12-lead ECG findings, including bundle branch block, hemi-block, and fQRS. On SAECG, the prevalence of late potential was significantly higher in the LiDC(+) group than the LiDC(–) group [LiDC(+); 9/22, 41% vs. LiDC(–); 3/29, 10%; P=0.018], while total filtered QRS duration was significantly longer and root mean square voltage of the last 40 ms was smaller in the LiDC(+) group. There was no difference between the 2 groups in LVEF.
Table 1.
Baseline Demographics, Clinical Findings and Laboratory Data in the LiDC(+) and LiDC(−) Groups
| |
All patients |
LiDC(+)
group |
LiDC(−)
group |
P value |
| n |
51 |
22 |
29 |
|
| Age, years |
50±15 |
49±15 |
51±15 |
0.695 |
| Male |
45 (88) |
20 (91) |
25 (86) |
0.688 |
| New York Heart Association classification |
|
|
|
0.704 |
| I |
2 (4) |
1 (5) |
1 (4) |
|
| II |
43 (84) |
18 (82) |
25 (86) |
|
| III |
5 (10) |
2 (9) |
3 (10) |
|
| IV |
1 (2) |
1 (5) |
0 (0) |
|
| History of lethal arrhythmic events |
5 (10) |
4 (18) |
1 (4) |
0.152 |
| Cardiac arrest of unknown etiology |
1 (2) |
1 (5) |
0 (0) |
|
| Lethal ventricular tachyarrhythmia |
4 (8) |
3 (14) |
1 (4) |
|
| History of heart failure hospitalization |
39 (76) |
15 (68) |
24 (83) |
0.320 |
| Major medications |
| β-blocker |
45 (88) |
18 (82) |
27 (93) |
0.383 |
| ACEI or ARB |
40 (78) |
19 (86) |
21 (72) |
0.312 |
| Spironolactone |
33 (65) |
15 (68) |
18 (62) |
0.770 |
| Diuretics |
39 (76) |
18 (82) |
21 (72) |
0.518 |
| Digoxin |
21 (41) |
7 (32) |
14 (48) |
0.266 |
| Amiodarone |
13 (25) |
8 (36) |
5 (17) |
0.194 |
| Laboratory tests |
| BNP (log of pg/mL) |
2.3 (1.8–2.5) |
2.3 (1.9–2.6) |
2.2 (1.8–2.4) |
0.147 |
| Creatinine, mg/dL |
0.87 (0.76–0.98) |
0.96 (0.75–1.05) |
0.84 (0.76–0.92) |
0.199 |
| Sodium, mEq/L |
139±3 |
139±3 |
140±2 |
0.282 |
| Hemoglobin, g/dL |
13.8 (13.3–15.3) |
13.8 (13.1–15.6) |
14.0 (13.3–15.2) |
0.574 |
| 12-lead ECG findings |
| Sinus rhythm |
41 (80) |
20 (91) |
21 (72) |
0.157 |
| QRS duration, ms |
99±11 |
101±11 |
98±11 |
0.442 |
| Left anterior fascicular block |
3 (6) |
1 (6) |
2 (7) |
1.000 |
| Fragmented QRS |
25 (49) |
14 (64) |
11 (38) |
0.093 |
| Signal-averaged ECG findings |
| Late potential |
12 (24) |
9 (41) |
3 (10) |
0.018 |
| Total filtered QRS duration, ms |
109 (99–116) |
115 (108–123) |
105 (95–113) |
0.007 |
| Low-amplitude signal duration (<40 μV), ms |
33 (26–40) |
37 (26–52) |
30 (26–35) |
0.098 |
Root-mean-square voltage of the terminal
40 ms, mV |
31 (17–48) |
18 (15–39) |
41 (28–72) |
0.009 |
| LVEF, % |
22±7 |
20±7 |
23±7 |
0.132 |
Results as mean±SD for data following a normal distribution and median (25–75th percentile) for data not normally distributed, or number (%). ACEI, angiotensin-converting enzyme inhibitor; ARB, angiotensin II receptor blocker; BNP, brain natriuretic peptide; ECG, electrocardiography; LiDC, left intraventricular disorganized conduction; LVEF, left ventricular ejection fraction.
During a median follow-up period of 2.9 years, although a total of 18 patients (33%) underwent implantation of cardiac devices, including implantable cardioverter defibrillator (ICD) and cardiac resynchronization therapy (CRT-D), there was no significant difference between the 2 LiDC groups. MACE occurred in a total of 16 patients (cardiac death in 3, lethal ventricular arrhythmia in 9, and LVAD in 4) (Table 2). Lethal ventricular arrhythmias consisted of ventricular fibrillation (n=1) and sustained ventricular tachycardia (n=8). All 9 patients with lethal ventricular arrhythmia were approved for an ICD for secondary prevention: 2 patients received an ICD, 6 patients underwent CRT-D and 1 patient received LVAD without ICD. The rate of MACE was 59% (13/22) in the LiDC(+) group, compared with 10% (3/29) in the LiDC(–) group. The Kaplan-Meier event-free curves showed a significantly higher incidence of MACE or lethal arrhythmic events, including cardiac death and ventricular arrhythmias, in the LiDC(+) group than in the LiDC(–) group (log-rank test; P<0.001, and P=0.018, respectively) (Figure 4C). Similarly, a significantly higher incidence of MACE was observed in patients with fQRS on ECG or late potential on SAECG (Figure 4A,B).
Table 2.
Comparison of MACE Between the LiDC(+) and LiDC(−) Groups
| |
All patients |
LiDC(+)
group |
LiDC(−)
group |
P value |
| n |
51 |
22 |
29 |
|
| Follow-up period, years |
2.9 (1.5–4.5) |
3.2 (2.2–5.0) |
2.5 (1.4–4.2) |
0.221 |
| Cardiac device implantation |
18 (33) |
11 (50) |
7 (35) |
0.078 |
| Implantable cardioverter defibrillator |
7 (14) |
2 (9) |
5 (17) |
|
| Cardiac resynchronization therapy |
11 (22) |
9 (40) |
2 (7) |
|
| MACE |
16 (31) |
13 (59) |
3 (10) |
<0.001 |
| Cardiac death |
3 (6) |
3 (14) |
0 (0) |
|
| Lethal ventricular arrhythmia |
9 (18) |
6 (27) |
3 (6) |
|
| LVAD |
4 (8) |
4 (18) |
0 (0) |
|
Results are presented as median (25–75th percentile), or number (%). LiDC, left intraventricular disorganized conduction; LVAD, left ventricular assist device implantation; MACE, major adverse cardiac events.

Cox regression analysis was performed to identify the predictors of MACE. Univariate analysis identified LiDC, LVEF, brain natriuretic peptide level, fQRS, and late potential as significant predictors of prognosis. When these factors were subjected to multivariate analysis, LiDC and LVEF remained significant independent predictors of MACE [LiDC, hazard ratio (HR) 4.28, 95% confidence interval (CI) 1.30–19.39, P=0.015; LVEF, HR 0.92, 95% CI 0.84–0.99, P=0.033] (Table 3).
Table 3.
Univariate and Multivariate Analyses for Predictors of MACE in NIDCM Patients
| Variable |
Univariate analysis |
Multivariate analysis |
| HR |
95% CI |
P value |
HR |
95% CI |
P value |
| LiDC on MCG |
6.89 |
2.20–30.19 |
<0.001 |
4.28 |
1.30–19.39 |
0.015 |
| Fragmented QRS on ECG |
2.88 |
1.04–9.24 |
0.042 |
1.75 |
0.59–5.91 |
0.317 |
| Late potential on SAECG |
3.48 |
1.21–9.81 |
0.022 |
1.67 |
0.55–4.95 |
0.356 |
| BNP (log of pg/mL) |
6.81 |
1.59–35.33 |
0.008 |
3.16 |
0.70–17.31 |
0.139 |
| LVEF |
0.89 |
0.82–0.96 |
0.001 |
0.92 |
0.84–0.99 |
0.033 |
CI, confidence intervals; HR, hazard ratio; MCG, magnetocardiography; NIDCM, nonischemic dilated cardiomyopathy; SAECG, signal-averaged electrocardiography. Other abbreviations as in Tables 1,2.
Discussion
In the present study, we used multichannel MCG to noninvasively evaluate LV depolarization in NIDCM patients with normal QRS duration. The major findings of this study were that (1) approximately 50% of NIDCM patients with normal QRS duration exhibited LiDC on MCG; and (2) the presence of LiDC was an independent predictor of MACE.
Need for Noninvasive, Reproducible and Accurate Predictors of MACE in NIDCM
The prognosis of NIDCM patients with apparently normal QRS duration is essentially unfavorable.3
In NIDCM, cardiomyocyte degeneration and fibrosis impair cell-to-cell coupling and are substrates for reentrant lethal arrhythmias.12
Therefore, accurate and sensitive detection of LiDC is important for detecting potential MACE and improving the prognosis of NIDCM patients. In addition, NIDCM is accompanied by progressive aggravation of cardiac function and alteration of the arrhythmic substrate,13
indicating the need for a noninvasive and highly reproducible test for MACE prediction.
fQRS and Late Potential Detected on ECG
In NIDCM, fQRS detected on surface 12-lead ECG is known to reflect myocardial fibrosis depicted on gadolinium-enhanced cardiac MRI,14,15
and has been reported to predict MACE.4
However, fQRS has some limitations. Its criteria are qualitative and the widely known definition by Das et al4
is similarly qualitative. fQRS is also recognized as a normal variant. Das et al4,16
highlighted the nonspecific nature of fQRS in individuals without suspected underlying heart conditions.
Late potential recorded on SAECG is fragmented electrical activity generated by delayed conduction in a zone containing a heterogeneous mixture of viable myocardium and scar. Late potential reflects the substrate for reentrant arrhythmias and is useful for the prediction of ventricular arrhythmia in various conditions, notably ischemic heart disease. For NIDCM, the study by Mancini et al of 114 patients with mean LVEF of 22% found that late potential predicted MACE with 75% sensitivity and 92% specificity.6
Several reports, however, have pointed out that late potential has limited prognostic value in NIDCM.17,18
One reason is that NIDCM comprises a large proportion of bradycardia and electromechanical dissociation, and the mechanisms of sudden death in NIDCM are diverse.19
Another possible reason is that compared with a post-infarcted heart with a clearly defined boundary between viable myocardium and scar tissue, the heart in NIDCM shows diffuse myocardial fibrosis, which may account for the difficulty in detecting delayed potential that reflects prominent, localized conduction disturbance. In particular, the localized conduction defect that occurs during the early or middle phase of the QRS complex may be buried within the QRS and not detected as an isolated potential at the end of the QRS, resulting in false-negative assessment of late potential.
Advantages of MCG
Both electric and magnetic fields are generated by the electrophysiological phenomena occurring in the myocardium. The drawbacks of 12-lead ECG, which detects electrical potential using surface electrodes, include interference by external noise as well as distortion arising from the different volume resistivity of organs and tissues such as the lungs, bone and intracardiac blood, and admixtures of the potentials from different cardiac tissues measured on the body surface. Similar to ECG, MCG is also measured close to the body surface, but the permeability of the magnetic field in the body is almost constant and homogeneous. In addition, magnetic flux reaches the body surface without being mixed. Together with the above characteristics, using a magnetically shielded room to eliminate noise from the environmental magnetic field and use of SQUID sensors to improve the sensitivity of magnetic field detection allow multi-point registration of the cardiac magnetic field at intensities below approximately 10–10
T, which is far smaller than the environmental magnetic field intensity of 10–4
T. As a result, MCG can be used to noninvasively evaluate the electrophysiological activity of the heart, with high spatial and temporal resolution power.
An important feature of MCG is that mapping allows visualization of the electrophysiological phenomena in various parts of the myocardium. The current-arrow maps that display electrical current direction and magnitude at multiple measurement points at any given time are ideal for detailed evaluation of the myocardium. On the other hand, the magnetic field is distance-dependent, and the signals near the sensor are reflected more intensely. An MCG registered from the front mainly assesses electrical activation in the anterior heart. However, because of the homogeneous magnetic permeability as mentioned before, it is possible to evaluate the electrical activation in the posterior heart by recording MCG from the back.
Multichannel MCG has been used clinically for the detection and diagnosis of fetal arrhythmias,20
and for analysis in healthy adults as well as detection of abnormalities in various heart diseases.7,21–23
Korhonen et al have reported the usefulness of QRS fragmentation detected quantitatively using the time-waveforms of MCG for predicting MACE in patients with previous myocardial infarction.21,22
Furthermore, Take et al reported that quantitative measurement using MCG is expected to supplement qualitative assessment of fQRS on surface 12-lead ECG.24
In the present study, we succeeded in noninvasively detecting LiDC using MCG in NIDCM patients with normal QRS duration, and demonstrated that this parameter was useful in predicting MACE.
Noninvasively Identified LiDC as an Independent and Accurate Predictor of MACE
We utilized the advantages of MCG and successfully identified an independent and accurate predictor of MACE in patients with NIDIM and normal QRS duration. The high spatial resolution of MCG clearly separated the currents originating from the LV and those from the right ventricle, and enabled detection of LiDC, even when it occurred early or in the middle of the LV currents. The importance of fragmentation in the early to middle QRS has been suggested by Korhonen et al.21,22
These favorable characteristics collectively allowed noninvasive, reproducible and accurate prediction of MACE. In addition, we attempted to define LiDC quantitatively. LiDC has never been detected in normal subjects (data not shown).
Study Limitations
This study was a retrospective observational study conducted in a single institution. Further clinical studies are required for validation of the present findings. This study recorded MCG only from the front, and mainly evaluated electrical activation in the anterior heart. The current technology could not realize 3D reconstruction of activation; instead, we utilized 2D current-arrow maps with high signal-to-noise ratio by positioning the sensors as close as possible to the chest. Even with 2D analysis obtained from the anterior chest, MCG was able to extract the appropriate LV activation (without being affected by right ventricular activation), which conventional ECG was unable to do. This fact made the present study successful.
We did not show evidence that the presence of fibrosis directly caused LiDC on MCG. LiDC simply indicates the existence of electrophysiologically nonconductive tissue in patients with NIDCM, but not in healthy subjects.8
However, because the main histological change in NIDCM is myocardial fibrosis, it is most reasonable to assume that this non-conduction may be caused by fibrosis.
MCG cannot be performed in patients implanted with a cardiac device, which is also the case for patients with wires retained in the heart region after median sternotomy or other procedures. In some of these patients, strong noise interference prevents adequate detection of the cardiac magnetic field and MCG cannot be performed.
Clinical Perspectives
A certain proportion of DCM has a non-ischemic origin, and the pathology or arrhythmic substrate is likely different from that of DCM with an ischemic etiology. Patients with NIDCM may develop complicated LV conduction disturbances because of widely distributed fibrosis or myocardial loss. When a prolonged QRS appears, this sign is generally considered to indicate a poor prognosis. NIDCM patients with near-normal QRS duration, however, are not necessarily without risk of MACE. This fact motivated us to identify patients at risk by meticulously examining the LV intraventricular conduction sequence. Current technologies that include fQRS on 12-lead ECG or late potential on SAECG may not suffice for this purpose.
Notwithstanding its retrospective and exploratory nature, this study indicated the superiority of multichannel MCG over current technologies, at least in the particular patient population studied. As this advantage is based on improved spatial resolution, which would not be achieved just by increasing the number of electrodes in body surface mapping, the authors believe that the results are generalizable and that prospective clinical trials are warranted.
If proven in a new well-designed prospective study, the result would exemplify the favorable characteristics of MCG as a diagnostic tool to scrutinize the detailed conduction patterns in LV, and to predict MACE. Future application of MCG to related fatal diseases may be anticipated.
Conclusions
Using multichannel MCG, we succeeded in noninvasively detecting LiDC in NIDCM patients with normal QRS duration. The presence of LiDC was associated with a high incidence of MACE, and was an independent predictor of MACE. MCG enabled detailed evaluation of LiDC, which is an effective risk assessment of MACE in NIDCM patients with normal QRS duration.
Acknowledgments
We gratefully thank Yoshiki Yanagi, Emi Yamashita of National Cerebral and Cardiovascular Center for their assistance with the MCG recordings.
Funding Sources
This study was supported by Intramural Funds (22-1-2, 22-1-5, 25-2-1) provided by THE National Cerebral and Cardiovascular Center.
Conflicts of Interest
None.
Supplementary Files
Supplementary File 1
Figure S1.
Graphical definition of left ventricular disorganized conduction (LiDC).
Figure S2.
Representative current-arrow maps of a control subject (Upper), a subject with left anterior fascicular block (LAFB;
Middle), and a subject with right bundle branch block (RBBB;
Lower).
Figure S3.
Several examples of left ventricular disorganized conduction (LiDC) in 6 different myocardial zones according to Kandori et al.
Please find supplementary file(s);
http://dx.doi.org/10.1253/circj.CJ-16-0683
References
- 1.
Nakayama Y, Shimizu G, Hirota Y, Saito T, Kino M, Kitaura Y, et al. Functional and histopathologic correlation in patients with dilated cardiomyopathy: An integrated evaluation by multivariate analysis. J Am Coll Cardiol 1987; 10: 186–192.
- 2.
Bode-Schnurbus L, Bocker D, Block M, Gradaus R, Heinecke A, Breithardt G, et al. QRS duration: A simple marker for predicting cardiac mortality in ICD patients with heart failure. Heart 2003; 89: 1157–1162.
- 3.
Cho GY, Song JK, Park WJ, Han SW, Choi SH, Doo YC, et al. Mechanical dyssynchrony assessed by tissue Doppler imaging is a powerful predictor of mortality in congestive heart failure with normal QRS duration. J Am Coll Cardiol 2005; 46: 2237–2243.
- 4.
Das MK, Maskoun W, Shen C, Michael MA, Suradi H, Desai M, et al. Fragmented QRS on twelve-lead electrocardiogram predicts arrhythmic events in patients with ischemic and nonischemic cardiomyopathy. Heart Rhythm 2010; 7: 74–80.
- 5.
Peters S, Trummel M, Koehler B. QRS fragmentation in standard ECG as a diagnostic marker of arrhythmogenic right ventricular dysplasia-cardiomyopathy. Heart Rhythm 2008; 5: 1417–1421.
- 6.
Mancini DM, Wong KL, Simson MB. Prognostic value of an abnormal signal-averaged electrocardiogram in patients with nonischemic congestive cardiomyopathy. Circulation 1993; 87: 1083–1092.
- 7.
Kwong JS, Leithauser B, Park JW, Yu CM. Diagnostic value of magnetocardiography in coronary artery disease and cardiac arrhythmias: A review of clinical data. Int J Cardiol 2013; 167: 1835–1842.
- 8.
Kandori A, Ogata K, Miyashita T, Watanabe Y, Tanaka K, Murakami M, et al. Standard template of adult magnetocardiogram. Ann Noninvasive Electrocardiol 2008; 13: 391–400.
- 9.
Richardson P, McKenna W, Bristow M, Maisch B, Mautner B, O’Connell J, et al. Report of the 1995 World Health Organization/International Society and Federation of Cardiology Task Force on the Definition and Classification of cardiomyopathies. Circulation 1996; 93: 841–842.
- 10.
el-Sherif N, Denes P, Katz R, Capone R, Mitchell LB, Carlson M, et al. Definition of the best prediction criteria of the time domain signal-averaged electrocardiogram for serious arrhythmic events in the postinfarction period: The Cardiac Arrhythmia Suppression Trial/Signal-Averaged Electrocardiogram (CAST/SAECG) Substudy Investigators. J Am Coll Cardiol 1995; 25: 908–914.
- 11.
Kandori A, Ogata K, Watanabe Y, Takuma N, Tanaka K, Murakami M, et al. Space-time database for standardization of adult magnetocardiogram-making standard MCG parameters. Pacing Clin Electrophysiol 2008; 31: 422–431.
- 12.
Soejima K, Stevenson WG, Sapp JL, Selwyn AP, Couper G, Epstein LM. Endocardial and epicardial radiofrequency ablation of ventricular tachycardia associated with dilated cardiomyopathy: The importance of low-voltage scars. J Am Coll Cardiol 2004; 43: 1834–1842.
- 13.
Dean JW, Lab MJ. Arrhythmia in heart failure: Role of mechanically induced changes in electrophysiology. Lancet 1989; 1: 1309–1312.
- 14.
Basaran Y, Tigen K, Karaahmet T, Isiklar I, Cevik C, Gurel E, et al. Fragmented QRS complexes are associated with cardiac fibrosis and significant intraventricular systolic dyssynchrony in nonischemic dilated cardiomyopathy patients with a narrow QRS interval. Echocardiography 2011; 28: 62–68.
- 15.
Tigen K, Karaahmet T, Gurel E, Cevik C, Nugent K, Pala S, et al. The utility of fragmented QRS complexes to predict significant intraventricular dyssynchrony in nonischemic dilated cardiomyopathy patients with a narrow QRS interval. Can J Cardiol 2009; 25: 517–522.
- 16.
Das MK, Khan B, Jacob S, Kumar A, Mahenthiran J. Significance of a fragmented QRS complex versus a Q wave in patients with coronary artery disease. Circulation 2006; 113: 2495–2501.
- 17.
Middlekauff HR, Stevenson WG, Woo MA, Moser DK, Stevenson LW. Comparison of frequency of late potentials in idiopathic dilated cardiomyopathy and ischemic cardiomyopathy with advanced congestive heart failure and their usefulness in predicting sudden death. Am J Cardiol 1990; 66: 1113–1117.
- 18.
Turitto G, Ahuja RK, Caref EB, el-Sherif N. Risk stratification for arrhythmic events in patients with nonischemic dilated cardiomyopathy and nonsustained ventricular tachycardia: Role of programmed ventricular stimulation and the signal-averaged electrocardiogram. J Am Coll Cardiol 1994; 24: 1523–1528.
- 19.
Luu M, Stevenson WG, Stevenson LW, Baron K, Walden J. Diverse mechanisms of unexpected cardiac arrest in advanced heart failure. Circulation 1989; 80: 1675–1680.
- 20.
Cuneo BF, Strasburger JF, Yu S, Horigome H, Hosono T, Kandori A, et al. In utero diagnosis of long QT syndrome by magnetocardiography. Circulation 2013; 128: 2183–2191.
- 21.
Korhonen P, Montonen J, Endt P, Makijarvi M, Trahms L, Katila T, et al. Magnetocardiographic intra-QRS fragmentation analysis in the identification of patients with sustained ventricular tachycardia after myocardial infarction. Pacing Clin Electrophysiol 2001; 24: 1179–1186.
- 22.
Korhonen P, Husa T, Tierala I, Vaananen H, Makijarvi M, Katila T, et al. Increased intra-QRS fragmentation in magnetocardiography as a predictor of arrhythmic events and mortality in patients with cardiac dysfunction after myocardial infarction. J Cardiovasc Electrophysiol 2006; 17: 396–401.
- 23.
Kandori A, Miyashita T, Ogata K, Shimizu W, Yokokawa M, Kamakura S, et al. Magnetocardiography study on ventricular depolarization-current pattern in patients with brugada syndrome and complete right-bundle branch blocks. Pacing Clin Electrophysiol 2006; 29: 1359–1367.
- 24.
Take Y, Morita H. Fragmented QRS: What is the meaning? Indian Pacing Electrophysiol J 2012; 12: 213–225.