Abstract
Background:
The
SCN5A
gene encodes the α subunit of the cardiac voltage-gated sodium channel, NaV1.5. The missense mutation, D1275N, has been associated with a range of unusual phenotypes associated with reduced NaV1.5 function, including cardiac conduction disease and dilated cardiomyopathy. Curiously, the reported biophysical properties of
SCN5A-D1275N channels vary with experimental system.
Methods and Results:
First, using a human embryonic kidney (HEK) 293 cell-based heterologous expression system, the
SCN5A-D1275N channels showed similar maximum sodium conductance but a significantly depolarizing shift of activation gate (+10 mV) compared to wild type. Second, we generated human-induced pluripotent stem cells (hiPSCs) from a 24-year-old female who carried heterozygous
SCN5A-D1275N and analyzed the differentiated cardiomyocytes (CMs). Although
SCN5A
transcript levels were equivalent between D1275N and control hiPSC-CMs, both the total amount of NaV1.5 and the membrane fractions were reduced approximately half in the D1275N cells, which were rescued by the proteasome inhibitor MG132 treatment. Electrophysiological assays revealed that maximum sodium conductance was reduced to approximately half of that in control hiPSC-CMs in the D1275N cells, and maximum upstroke velocity of action potential was lower in D1275N, which was consistent with the reduced protein level of NaV1.5.
Conclusions:
This study successfully demonstrated diminished sodium currents resulting from lower NaV1.5 protein levels, which is dependent on proteasomal degradation, using a hiPSC-based model for
SCN5A-D1275N-related sodium channelopathy.
The
SCN5A
gene encodes the pore-forming α subunit of the cardiac voltage-gated sodium channel, NaV1.5, the channel responsible for the generation and subsequent propagation of cardiac action potential (AP) through the heart.1,2
Mutations in
SCN5A
reportedly cause a variety of cardiac arrhythmia disorders, including long QT syndrome,3
Brugada syndrome,4
atrial fibrillation,5–7
sinus node dysfunction (SND)8
and cardiac conduction disease (CCD) including atrioventricular (AV) conduction block.2
Additionally, in rare cases,
SCN5A
mutations are associated with dilated cardiomyopathy (DCM).9,10
The
SCN5A
missense mutation, D1275N, has been associated with several unusual phenotypes associated with reduced sodium channel function, including DCM, SND, CCD, and atrial and ventricular tachyarrhythmias.11–13
The reported electrophysiological properties of
SCN5A-D1275N channels vary with experimental system; studies using heterologous expression systems showed no major differences between the mutant and wild-type (WT) channels,14,15
whereas peak sodium current densities were reduced in
SCN5A-D1275N knock-in mice than in WT ones.16
The functional properties of
SCN5A-D1275N channels in human cardiomyocytes (CMs) are currently unclear. Thus, the present study aimed to investigate the biophysical properties of
SCN5A-D1275N channels using human-induced pluripotent stem cell-derived CMs (hiPSC-CMs) generated from a patient with familial CCD who carried the
SCN5A-D1275N mutation. We show that
SCN5A-D1275N hiPSC-CMs exhibit reduced NaV1.5 protein expression and reduced maximum sodium conductance, which is consistent with the
SCN5A
phenotypes associated with reduced sodium channel function observed in the patient. Furthermore, treatment with the proteasome inhibitor, MG132, rescued the membrane NaV1.5 protein levels, suggesting that ubiquitin-dependent proteolysis might be the major underlying mechanism resulting in NaV1.5 loss-of-function in D1275N channels.
Editorial p 1764
Methods
SCN5A
Mutagenesis and Human Embryonic Kidney 293 Cell Transfection
Site-directed mutagenesis was used to construct the mutant
SCN5A
expression plasmid. Human embryonic kidney (HEK) 293 cells were co-transfected with plasmids encoding the human β1 subunit and either WT or D1275N-SCN5A, as described previously.7
Human-Induced Pluripotent Stem Cell (hiPSC) Generation and CM Differentiation
A 24-year-old female diagnosed with SND and an AV conduction block was screened for mutations in ion channel genes after informed consent had been obtained. hiPSCs were generated from peripheral blood mononuclear cells using an integration-free approach, by transfecting cells with episomal vectors encoding multiple reprograming factors (OCT3/4,
SOX2,
KLF4,
L-MYC,
LIN28
and a
TP53-
targeting shRNA),17
before culturing them on a mitomycin C-treated SNL feeder layer in Primate ES cell medium (ReproCELL, Tokyo, Japan); four hiPSC lines were used in this study. hiPSCs generated from a healthy individual were used as controls (201B7 and 253G1).18
CMs were differentiated from hiPSCs using an embryoid body (EB) formation protocol, as described previously.19,20
Six to eight weeks after cardiac differentiation, we analyzed hiPSC-CMs in each experiment in this study. This study was approved by the Kyoto University ethics review board and conformed to the Declaration of Helsinki.
DNA Sequencing, Karyotyping, Immunocytochemistry, Teratoma Formation
DNA sequencing, immunocytochemistry, and teratoma formation were performed using standard protocols, as described previously.19
All exons of the
SCN5A
gene were sequenced after polymerase chain reaction (PCR) amplification and compared to the reference sequence. In addition, other cardiac ion channel genes (59 in total,
Table S1), responsible for inherited arrhythmias such as LQTS, BrS, CCD, and arrhythmogenic right ventricular cardiomyopathy, were also screened by targeted gene sequencing methods using HaloPlex Target Enrichment System (Agilent Technology, CA, USA) and MiSeq system (Illumina, CA, USA). Chromosomal Q-banding analysis was performed using a standard procedure (Trans Chromosomics, Yonago, Japan). See the supplementary material section for detailed experimental methods.
Counting the Beating Rate of hiPSC-EBs
hiPSC-EBs in the chamber, heated at 37 degrees, were observed under a fluorescence microscope (Biozero BZ-9000, KEYENCE, Osaka, Japan), and the motion was recorded to analyze the beating frequency.
Purification of hiPSC-CMs
CMs were purified from hiPSC differentiation cultures using fluorescence-activated cell sorting (FACS) and an antibody that targets the CM-specific surface marker, SIRPA (BioLegend, San Diego, CA, USA).21,22
See the supplementary material section for detailed experimental methods.
mRNA Quantification Using Real-Time Polymerase Chain Reaction
SCN5A
mRNA expression in purified hiPSC-CMs was quantified using real-time PCR and TaqMan probes, as described previously.19
See the supplementary material section for detailed experimental methods.
Western Blotting
Approximately 20–40 µg total protein was extracted from 3.0×10⁵
purified CMs with TNE buffer. The relative expression of the total sodium channel protein was quantified using standard Western blotting protocols, as described previously.23
See the supplementary material section for detailed experimental methods. In order to elucidate the possible role of ubiquitin-dependent proteolysis in the negative regulation of NaV1.5, we examined the effect of the proteasome inhibitor, MG132 (Wako, Osaka, Japan). We incubate hiPSC-CMs with DMSO or 10 µmol/L MG132 for 24 h before protein extraction. NaV1.5 membrane and cytosolic proteins were obtained separately using a Mem-PERTM
Plus Membrane Protein Extraction Reagent kit (Thermo Fisher Scientific, Waltham, MA, USA), following the manufacturer’s protocol.
Electrophysiological Assays
The hiPSC-CMs were enzymatically dissociated and plated onto gelatin-coated glass coverslips. APs and voltage-gated sodium currents were recorded using a whole-cell patch-clamp technique. See the supplementary material section for detailed experimental methods.
Ca2+ Imaging
Ca2+
transients were recorded from enzymatically dispersed single hiPSC-CMs, which were electrically stimulated single cells, using a protocol described previously.19
See the supplementary material section for detailed experimental methods.
Statistical Analysis
Continuous variables are presented as the mean±standard error of measurement. Categorical variables are expressed as frequencies. Differences between group means were assessed using Student’s t-tests. Differences in categorical variable frequencies were evaluated using chi-squared tests. P<0.05 was considered statistically significant.
Results
SCN5A-WT and D1275N Channel Currents Show Minor Differences in a HEK 293 Expression System
Whole-cell sodium currents in HEK 293 cells expressing either
SCN5A-WT or -D1275N channels were recorded using patch-clamp techniques, and representative traces are shown in
Figure 1A. While cells with mutant channels displayed marginally reduced peak sodium current density compared to those with WT channels (−252±38 pA/pF vs. −326±42 pA/pF, recorded at −20 mV and −30 mV, respectively;
Figure 1B), this difference was not significantly different. There was also no significant difference in maximum sodium conductance (Gmax) between them (Gmax=3.90±0.49 S vs. 4.71±0.56 S for D1275N and WT, respectively;
Figure 1C). However,
SCN5A-D1275N channels showed a significant depolarizing shift in the steady-state activation curve compared to WT channels, with D1275N and WT exhibiting half-maximal potential values (V1/2) of −35.4±1.0 mV and −45.5±1.5 mV, respectively (P<0.001,
Figure 1D,
Table S2). The
V1/2
and slope factor of the steady-state fast inactivation curve did not differ between the two channels (Figure 1D,
Table S1).

hiPSCs were generated from a 24-year-old Japanese female suffering from recurrent dizziness. Her electrocardiogram on admission showed notable bradycardia, with a heart rate of 33 beats/min, due to sinus arrest with a junctional escape rhythm (Figure 2A). A physical examination and echocardiography revealed no abnormalities. Holter monitoring displayed recurrent long pauses of up to 12 s due to sinus pause and AV block, and a pacemaker was implanted. A family history of cardiac abnormalities was noted (Figure 2B); the patient’s father had atrial fibrillation with AV block and received a pacemaker at the age of 32 years. Her younger brother suffered from cerebral infarction and AV block at age 23 years and a pacemaker was implanted. Her father and brother had no echocardiographic abnormalities, but her asymptomatic younger sister showed borderline left ventricular enlargement. Genetic analyses identified the heterozygous
SCN5A
missense mutation, c.3823G>A, p.D1275N, in the proband, her father, younger brother, and asymptomatic younger sister (Figure 2C). We detected no other rare variants in the proband by targeted gene sequencing for 59 cardiac ion channel-related genes (Table S1). The mutant
SCN5A-D1275N residue is located in the third transmembrane region of domain III of NaV1.5 (Figure 2D). hiPSCs were successfully generated from the female patient; they exhibited characteristic human embryonic stem cell morphology and stained positively for the pluripotency markers, OCT3/4, SSEA4, and TRA-1-60 (Figure S1A). The
SCN5A-D1275N mutation was detected in the patient-derived iPSCs, but not in the controls. hiPSC pluripotency was confirmed by injecting cells into the testes of CB-17/Icr-severe combined immunodeficiency (scid)/scid Jcl mice and observing the formation of teratomas-containing tissue derived from all three germ layers (Figure S1B). The control and D1275N-hiPSC lines displayed a normal karyotype (Figure S1C).

Flow cytometric analysis of the hiPSC cultures revealed no significant difference in the proportion of non-myocyte lineage cell populations in the D1275N culture compared to the control (24.4±4.0% vs. 38.5±11.7% for D1275N and Control, respectively;
Figure S2A). Similarly, no significant difference in the proportion of cells positive for SIRPA, a cell-surface CM marker, was seen in the D1275N culture compared to the control (37.9±3.1% vs. 27.1±3.3% for D1275N and Control, respectively;
Figure S2B). D1275N and control hiPSCs were sorted by FACS using an anti-SIRPA antibody to enrich for hiPSC-CMs. The proportion of unsorted SIRPA+
and SIRPA−
cells expressing cardiac Troponin T (cTnT) in each line was then measured (Figure S2C). Substantial enrichment for cTnT+
CMs was seen in the SIRPA+
populations from both hiPSC lines compared to the unsorted cells; in the SIRPA+
population, 89.6±4.3% and 87.3±1.7% of cells from the D1275N and Control lines, respectively, were cTnT+, whereas in the unsorted population, 56.1±10.8% and 58.1±6.8% of cells from the D1275N and Control lines, respectively, were cTnT+
(Figure S2D,E). No difference in cTnT+
enrichment was seen between the 2 hiPSC lines.
Beating Rate Is Reduced in D1275N hiPSC-EBs
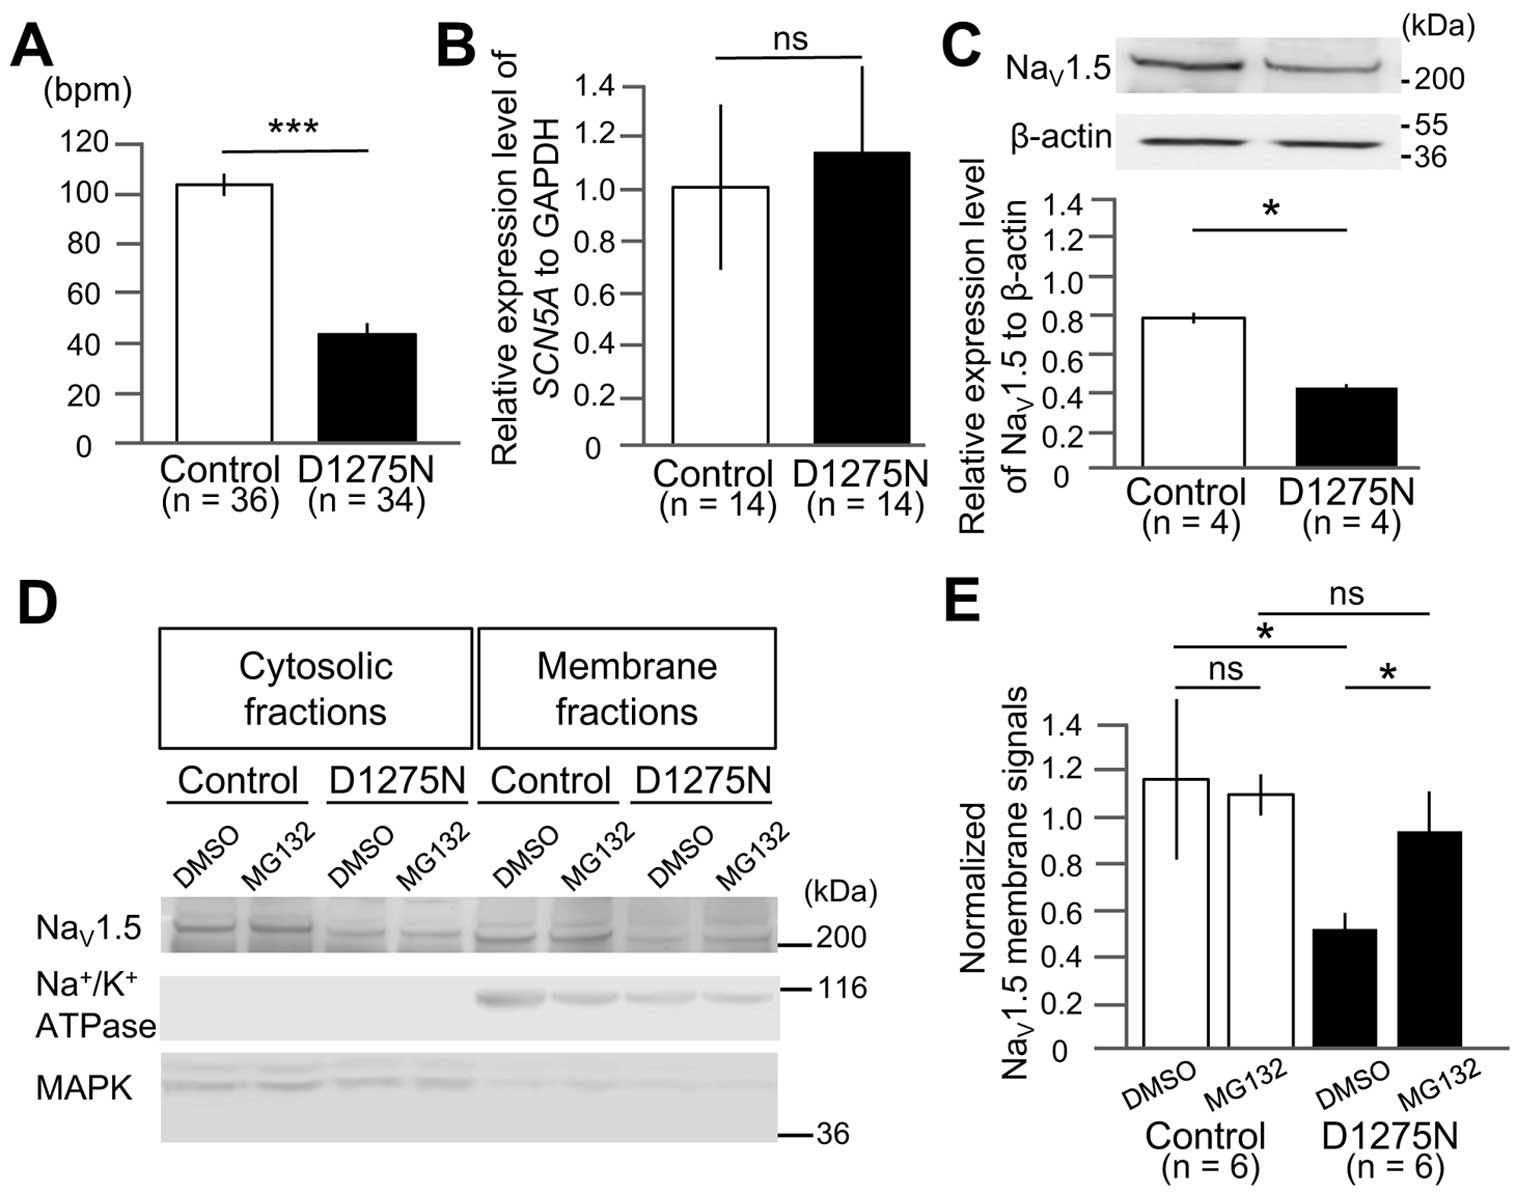
The D1275N hiPSC-EBs exhibited a significantly lower beating rate than controls (42±4 beats/min vs. 101±4 beats/min for D1275N and Control, respectively; P<0.001;
Figure 3A), which was consistent with the clinical phenotype of the proband.
D1275N hiPSC-CMs Display Lower Sodium Channel Protein Expression But Unchanged mRNA Expression
Purified D1275N and control hiPSC-CMs showed equivalent levels of
SCN5A
mRNA expression, as determined by qPCR (1.13±0.34 vs. 1.00±0.32 for D1275N and Control, respectively;
Figure 3B). Conversely, Western blot analysis of sodium channel protein expression revealed that NaV1.5 protein levels were approximately 50% lower in D1275N hiPSC-CMs compared to the controls (densitometric ratios of NaV1.5/β-actin were 0.59±0.03 vs. 1.10±0.04 for D1275N and Control, respectively; P<0.05;
Figure 3C).
Proteasome Inhibitor, MG132, Prevented the Reduction of NaV1.5 Cell Membrane Expression
Western blot analysis of membrane and cytosolic fractions of NaV1.5 revealed that the ratio of membrane/cytosolic levels were reduced to approximately half in D1275N hiPSC-CMs compared to the controls (densitometric ratios of membrane/cytosolic NaV1.5 were 0.52±0.07 vs. 1.18±0.35 for D1275N with DMSO and Control with DMSO, respectively; P<0.05;
Figure 3D,E). Notably, we found that D1275N hiPSC-CMs treated with MG132 restored NaV1.5 cell membrane expression up to those of the controls (densitometric ratio of membrane/cytosolic NaV1.5 was 0.95±0.17 for D1275N with MG132;
Figure 3D,E).
AP Max dV/dt Is Reduced in D1275N hiPSC-CMs
APs were recorded in control and D1275N hiPSC-CMs using a current clamp technique. AP traces are typically categorized as ventricular-like (V-like), atrial-like (A-like) or nodal-like (N-like) according to the criteria described in the
Supplementary Methods
section. The proportion of APs in each category varied between the control and D1275N hiPSC-CMs; control cell APs were 48% V-like, 38% A-like, and 14% N-like, whereas D1275N APs were 50% V-like, 42% A-like, and 8% N-like (Figure 4A,B). Furthermore, the max dV/dt was significantly lower in D1275N hiPSC-CMs than in Controls (12.6±1.2 mV/ms vs. 26.2±5.7 mV/ms in D1275N and Control, respectively, at 1 Hz (P<0.01), and 11.0±1.6 mV/ms vs. 20.4±3.1 mV/ms in D1275N and Control, respectively, at 2 Hz (P<0.01);
Figure 4C, Table 1). Other AP parameters, including maximum diastolic potential, AP amplitude, and AP duration measured at 50% (APD50) and 90% (APD90), did not differ significantly between the hiPSC-CM lines, when pacing was set at 1 or 2 Hz (Table 1).

Table 1.
AP Parameters in Control and D1275N hiPSC-CMs
| AP parameters |
1-Hz pacing |
2-Hz pacing |
Control
(n=6) |
D1275N
(n=8) |
Control
(n=6) |
D1275N
(n=8) |
| MDP (mV) |
−58±2.4 |
−60±1.4 |
−58±2.4 |
−58±1.2 |
| APA (mV) |
97±4.4 |
97±2.9 |
94±3.2 |
89±3.0 |
| Max dV/dt (mV/ms) |
26.2±5.7 |
12.6±1.2† |
20.4±3.1 |
11.0±1.6† |
| APD 50 (ms) |
177±33 |
148±31 |
113±19 |
99±22 |
| APD 90 (ms) |
215±37 |
173±34 |
145±22 |
123±23 |
†P<0.01 vs. Control. AP, action potential; APA, AP amplitude; APD, AP duration; CM, cardiomyocyte; hiPSC, human-induced pluripotent stem cell; Max dV/dt, maximum rate of rise of the AP upstroke; MDP, maximum diastolic potential. The number of experiments is indicated in parentheses. Data are presented as mean±standard error of measurement.
Sodium currents were recorded for Control and D1275N hiPSC-CMs. The peak sodium current densities in the D1275N hiPSC-CMs were approximately half those of Control cells (−117±16 pA/pF vs. −206±25 pA/pF at −20 mV for D1275N and Control cells, respectively); a highly significant difference (P<0.001;
Figure 5A,B). And the
Gmax
of the sodium channel was also reduced in the D1275N hiPSC-CMs compared to Control cells (Gmax=2.31±0.33 S vs. 3.53±0.35 S for D1275N and Control, respectively; P<0.05;
Figure 5C). Considering the sodium current kinetics, the D1275N hiPSC-CMs exhibited a slight, but significant, depolarizing shift of the steady-state activation curve of 4 mV relative to the Controls (V1/2=−33.1±1.2 mV vs. −37.1±1.1 mV for D1275N and Control, respectively; P<0.05;
Figure 6A). However, other gating parameters, including steady-state inactivation, recovery from inactivation, the onset of slow inactivation, and closed-state inactivation, did not differ significantly between the D1275N and Control hiPSC-CMs (Figure 6B–D, Table 2).
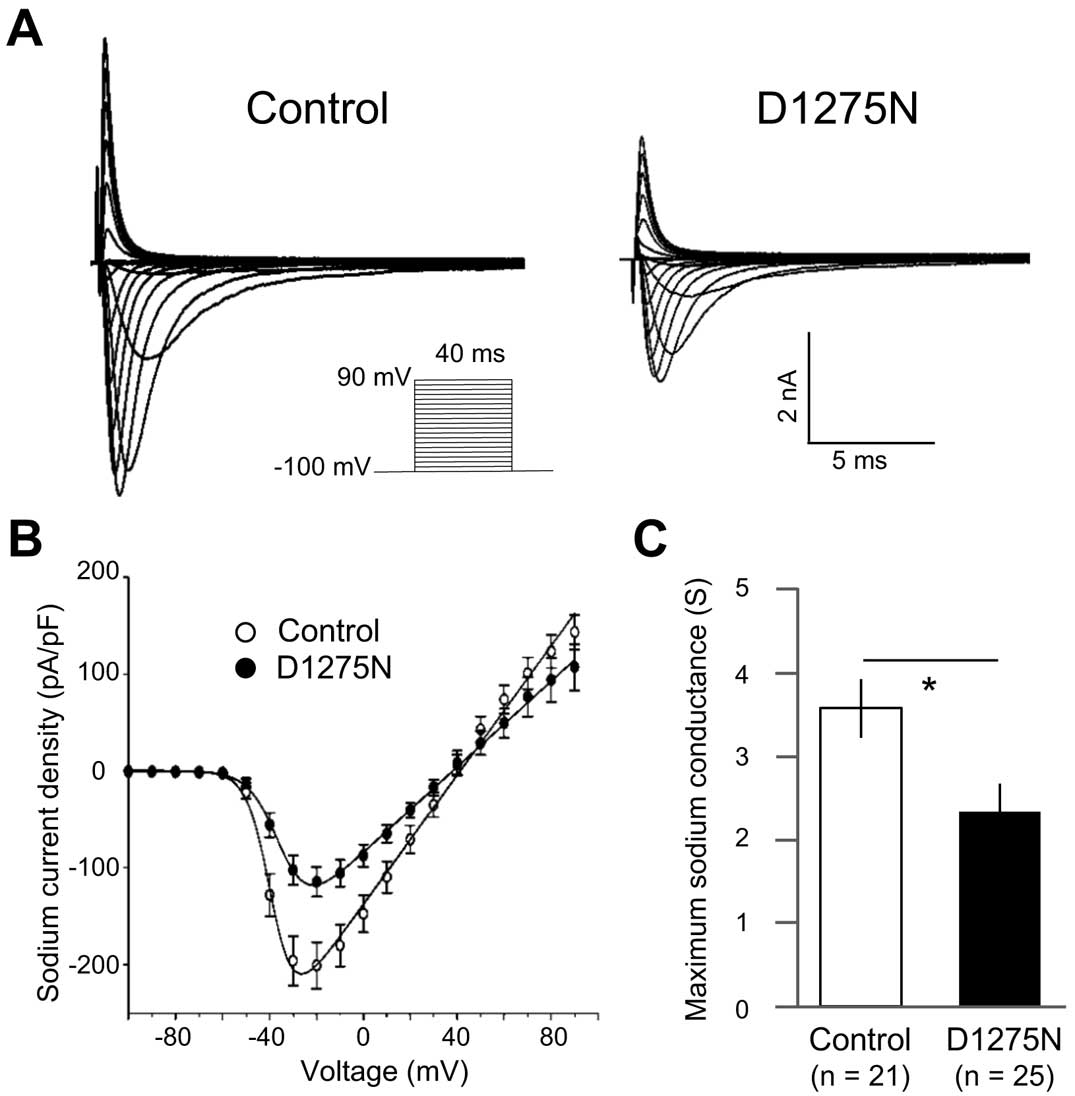
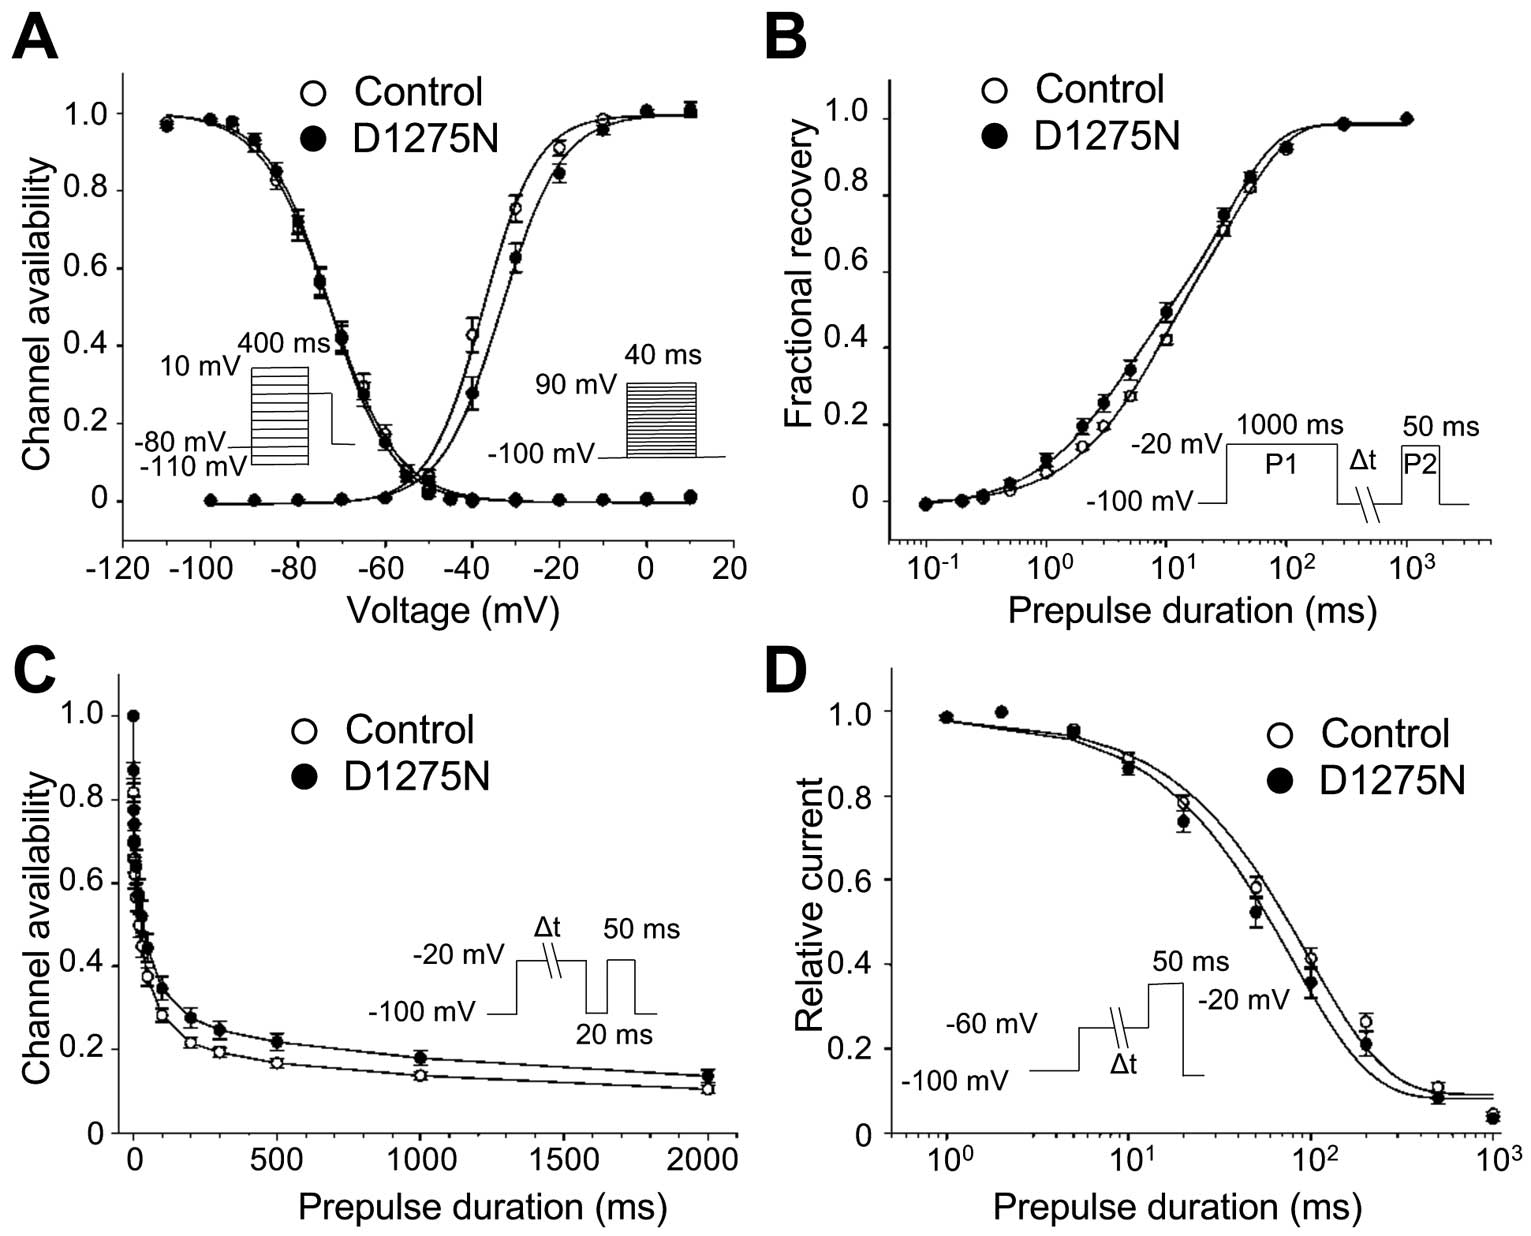
Table 2.
Sodium Channel Gating Parameters in Control and D1275N hiPSC-CMs
| |
Control |
D1275N |
| Peak INa density |
(n=21) |
(n=25) |
| |
−206±25 |
−117±16† |
| Steady-state activation |
| V1/2 |
−37.1±1.1 |
−33.1±1.2‡ |
| k |
5.4±0.3 |
5.9±0.3 |
| Steady-state fast inactivation |
(n=21) |
(n=25) |
| V1/2 |
−72.6±1.2 |
−72.7±1.1 |
| k |
6.9±0.2 |
6.3±0.1 |
| Recovery from inactivation |
(n=12) |
(n=12) |
| Af |
0.38±0.03 |
0.40±0.02 |
| As |
0.62±0.03 |
0.60±0.02 |
| τf (ms) |
59.6±6.8 |
43.9±7.4 |
| τs (ms) |
404.2±28.6 |
348.9±29.1 |
| Onset of slow inactivation |
(n=11) |
(n=11) |
| A |
0.64±0.02 |
0.64±0.01 |
| τ (ms) |
30.6±4.6 |
41.5±6.5 |
| Closed-state inactivation |
(n=20) |
(n=18) |
| A |
0.91±0.01 |
0.93±0.01 |
| τ (ms) |
103.5±9.1 |
91.1±12.7 |
†P<0.001 vs. Control, ‡P<0.05 vs. Control. Parameters were obtained from fitting individual experiments, as illustrated in Figure 5. τ, time constant; A, fractional amplitude; INa, sodium current;
k, slope factor;
V1/2, half-maximal potential. Other abbreviations as in Table 1. The number of experiments is indicated in parentheses. Data are presented as mean±standard error of measurement.
We performed Ca2+
transient recordings of the D1275N and Control hiPSC-CMs under electrical field stimulation. There was no significant difference in the frequency of diastolic Ca2+
waves between the D1275N and Control cells. After 100 nmol/L isoproterenol administration, the frequency of diastolic Ca2+
waves slightly increased but there was no significant difference between them (Figure S3A,B). We also assessed the Ca2+
transient properties associated with the contraction of CMs, such as Ca2+
transient amplitude, maximal upstroke velocity (Vmax
upstroke), Vmax
upstroke time to peak, and Ca2+
transient duration at 90% decay (CTD 90).24
Isoproterenol administration slightly, but not significantly, shortened Vmax
upstroke time and CTD90 in both cells. We found no significant differences in all measurements between the D1275N and Control hiPSC-CM before and after isoproterenol administration (Figure S3C).
Discussion
The
SCN5A
mutation, D1275N, has been associated with left ventricular dysfunction and a wide variety of arrhythmia disorders. The
SCN5A-D1275N mutation was first identified in a large Dutch family suffering from atrial standstill,14
then shortly afterwards the same mutation was discovered in a large European family with CCD, atrial and ventricular tachyarrhythmia, and DCM.11,12
To date,
SCN5A-D1275N has been reportedly associated with a wide variety of arrhythmias, with or without DCM.13,25
Functional studies into the electrophysiology of
SCN5A-D1275N channels have reported contradictory results. Some studies using heterologous expression systems such as
Xenopus
oocytes, Chinese hamster ovary cells, or tsA201 cells, showed no major differences in the peak sodium current densities and sodium channel kinetics of WT and D1275N channels,14,16
whereas another study using
Xenopus
oocytes and HEK 293 cells found a reduction in peak sodium current densities in D1275N channels.15
Recently, a study using a human
SCN5A-D1275N knock-in mouse model reported that sodium channel protein levels and peak sodium current densities were lower in D1275N knock-in mice than in Controls.16
Additionally, a study using a transgenic zebrafish model of
SCN5A-D1275N demonstrated reduced heart rate, sinus pause, and AV block.26
In order to assess the biophysical properties of
SCN5A-D1275N channels in a human CM model, we generated hiPSCs from a patient carrying
SCN5A-D1275N who had presented with SND and an AV block. The D1275N hiPSC-CMs exhibited reduced maximum sodium conductance and lower sodium channel protein expression, which is consistent with both the patient’s clinical symptoms and the knock-in mouse model observations.
D1275N channel protein levels were reduced whereas mRNA expression was unaffected in our hiPSC model, suggesting that dysfunctional post-translational regulation, perhaps through enhanced degradation27,28
or trafficking defects,15
caused the reduction in surface protein expression. Furthermore, several proteins reportedly interact with and regulate the expression of NaV1.5 protein in CMs; MOG1 and ankyrin-G are associated with NaV1.5 cell surface expression,28,29
Nedd4-2 catalyzes NaV1.5 ubiquitination30
and degradation,27
and dystrophin mediates NaV1.5 stability via syntrophin adaptor proteins.31
Moreover, a study in a HEK 293 system showed that the neuronal sodium channel protein, NaV
1.8, encoded by
SCN10A, participates in NaV1.5 regulation via direct protein-protein interactions.32
In this study, the reduced expression of NaV1.5 in D1275N-hiPSC-CMs was restored by the proteasome inhibitor, MG132, treatment suggesting that ubiquitin-dependent proteolysis might be the major underlying mechanism resulting in NaV1.5 loss-of-function in D1275N channels.27,30
It is possible that differing expression of NaV1.5-interacting proteins between the experimental systems could be responsible for the inconsistencies in the reported biophysical properties of D1275N channels. Our patient-derived hiPSC-CM model is therefore useful in the investigation of
SCN5A-D1275N-mediated cardiac sodium channelopathy.
The
SCN5A-D1275N mutation is unique because it is associated with both arrhythmias and the DCM phenotype.9,10
The pathogenic mechanisms of
SCN5A-associated DCM, arrhythmia-mediated cardiomyopathy, disordered intracellular sodium homeostasis, and the disruption of sodium channel-protein interactions were discussed previously.33
An investigation into disordered intracellular sodium homeostasis in isolated guinea pig CMs found that sodium currents contributed to the generation of calcium transients by the sarcoplasmic reticulum via the reverse-mode sodium–calcium exchanger,34
suggesting that
SCN5A
loss-of-function mutations might reduce the amplitude of calcium transients, resulting in negative cardiac inotropic effects. Additionally, a sodium channel defect was found to be associated with cardiac fibrosis, causing left ventricular dysfunction, and
SCN5A-knockout mice demonstrated cardiomyopathy and cardiac fibrosis.35
Consistent with this, tissue samples from the right ventricular outflow tract of patients with Brugada syndrome carrying
SCN5A
mutations, exhibited epicardial and myocardial fibrosis.36
In our hiPSC model, we found no significant difference in Ca2+
transient measurements between the D1275N and Control cells. Further investigations are needed to elucidate the causing mechanism of
SCN5A-related DCM.
The reduced max dV/dt seen in the AP recordings for our D1275N-hiPSC model is consistent with the CCD phenotype observed in the patient. The proband also exhibited SND, and the relationship between this and reduced sodium channel function has been studied extensively. One hypothesis is that
SCN5A-linked SND is caused by conduction block from the sinus node to the adjacent atrial myocardium,2
while another study using
SCN5A-knockout mice suggested that fibrotic changes in the sinus node are responsible for age-dependent SND.37
We observed a lower spontaneous beating rate in D1275N-EBs than in the Controls. We should carefully extrapolate these results to in vivo systems because the EBs consisted of multiple cell types, including V-like, A-like, and N-like CMs, and because hiPSC-CMs are immature compared to adult CMs;38
the lower spontaneous beating rate is reminiscent of bradycardia and could be due to attenuated sodium currents causing defective AP propagation between CMs.
Study Limitations
In the present study, there is a racial difference between the D1275N and Control iPSCs, and they were generated by different reprograming protocols. We cannot exclude the possibility that phenotypes can be associated with unrecognized genetic variants.
Conclusions
We established a hiPSC-based model for
SCN5A-D1275N-related sodium channelopathy, and successfully demonstrated reduced maximum sodium conductance resulting from reduced NaV1.5 protein expression, which is dependent on proteasomal degradation. Our hiPSC-based model could be valuable in mechanistic investigations of the diverse phenotypes resulting from this mutation.
Acknowledgments
This work was supported by JSPS KAKENHI, Grant Number 25461054 (T.M.), and the Suzuken Memorial Foundation (T. Kimura).
The authors would like to thank the proband and her family for their participation in this study. We are also grateful to Kyoko Yoshida, Masako Tanaka, and Aya Umehara for their technical assistance.
Disclosures
Y. Yoshida owns stock in iPS Portal. All other authors have reported they have no relationships relevant to the contents of this paper to disclose.
Supplementary Files
Supplementary File 1
Supplementary Methods
Figure S1.
Characterization of D1275N-human-induced pluripotent stem cells (hiPSCs).
Figure S2.
Enrichment of cardiomyocytes (CMs) using fluorescence-activated cell sorting (FACS).
Figure S3.
Ca2+
imaging in the D1275N and Control human-induced pluripotent stem cells (hiPSC)-cardiomyocytes (CMs).
Table S1.
Fifty-nine target genes screened by using next-generation sequencing
Table S2.
Sodium channel gating parameters in WT and D1275N HEK 293 cells
Please find supplementary file(s);
http://dx.doi.org/10.1253/circj.CJ-17-0064
References
- 1.
Balser JR. Structure and function of the cardiac sodium channels. Cardiovasc Res 1999; 42: 327–338.
- 2.
Benson DW, Wang DW, Dyment M, Knilans TK, Fish FA, Strieper MJ, et al. Congenital sick sinus syndrome caused by recessive mutations in the cardiac sodium channel gene (SCN5A). J Clin Invest 2003; 112: 1019–1028.
- 3.
Wang Q, Shen J, Splawski I, Atkinson D, Li Z, Robinson JL, et al. SCN5A mutations associated with an inherited cardiac arrhythmia, long QT syndrome. Cell 1995; 80: 805–811.
- 4.
Bezzina C, Veldkamp MW, van Den Berg MP, Postma AV, Rook MB, Viersma JW, et al. A single Na(+) channel mutation causing both long-QT and Brugada syndromes. Circ Res 1999; 85: 1206–1213.
- 5.
Ellinor PT, Nam EG, Shea MA, Milan DJ, Ruskin JN, MacRae CA. Cardiac sodium channel mutation in atrial fibrillation. Heart Rhythm 2008; 5: 99–105.
- 6.
Darbar D, Kannankeril PJ, Donahue BS, Kucera G, Stubblefield T, Haines JL, et al. Cardiac sodium channel (SCN5A) variants associated with atrial fibrillation. Circulation 2008; 117: 1927–1935.
- 7.
Makiyama T, Akao M, Shizuta S, Doi T, Nishiyama K, Oka Y, et al. A novel SCN5A gain-of-function mutation M1875T associated with familial atrial fibrillation. J Am Coll Cardiol 2008; 52: 1326–1334.
- 8.
Schott JJ, Alshinawi C, Kyndt F, Probst V, Hoorntje TM, Hulsbeek M, et al. Cardiac conduction defects associate with mutations in SCN5A. Nat Genet 1999; 23: 20–21.
- 9.
Bezzina CR, Rook MB, Groenewegen WA, Herfst LJ, van der Wal AC, Lam J, et al. Compound heterozygosity for mutations (W156X and R225 W) in SCN5A associated with severe cardiac conduction disturbances and degenerative changes in the conduction system. Circ Res 2003; 92: 159–168.
- 10.
Frigo G, Rampazzo A, Bauce B, Pilichou K, Beffagna G, Danieli GA, et al. Homozygous SCN5A mutation in Brugada syndrome with monomorphic ventricular tachycardia and structural heart abnormalities. Europace 2007; 9: 391–397.
- 11.
McNair WP, Ku L, Taylor MR, Fain PR, Dao D, Wolfel E, et al. SCN5A mutation associated with dilated cardiomyopathy, conduction disorder, and arrhythmia. Circulation 2004; 110: 2163–2167.
- 12.
Olson TM, Michels VV, Ballew JD, Reyna SP, Karst ML, Herron KJ, et al. Sodium channel mutations and susceptibility to heart failure and atrial fibrillation. JAMA 2005; 293: 447–454.
- 13.
Laitinen-Forsblom PJ, Makynen P, Makynen H, Yli-Mayry S, Virtanen V, Kontula K, et al. SCN5A mutation associated with cardiac conduction defect and atrial arrhythmias. J Cardiovasc Electrophysiol 2006; 17: 480–485.
- 14.
Groenewegen WA, Firouzi M, Bezzina CR, Vliex S, van Langen IM, Sandkuijl L, et al. A cardiac sodium channel mutation cosegregates with a rare connexin40 genotype in familial atrial standstill. Circ Res 2003; 92: 14–22.
- 15.
Gui J, Wang T, Jones RP, Trump D, Zimmer T, Lei M. Multiple loss-of-function mechanisms contribute to SCN5A-related familial sick sinus syndrome. PLoS One 2010; 5: e10985.
- 16.
Watanabe H, Yang T, Stroud DM, Lowe JS, Harris L, Atack TC, et al. Striking in vivo phenotype of a disease-associated human SCN5A mutation producing minimal changes in vitro. Circulation 2011; 124: 1001–1011.
- 17.
Okita K, Yamakawa T, Matsumura Y, Sato Y, Amano N, Watanabe A, et al. An efficient nonviral method to generate integration-free human-induced pluripotent stem cells from cord blood and peripheral blood cells. Stem Cells 2013; 31: 458–466.
- 18.
Takahashi K, Yamanaka S. Induction of pluripotent stem cells from mouse embryonic and adult fibroblast cultures by defined factors. Cell 2006; 126: 663–676.
- 19.
Sasaki K, Makiyama T, Yoshida Y, Wuriyanghai Y, Kamakura T, Nishiuchi S, et al. Patient-specific human induced pluripotent stem cell model assessed with electrical pacing validates S107 as a potential therapeutic agent for catecholaminergic polymorphic ventricular tachycardia. PLoS One 2016; 11: e0164795.
- 20.
Yang L, Soonpaa MH, Adler ED, Roepke TK, Kattman SJ, Kennedy M, et al. Human cardiovascular progenitor cells develop from a KDR+ embryonic-stem-cell-derived population. Nature 2008; 453: 524–528.
- 21.
Dubois NC, Craft AM, Sharma P, Elliott DA, Stanley EG, Elefanty AG, et al. SIRPA is a specific cell-surface marker for isolating cardiomyocytes derived from human pluripotent stem cells. Nat Biotechnol 2011; 29: 1011–1018.
- 22.
Miki K, Endo K, Takahashi S, Funakoshi S, Takei I, Katayama S, et al. Efficient detection and purification of cell populations using synthetic microRNA switches. Cell Stem Cell 2015; 16: 699–711.
- 23.
Horie T, Baba O, Kuwabara Y, Chujo Y, Watanabe S, Kinoshita M, et al. MicroRNA-33 deficiency reduces the progression of atherosclerotic plaque in ApoE−/− mice. J Am Heart Assoc 2012; 1: e003376.
- 24.
Lee YK, Ng KM, Lai WH, Chan YC, Lau YM, Lian Q, et al. Calcium homeostasis in human induced pluripotent stem cell-derived cardiomyocytes. Stem Cell Rev 2011; 7: 976–986.
- 25.
Abe K, Machida T, Sumitomo N, Yamamoto H, Ohkubo K, Watanabe I, et al. Sodium channelopathy underlying familial sick sinus syndrome with early onset and predominantly male characteristics. Circ Arrhythm Electrophysiol 2014; 7: 511–517.
- 26.
Huttner IG, Trivedi G, Jacoby A, Mann SA, Vandenberg JI, Fatkin D. A transgenic zebrafish model of a human cardiac sodium channel mutation exhibits bradycardia, conduction-system abnormalities and early death. J Mol Cell Cardiol 2013; 61: 123–132.
- 27.
van Bemmelen MX, Rougier JS, Gavillet B, Apotheloz F, Daidie D, Tateyama M, et al. Cardiac voltage-gated sodium channel Nav1.5 is regulated by Nedd4-2 mediated ubiquitination. Circ Res 2004; 95: 284–291.
- 28.
Detta N, Frisso G, Salvatore F. The multi-faceted aspects of the complex cardiac Nav1.5 protein in membrane function and pathophysiology. Biochim Biophys Acta 2015; 1854: 1502–1509.
- 29.
Chakrabarti S, Wu X, Yang Z, Wu L, Yong SL, Zhang C, et al. MOG1 rescues defective trafficking of Na(v)1.5 mutations in Brugada syndrome and sick sinus syndrome. Circ Arrhythm Electrophysiol 2013; 6: 392–401.
- 30.
Rougier JS, Gavillet B, Abriel H. Proteasome inhibitor (MG132) rescues Nav1.5 protein content and the cardiac sodium current in dystrophin-deficient mdx (5cv) mice. Front Physiol 2013; 4: 51.
- 31.
Gavillet B, Rougier JS, Domenighetti AA, Behar R, Boixel C, Ruchat P, et al. Cardiac sodium channel Nav1.5 is regulated by a multiprotein complex composed of syntrophins and dystrophin. Circ Res 2006; 99: 407–414.
- 32.
Hu D, Barajas-Martinez H, Pfeiffer R, Dezi F, Pfeiffer J, Buch T, et al. Mutations in SCN10A are responsible for a large fraction of cases of Brugada syndrome. J Am Coll Cardiol 2014; 64: 66–79.
- 33.
Nguyen TP, Wang DW, Rhodes TH, George AL Jr. Divergent biophysical defects caused by mutant sodium channels in dilated cardiomyopathy with arrhythmia. Circ Res 2008; 102: 364–371.
- 34.
Leblanc N, Hume JR. Sodium current-induced release of calcium from cardiac sarcoplasmic reticulum. Science 1990; 248: 372–376.
- 35.
Royer A, van Veen TA, Le Bouter S, Marionneau C, Griol-Charhbili V, Leoni AL, et al. Mouse model of SCN5A-linked hereditary Lenegre’s disease: Age-related conduction slowing and myocardial fibrosis. Circulation 2005; 111: 1738–1746.
- 36.
Nademanee K, Raju H, de Noronha SV, Papadakis M, Robinson L, Rothery S, et al. Fibrosis, Connexin-43, and conduction abnormalities in the Brugada syndrome. J Am Coll Cardiol 2015; 66: 1976–1986.
- 37.
Hao X, Zhang Y, Zhang X, Nirmalan M, Davies L, Konstantinou D, et al. TGF-beta1-mediated fibrosis and ion channel remodeling are key mechanisms in producing the sinus node dysfunction associated with SCN5A deficiency and aging. Circ Arrhythm Electrophysiol 2011; 4: 397–406.
- 38.
Kamakura T, Makiyama T, Sasaki K, Yoshida Y, Wuriyanghai Y, Chen J, et al. Ultrastructural maturation of human-induced pluripotent stem cell-derived cardiomyocytes in a long-term culture. Circ J 2013; 77: 1307–1314.