Abstract
Background:
Although aortic valve intervention is recommended for virtually all symptomatic patients with aortic stenosis (AS), how urgently the intervention should be performed remains controversial. The aim of this study was thus to determine whether the preload reserve in response to leg-positive pressure (LPP) maneuver could serve for decision-making for AS patients awaiting aortic valve intervention.
Methods and Results:
Sixty-eight patients with symptomatic AS, who were referred for aortic valve intervention, were recruited. Stroke volume (SV) was assessed by means of pulsed-wave Doppler, and the ratio between transmitral E wave and mitral annular velocity (e’) was calculated to estimate ventricular filling pressure. While waiting for intervention, 11 patients experienced preoperative cardiac events. During acute preload stress, forward SV for patients without cardiac events increased significantly (from 43±9 to 49±10 mL/m2, P<0.01) along with a minimal change in filling pressure (E/e’: from 20±8 to 21±9, NS). For patients with cardiac events, the Frank-Starling mechanism was significantly impaired (SVi: from 40±9 to 38±7 mL/m2, NS), while filling pressure increased to the critical level (E/e’: from 24±8 to 31±8, P<0.001). Both the patients without flow reserve (∆SVi <4.5 mL/m2) and those without diastolic reserve (∆E/e’ ≥2.9) exhibited significantly worse event-free survival than the others (P<0.05, respectively).
Conclusions:
Assessment of preload reserve during LPP stress could facilitate risk stratification of patients with severe AS waiting for aortic valve intervention.
The natural history of aortic stenosis (AS) generally begins with a long-term asymptomatic latent period, then cardiac symptoms develop in association with valve obstruction.1
Although the prognosis for patients with asymptomatic AS is known to be generally good, even for those with severe AS,2
the mortality rate of these patients dramatically increases after the development of even mild cardiac symptoms.3
Aortic valve intervention (i.e., surgical aortic valve replacement (AVR), transcatheter AVR, or balloon aortic valvuloplasty) is thus recommended for virtually all symptomatic patients with severe AS and should be performed promptly after the onset of symptoms.4
On the other hand, the risk stratification of individual symptomatic AS patients for unfavorable outcome has not been fully elucidated, and how urgently aortic valve intervention should be performed for these patients remains controversial. For this reason, improvement in the accuracy of selection of symptomatic, severe AS patients who are in special need of early interventions is urgently required.
A novel preload stress echocardiographic technique using the leg-positive pressure (LPP) maneuver was recently reported to reproduce the volume central shift and may thus reveal the preload reserve for patients with chronic heart failure (HF).5,6
Because the preload reserve functions to increase the forward stroke volume (SV) in response to the increased preload without elevating ventricular filling pressure, the preload reserve can be regarded as the integrated function of both the contractile reserve and diastolic reserve.
The objective of this study was to test the hypothesis that the assessment of preload reserve using LPP stress could contribute to risk stratification of patients with symptomatic AS who are scheduled for aortic valve intervention.
Methods
Study Populations
We prospectively recruited 76 patients with symptomatic severe AS who were referred to Kobe University Hospital for aortic valve intervention between March 2014 and February 2017, as well as 10 age- and sex-matched normal controls. Predominant presenting symptom was angina on effort, history of syncope, and dyspnea on effort.
The patients excluded from the study were those with: (1) uncontrolled hypertension; (2) life-threatening ventricular arrhythmias; (3) unstable HF symptoms with NYHA functional class IV; (4) the presence of significant coronary artery stenosis, determined by means of stress myocardial perfusion scintigraphy or coronary angiography (defined as >75% narrowing in at least 1 major epicardial coronary artery); (5) unstable angina; (6) greater than moderate severity of other valvular heart diseases; (7) heavy mitral annular calcification (MAC); (8) history of venous thrombosis; and (9) severe orthopedic traumatic disease and active skin lesions in the lower limbs.
At the time of enrolment, all patients were in a clinically stable condition and undergoing optimal and maximally tolerated pharmacological therapy. This protocol was registered with University Hospital Medical Information Network Clinical Trial Registry (registration no. UMIN000022391), and conformed to the principles outlined in the Declaration of Helsinki. This study was approved by the local institutional ethics committee, and written informed consent was given by all subjects.
Standard Echocardiographic Examination
All echocardiographic studies were performed with commercially available echocardiography systems (Aplio Artida; Toshiba Medical Systems, Tochigi, Japan). Digital routine gray-scale cine loops from 3 consecutive beats were obtained during end-expiratory apnea from the standard left ventricular (LV) parasternal and apical views. Standard LV measurements were obtained in accordance with the current guidelines of the European Association of Cardiovascular Imaging/the American Society of Echocardiography.7
LV volumes and ejection fraction (LVEF) were calculated by the modified biplane Simpson’s method, and LV mass (LVM) was estimated from the Devereux formula.8
The early diastolic (E) and atrial wave (A) velocities, as well as the E-wave deceleration time, were measured on pulsed-wave Doppler recordings from the apical long-axis view. Early diastolic (e’) mitral annular velocities were measured by spectral tissue Doppler imaging, and the E/e’ ratio was then calculated to estimate LV filling pressure.9
Forward SV was assessed by means of pulsed-wave Doppler positioned at the LV outflow tract. Cardiac output was then calculated as the product of SV and heart rate, and all volumes and LVM measurements were normalized to body surface area (BSA). All echocardiographic data were analyzed in random order by 1 observer who was blinded to the clinical data. For patients with atrial fibrillation, measurements of echocardiographic parameters were obtained as averages of more than 3 cycles when the preceding RR interval/pre-preceding RR interval were equal.10,11
Assessment of AS
The maximal aortic jet velocity was recorded with the multiple echo windows that yielded the highest velocity signal. The maximal and mean pressure gradients (PG) across the aortic valve were calculated with a modified Bernoulli equation, and the aortic valve area (AVA) was estimated from the continuity equation, after which AVA was normalized to BSA (AVAi). Definition of AS was based on the recommendations by the American Heart Association and American College of Cardiology,4,12
and severe AS was defined in relation to AVAi (<0.6 cm2/m2). As a measure of global LV afterload, valvulo-arterial impedance (Zva) was calculated by dividing the sum of systolic blood pressure and mean transvalvular gradient by the SV index (SVi).13
Speckle-Tracking Strain Analysis
Speckle-tracking strain analysis was performed for each patient with the aid of dedicated software (Ultra Extend; Toshiba Medical Systems) by a single experienced operator blinded to the patients’ medical data. Speckle-tracking longitudinal strain was assessed from the standard 3 apical views as previously described in detail.14,15
The average values of the longitudinal strain from 3 apical views were calculated to obtain the global longitudinal strain (GLS)7
and was expressed as an absolute value. LV dyssynchrony was also assessed by means of longitudinal speckle-tracking strain, and the dyssynchrony index was determined as the standard deviation of time-to-peak strain from 18 LV segments.14,15
Preload Stress Echocardiography Using LPP Maneuver
For preload stress echocardiography, we used a commercially available LPP machine (Dr. Medomer DM-5000EX, Medo Industries Co., Ltd., Tokyo, Japan). The procedure of LPP stress has been described in detail.6
Briefly, the device is designed to provide a continuous external pressure around both lower limbs at 90 mmHg pressure. The findings from preliminary invasive hemodynamic studies have proven that this pressure provides an effective increase in ventricular preload without a significant increase in either heart rate or blood pressure.5,6
Echocardiographic measurements were obtained at both rest and during LPP stress, and the changes in the echocardiographic parameters were then calculated as the absolute difference and expressed as delta (∆). Flow reserve and diastolic reserve were defined as the absolute changes between baseline forward SV and E/e’ ratio and their values obtained during LPP stress (∆SV and ∆E/e’, respectively). ECGs, blood pressure, and heart rate were monitored during the entire procedure.
Endpoints and Clinical Follow-up
Predefined adverse cardiac events were prespecified as primary endpoints of death from or hospitalization for deteriorating HF or sudden cardiac death while waiting for an aortic valve intervention. The median follow-up period was 40 days (range: 17–165 days).
Statistical Analysis
Continuous variables are expressed as mean values and standard deviation for normally distributed data and as the median and interquartile range for non-normally distributed data. Categorical variables are expressed as frequencies and percentages. The parameters of subgroups were compared by Student’s t test or Mann-Whitney U test as appropriate. Proportional differences were evaluated by means of Fisher’s exact test or the χ2
test as appropriate. Correlation analysis was performed using linear regression and expressed using Pearson’s correlation coefficients. The event-free survival curves were established using Kaplan-Meier curves and compared with the aid of the log-rank test. The initial univariate Cox proportional-hazards analysis to identify univariate predictors of the primary endpoint was followed by a multivariate Cox proportional-hazards model using stepwise selection, with the P levels for entry into the model set at <0.05. Nested Cox models were constructed to determine the incremental prognostic advantage for the prediction of the primary endpoint of diastolic reserve and flow reserve during LPP stress over that of AS severity, serum B-type natriuretic peptide (BNP) concentration, and baseline GLS. A statistically significant increase in the global log-likelihood χ2
of the model was defined as an increment in prognostic value. The associations of baseline echocardiographic parameters with lack of response in forward SV and with significant elevation of E/e’ during LPP stress were severally identified by logistic regression models. For all steps, a P value <0.05 was regarded as statistically significant. All analyses were performed with MedCalc version 14.10.2 (MedCalc Software; Mariakerke, Belgium).
Results
Baseline Characteristics
Of the 76 patients who met all inclusion criteria, 6 (8%) with suboptimal images and 2 (3%) with sigmoid septum or obstruction at the LV outflow tract were excluded. The 68 remaining patients, (angina in 18 (26%), syncope in 9(13%), and dyspnea in 41 (60%)) for whom baseline echocardiographic and clinical follow-up data were available constituted the final study group.
The baseline clinical and echocardiographic characteristics of the 68 AS patients and 10 age- and sex-matched normal controls are summarized in
Table 1. As expected, patients with AS exhibited significant LV concentric hypertrophy together with reduced forward SV in comparison with normal controls. With respect to LV systolic function, baseline GLS proved to be significantly smaller for patients with AS (16.5±1.5 vs. 9.4±2.6%, P<0.001) despite equivalent baseline LVEF. In addition, although the baseline E/A ratio was quite similar for these 2 groups, the E/e’ ratio was significantly higher for patients with AS (12±2 vs. 21±8, P<0.05).
Table 1.
Baseline Clinical and Echocardiographic Characteristics of Study Group Undergoing Leg-Positive Pressure Maneuver
| Variables |
Normal controls
(n=10) |
All AS patients
(n=68) |
Patients with cardiac
event (n=11) |
Patients without
cardiac event (n=57) |
| Clinical parameters |
| Age, years |
79±5 |
81±8 |
86±8 |
80±7† |
| Sex, male/female |
6/4 |
30/38 |
3/8 |
27/30 |
| Systolic blood pressure, mmHg |
140±19 |
135±20 |
128±26 |
137±19 |
| Diastolic blood pressure, mmHg |
71±11 |
68±13 |
61±8 |
69±13† |
| STS-PROM score, % |
– |
7.59±4.50 |
8.80±4.11 |
7.23±4.61 |
| NYHA (class II/III) |
0/0 |
52/16* |
6/5 |
46/11 |
| Past medical history, n (%) |
| Atrial fibrillation |
0 (0) |
9 (13) |
3 (27) |
6 (11) |
| Hypertension |
0 (0) |
60 (88)* |
9 (82) |
51 (89) |
| Diabetes mellitus |
0 (0) |
24 (35)* |
4 (36) |
20 (35) |
| Dyslipidemia |
0 (0) |
30 (44)* |
3 (27) |
27 (47) |
| Old myocardial infarction |
0 (0) |
15 (22) |
2 (18) |
13 (23) |
| B-type natriuretic peptide, pg/mL |
53 (23–90) |
223 (79–444)* |
647 (271–1,061) |
134 (74–357)† |
| Creatinine, mg/dL |
0.9±0.3 |
1.0±0.4 |
1.0±0.4 |
1.0±0.4 |
| eGFR, mL/min/1.73 m2 |
60±21 |
54±18 |
52±20 |
54±18 |
| Medications, n (%) |
| Loop diuretics |
0 (0) |
28 (41)* |
8 (72) |
20 (35)† |
| ACEIs/ARBs |
0 (0) |
34 (58)* |
3 (27) |
31 (54) |
| β-blockers |
0 (0) |
20 (29) |
8 (73) |
12 (21)† |
| Spironolactone |
0 (0) |
11 (16) |
4 (36) |
7 (12) |
| Echocardiographic parameters |
| LVEDVI, mL/m2 |
53±16 |
52±17 |
59±19 |
50±17 |
| LVESVI mL/m2 |
18±7 |
18±11 |
26±16 |
16±9† |
| LVEF, % |
67±7 |
68±10 |
60±14 |
70±9† |
| LV mass index, g/m2 |
79±19 |
121±35* |
136±39 |
118±34 |
| Relative wall thickness |
0.41±0.08 |
0.58±0.13* |
0.56±0.14 |
0.59±0.12 |
| Stroke volume index, mL/m2 |
56±15 |
43±9* |
40±9 |
43±9 |
| Peak velocity, m/s |
– |
4.37±0.75 |
4.37±0.85 |
4.40±0.72 |
| Mean pressure gradient, mmHg |
– |
49±17 |
51±21 |
49±16 |
| AVAi, cm2/m2 |
– |
0.42±0.10 |
0.40±0.14 |
0.43±0.11 |
| Zva, mmHg/mL/m2 |
– |
4.5±1.2 |
4.6±1.1 |
4.5±1.2 |
| E velocity, cm/s |
72±12 |
78±25 |
95±21 |
75±24† |
| E deceleration time, ms |
221±51 |
218±93 |
212±141 |
219±82 |
| A velocity, cm/s |
91±17 |
108±26 |
107±24 |
108±26 |
| e’ velocity, cm/s |
6.2±1.2 |
4.0±1.3* |
4.4±2.0 |
4.0±1.1 |
| E/A ratio |
0.80±0.11 |
0.72±0.26 |
0.86±0.21 |
0.70±0.26 |
| E/e’ ratio |
12±2 |
21±8* |
24±8 |
20±8 |
| LA volume index, mL/m2 |
41±12 |
54±21* |
66±23 |
52±20† |
| GLS, % |
16.5±1.5 |
9.4±2.6* |
7.4±2.2 |
9.8±2.6† |
Values are mean±SD for normally distributed data and median and interquartile range for non-normally distributed data, or n (%). *P<0.05 vs. normal controls; †P<0.05 vs. patients with cardiac event. ACEI, angiotensin-converting enzyme inhibitor; ARB, angiotensin II receptor blocker; AS, aortic stenosis; AV, aortic valve; AVA, aortic valve area; AVAi, indexed aortic valve area; EDVI, end-diastolic volume index; eGFR, estimated glomerular filtration rate; ESVI, end-systolic volume index; GLS, global longitudinal strain; LA, left atrial; LV, left ventricular; NYHA, New York Heart Association; STS-PROM score, Society of Thoracic Surgeons Predicted Risk of Mortality score; Zva, valvulo-arterial impedance.
While waiting for an aortic valve intervention to be performed (median follow-up period of 40 days), 11 patients (16%) developed adverse cardiac events preoperatively: 1 death from HF, 1 sudden cardiac death, and hospitalization for worsening HF for the remaining 9.
No significant differences between the two AS subgroups with and without adverse cardiac events were noted in terms of age, sex distribution, and comorbidities (Table 1). However, patients with cardiac events were more likely to be older and have a higher concentration of BNP. With respect to the baseline echocardiographic characteristics, patients with cardiac events were more likely to have a smaller LVEF and lower GLS as well as a larger left atrial volume index. On the other hand, there were no significant differences regarding baseline forward SV, LV diastolic functional parameters, LV morphological parameters or severity of AS (Table 1).
Acute Preload Stress Test
Acute
preload stress echocardiography was well tolerated by all subjects without any complications.
Figure 1
shows the comparison of the response to LPP stress for both the patients with AS and normal controls. The LPP stress resulted in a significant increase in forward SV (by ≈18%) without any change in LV filling pressure in normal controls, while the response to LPP stress proved to be significantly blunted (by ≈10%) in patients with AS (∆SVi: 13±9 vs. 4±5 mL/m2, P<0.001). On the other hand, blood pressure did not change during LPP stress in either the normal subjects or patients with AS, but Zva was decreased from 4.5±1.2 to 4.0±1.1 mmHg/mL/m2
in AS patients (P<0.05) mainly because of augmented foreword SV during acute preloading intervention.

Figure 2
shows the comparison of changes in LV diastolic functional parameters for subgroups of AS patients with and without cardiac events. LPP stress led to a significant increase in transmitral E-wave velocity and E/A ratio soon after the LPP stress in both groups and these findings were consistent with changes in the size of the inferior vena cava caused by the stress (with event: from 10.5±2.4 to 14.0±1.9 mm, P<0.01; without event: from 11.7±3.7 to 14.9±3.3 mm, P<0.001).

An important finding was that the LV filling pressure dramatically increased to the critical level only in patients with adverse cardiac events (E/e’: from 24±8 to 31±8, P<0.001). Interestingly, during acute preload stress, forward SV increased significantly only in the patients without cardiac events. There were no significant changes in GLS for either group (Figure 3), and no significant relationship was observed between changes in GLS and those in forward SV (r=0.21, P=0.10). The logistic regression analysis revealed that there were no independent variables among the baseline characteristics or echocardiographic parameters associated with a blunted response in forward SV and significant elevation of E/e’ during LPP stress.
On the other hand, neither worsening of mitral regurgitation nor LV dyssynchrony was observed in either group (with event: from 60.0±30.2 to 65.9±14.9 ms, NS; without event: from 61.8±18.4 to 61.9±20.9 ms, NS) during LPP stress.
Predictors of Primary Endpoints
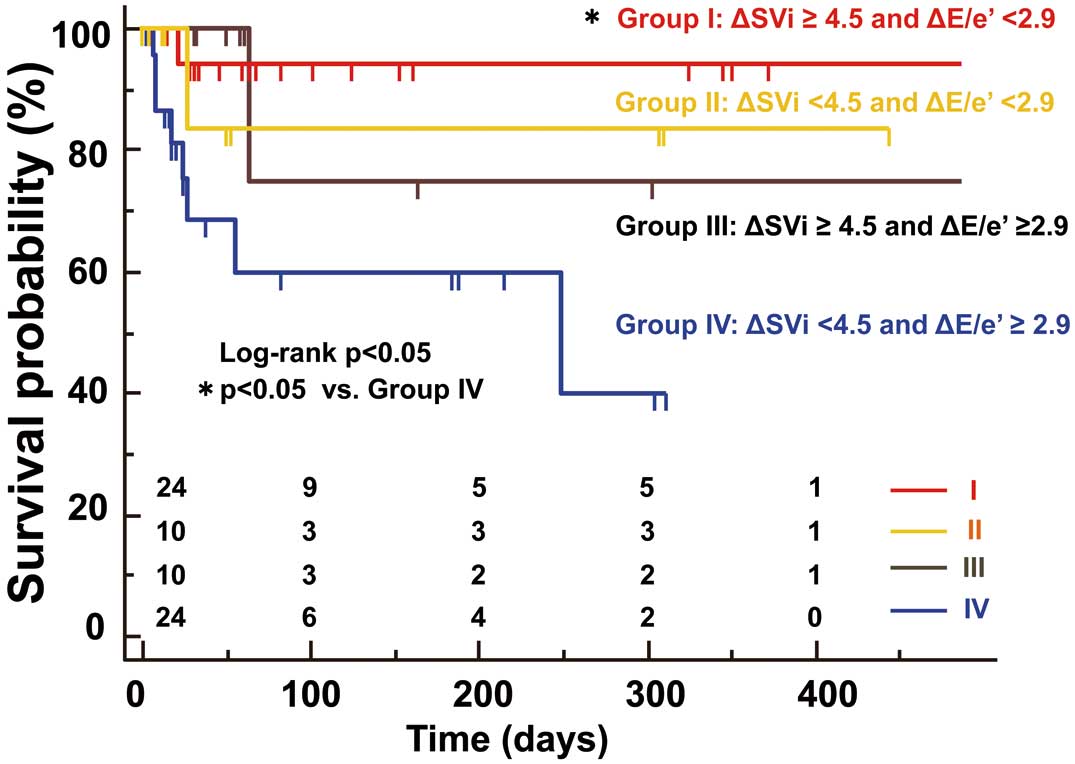
When the patients were divided according to the median of ∆SVi (4.5 mL/m2) and ∆E/e’ (2.9 units), patients with a flow reserve and a diastolic reserve showed significantly more favorable event-free survival than those without (Figure 4A,B). When the patients were divided into four subgroups based on the presence or absence of flow reserve and diastolic reserve, there were 24 patients in group I (35%) with both flow and diastolic reserve, and this pattern was associated with the best event-free survival compared with that of the other subgroups (log-rank P<0.05,
Figure 5). Conversely, there were 24 patients in group IV (35%) without either flow reserve or diastolic reserve, and this pattern was associated with the worst event-free survival. The patients with either diastolic reserve (Group II, 15%) or flow reserve (Group III, 15%) showed an intermediate risk of adverse cardiac events.

The hazard ratio (HR) and 95% confidence interval (CI) for each variable in the univariate and multivariate Cox proportional-hazards analyses are shown in
Table 2. An important finding of the multivariate Cox analysis was that LVEF (HR: 0.873, P<0.01), GLS (HR: 0.710, P<0.05) and ∆SVi (HR: 0.747, P<0.001) were independent predictors of adverse cardiac events.
Table 2.
Univariate and Multivariate Cox Proportional-Hazards Analysis of Study Group Undergoing Leg-Positive Pressure Maneuver
| Covariate |
Univariate analysis |
Multivariate analysis |
| HR |
95% CI |
P value |
HR |
95% CI |
P value |
| Clinical parameters |
| Age, years |
1.132 |
1.006–1.273 |
<0.05 |
|
|
|
| Sex (male) |
0.323 |
0.135–1.932 |
0.323 |
|
|
|
| BNP, pg/mL |
1.001 |
1.000–1.002 |
<0.01 |
|
|
|
| Baseline echocardiographic parameters |
| LVEF, % |
0.871 |
0.809–0.937 |
<0.001 |
0.873 |
0.801–0.953 |
<0.01 |
| GLS, % |
0.722 |
0.559–0.931 |
<0.05 |
0.710 |
0.524–0.980 |
<0.05 |
| E/e’ |
1.078 |
0.995–1.167 |
0.067 |
|
|
|
| LA volume index, mL/m2 |
1.025 |
1.003–1.048 |
<0.05 |
|
|
|
| Zva, mmHg/mL/m2 |
1.068 |
0.635–1.796 |
0.804 |
|
|
|
| SVi, mL/m2 |
0.976 |
0.913–1.044 |
0.476 |
|
|
|
| AVAi, cm2/m2 |
0.037 |
0.001–17.390 |
0.294 |
|
|
|
| Mean PG, mmHg |
1.016 |
0.981–1.052 |
0.373 |
|
|
|
| Preload stress echocardiographic parameters |
| ΔSVi, mL/m2 |
0.746 |
0.657–0.848 |
<0.001 |
0.747 |
0.634–0.879 |
<0.001 |
| ΔE/e’ |
1.225 |
1.088–1.379 |
<0.001 |
|
|
|
| ΔGLS, % |
0.791 |
0.538–1.164 |
0.234 |
|
|
|
BNP, B-type natriuretic peptide; CI, confidence interval; HR, hazard ratio; PG, pressure gradient; SVi, stroke volume index. Other abbreviations as in Table 1.
In the nested Cox models, a model based on the severity of AS (model 1: [AVAi, and mean PG], χ2=1.3) was improved by the addition of serum BNP concentration and baseline GLS (model 2: χ2=9.5, P<0.05). And, the model was improved by the addition of diastolic reserve (model 3: [plus ∆E/e’], χ2=26.9, P<0.001), and further improved by the addition of flow reserve (model 4: [plus ∆SVi], χ2=45.5, P<0.001).
Figure 6
shows representative cases of AS patients with and without cardiac events.
Discussion
The major findings of the present study were as follows. First, LPP stress led to a significant increase in forward SV without any change in LV filling pressure in the normal subjects, but the response was markedly blunted in patients with AS. Second, patients without cardiac events showed a significant increase in forward SV together with a minimal change in LV filling pressure. In patients with cardiac events, on the other hand, the Frank-Starling mechanism was significantly impaired, and LV filling pressure dramatically increased to the critical level. Third, the patients without flow reserve or diastolic reserve showed a significantly worse cardiac event rate than those in the other subgroups. Furthermore, the combined assessment of flow reserve and diastolic reserve could enhance the predictive capability for adverse outcomes for patients with symptomatic severe AS waiting for an aortic valve intervention.
Compensatory Concentric Hypertrophy as a “Double-Edged Sword”
If AS is allowed to run its natural course, gradual progression results in an increased resistance to LV ejection. Excess resistance to ejection eventually leads to pressure overload, thus impairing ejection performance. According to the law of Laplace, the LV chamber size gradually decreases and wall thickness increases, thereby offsetting the excess wall stress. Because of this process of concentric hypertrophy, LV ejection and cardiac output remain normal for a prolonged period despite the excess pressure overload on the LV.
On the one hand, this compensatory adaptive concentric hypertrophy has some beneficial aspects, but, on the other hand, when hypertrophy becomes excessive, it has certain detrimental aspects that make it a “double-edged sword”. Initially, concentric hypertrophy helps to maintain systolic performance and forward SV. However, as stenotic severity and ventricular hypertrophy continue to progress, negative aspects of concentric hypertrophy emerge. With excessive concentric hypertrophy, active relaxation is delayed16
and at the same time passive stiffness is increased as a result of myocardial fibrosis and reduced distensibility.17
The eventual result of these maladaptive processes is abnormal diastolic function, which results in symptom onset and may lead to an unfavorable outcome for the patient.
In this study, it was not possible to discriminate, on the basis of only the baseline values of E/e’ or the transmitral flow pattern, between patients with severe AS and future adverse cardiac events and those without. However, we could successfully identify hemodynamically unstable AS patients through assessing the changes in E/e’ observed during acute preload stress echocardiography. One can speculate that a hemodynamically unstable hypertrophic heart would operate in the steeper portion of the end-diastolic pressure-volume relationship, and the increase in preload would result in further elevation in ventricular filling pressure, leading eventually to an unfavorable outcome.
LV Systolic Dysfunction as Another Edge of the “Double-Edged Sword”
Another harmful edge of the “double-edged sword” is latent LV contractile dysfunction. The excessive concentric hypertrophy results in a reduction in the coronary flow reserve,18
intermittent ischemia,19
abnormalities of calcium handling,20
myocardial apoptosis,21
and subendocardial fibrosis,22
which all lead to ventricular contractile dysfunction. At this stage the LV fails, resulting in reductions in forward SV and cardiac output, and eventually leads to decompensated HF. In fact, it has been reported that, for patients with severe AS, a low SV in itself is a powerful predictor of death and this effect is reported to be independent of LVEF or the transvalvular pressure gradient.23
In our study, however, no difference in the resting forward SV was observed among the subgroups of AS patients, and this difference manifested itself only after acute preload stress. During LPP stress, the forward SV increased significantly only in the compensated AS patients without adverse cardiac events, while the Frank-Starling mechanism was significantly impaired in patients with cardiac events, and in some cases, forward SV even decreased during LPP stress.
It is reported that hemodynamic stress could worsen loading-related mitral regurgitation and ventricular dyssynchrony.24–26
Moreover, these aggravations are thought to affect each other, thus causing a vicious cycle that can finally lead to a lack of preload-induced increase in forward SV. In our study, however, LPP stress worsened neither the severity of mitral regurgitation nor LV dyssynchrony, and no significant change in LV afterload was observed during stress testing. These results suggest that myocardial dysfunction itself directly leads to the blunted response to increased preload. One can speculate that the Frank-Starling curve of patients with compensated AS would be relatively preserved, thus allowing them to successfully increase ventricular contraction in response to increased preload. On the other hand, in patients with decompensated AS the Frank-Starling curve would be relatively flat, so the length-tension relationship would no longer operate effectively.
Previous investigators have reported that low-dose dobutamine stress echocardiography can predict poor outcome for patients with low-gradient severe AS.27,28
They demonstrated that patients without a contractile reserve, defined by an increase in SV <20%, showed high operative mortality rates27,28
and thus a significantly poor long-term outcome.28
These reports therefore emphasize the importance of the presence of a preoperative contractile reserve, and are quite consistent with ours.
Clinical Implications
Morbidity and mortality of severe AS patients is generally known to rapidly deteriorate after the onset of symptoms, so immediate aortic valve intervention is needed for such patients. Lund et al reported that approximately 18% of AS patients with operative indication suffered from preoperative adverse cardiac events, as well as showing significantly unfavorable long-term postoperative survival.29
Malaisrie and colleagues, on the other hand, reported that cardiac mortality while waiting for AVR was 3.7% at 30 days.30
In our study, the ratio of adverse cardiac events was as high as 1 of every 6 patients, and 2 patients (4%) died while waiting for aortic valve intervention.
On the other hand, because the morbidity and mortality of patients with symptomatic AS is not homogeneous, it is important to identify those who are likely to develop preoperative adverse cardiac events in the daily clinical setting. It follows that a practical implication of our results is that LPP stress testing should be encouraged to identify patients who are likely to suffer clinical deterioration as well as potential targets for urgent operation. These findings will highlight the importance of such evaluations for clinical decision-making about patients with symptomatic AS waiting for aortic valve intervention. Moreover, as shown in our study, we can assess the preload reserve for these hemodynamically unstable patients by using LPP stress without any increase in total fluid volume, in an easy, safe, and non-invasive manner.
Study Limitations
First, this pilot study covered a small number of patients in a single center, so we may not be able to make a definitive conclusion regarding the utility of LPP stress echocardiography for these subjects. Although we used a multivariate Cox model to identify the independent predictors of adverse cardiac events, this model might be underpowered and also overfitted because of the small number of participants with a relatively low event rate. Thus, a future study with a larger patient population and sufficient statistical power should address the effect of preload reserve on risk stratification of patients with symptomatic AS who are scheduled for aortic valve intervention. Second, although the assessment of preload reserve during LPP stress was shown to be useful for risk stratification of patients with regard to preoperative adverse cardiac events, the observational period was restricted to the time the patients were waiting until an aortic valve intervention could be performed. Whether the presence of a preload reserve can predict operative or late postoperative death or LV functional recovery after AVR thus remains uncertain. Third, this study did not include a simultaneous invasive hemodynamic study during LPP stress. However, the assessment of LPP stress was previously validated in comparison with invasive measurement5,6
using the same protocol as in our study. Fourth, there are 30 (44%) patients with mild to moderate MAC in this cohort. Because accurate quantification of the calcium burden of the mitral annulus was not part of this study, we could not clarify whether the extent of MAC influenced the results. Although it is possible that MAC might affect the absolute value of the mitral annular velocities, we believe that the absolute changes in E/e’ ratio in every single patient may not be significantly influenced by the extent of MAC, and so our overall results may not be affected.
Conclusions
Assessment of the preload reserve during LPP stress for patients with symptomatic severe AS can enhance the predictive capability for adverse cardiac outcomes while they are waiting for aortic valve intervention. The findings of our study indicate that urgent intervention may be required for patients without a preload reserve.
Conflict of Interest
The authors declare no conflicts of interest.
References
- 1.
Davies SW, Gershlick AH, Balcon R. Progression of valvar aortic stenosis: A long-term retrospective study. Eur Heart J 1991; 12: 10–14.
- 2.
Pellikka PA, Sarano ME, Nishimura RA, Malouf JF, Bailey KR, Scott CG, et al. Outcome of 622 adults with asymptomatic, hemodynamically significant aortic stenosis during prolonged follow-up. Circulation 2005; 111: 3290–3295.
- 3.
Leon MB, Smith CR, Mack M, Miller DC, Moses JW, Svensson LG, et al. Transcatheter aortic-valve implantation for aortic stenosis in patients who cannot undergo surgery. N Engl J Med 2010; 363: 1597–1607.
- 4.
Nishimura RA, Otto CM, Bonow RO, Carabello BA, Erwin JP 3rd, Guyton RA, et al. 2014 AHA/ACC guideline for the management of patients with valvular heart disease: Executive summary: A report of the American College of Cardiology/American Heart Association Task Force on Practice Guidelines. J Am Coll Cardiol 2014; 63: 2438–2488.
- 5.
Kusunose K, Yamada H, Nishio S, Tamai R, Niki T, Yamaguchi K, et al. Interval from the onset of transmitral flow to annular velocity is a marker of LV filling pressure. JACC Cardiovasc Imaging 2013; 6: 528–530.
- 6.
Yamada H, Kusunose K, Nishio S, Bando M, Hotchi J, Hayashi S, et al. Pre-load stress echocardiography for predicting the prognosis in mild heart failure. JACC Cardiovasc Imaging 2014; 7: 641–649.
- 7.
Lang RM, Badano LP, Mor-Avi V, Afilalo J, Armstrong A, Ernande L, et al. Recommendations for cardiac chamber quantification by echocardiography in adults: An update from the American Society of Echocardiography and the European Association of Cardiovascular Imaging. Eur Heart J Cardiovasc Imaging 2015; 16: 233–270.
- 8.
Devereux RB, Alonso DR, Lutas EM, Gottlieb GJ, Campo E, Sachs I, et al. Echocardiographic assessment of left ventricular hypertrophy: Comparison to necropsy findings. Am J Cardiol 1986; 57: 450–458.
- 9.
Nagueh SF, Appleton CP, Gillebert TC, Marino PN, Oh JK, Smiseth OA, et al. Recommendations for the evaluation of left ventricular diastolic function by echocardiography. J Am Soc Echocardiogr 2009; 22: 107–133.
- 10.
Sumida T. Single-beat determination of doppler-derived aortic flow measurement in patients with atrial fibrillation. J Am Soc Echocardiogr 2003; 16: 712–715.
- 11.
Kusunose K, Yamada H, Nishio S, Tomita N, Niki T, Yamaguchi K, et al. Clinical utility of single-beat E/e’ obtained by simultaneous recording of flow and tissue Doppler velocities in atrial fibrillation with preserved systolic function. JACC Cardiovasc Imaging 2009; 2: 1147–1156.
- 12.
Nishimura RA, Otto CM, Bonow RO, Carabello BA, Erwin JP 3rd, Guyton RA, et al. 2014 AHA/ACC Guideline for the Management of Patients With Valvular Heart Disease: A report of the American College of Cardiology/American Heart Association Task Force on Practice Guidelines. Circulation 2014; 129: e521–e643.
- 13.
Briand M, Dumesnil JG, Kadem L, Tongue AG, Rieu R, Garcia D, et al. Reduced systemic arterial compliance impacts significantly on left ventricular afterload and function in aortic stenosis: Implications for diagnosis and treatment. J Am Coll Cardiol 2005; 46: 291–298.
- 14.
Matsuzoe H, Tanaka H, Matsumoto K, Toki H, Shimoura H, Ooka J, et al. Left ventricular dyssynergy and dispersion as determinant factors of fatal ventricular arrhythmias in patients with mildly reduced ejection fraction. Eur Heart J Cardiovasc Imaging 2016; 17: 334–342.
- 15.
Haugaa KH, Grenne BL, Eek CH, Ersboll M, Valeur N, Svendsen JH, et al. Strain echocardiography improves risk prediction of ventricular arrhythmias after myocardial infarction. JACC Cardiovasc Imaging 2013; 6: 841–850.
- 16.
Gunther S, Grossman W. Determinants of ventricular function in pressure-overload hypertrophy in man. Circulation 1979; 59: 679–688.
- 17.
Hess OM, Ritter M, Schneider J, Grimm J, Turina M, Krayenbuehl HP. Diastolic stiffness and myocardial structure in aortic valve disease before and after valve replacement. Circulation 1984; 69: 855–865.
- 18.
Marcus ML, Doty DB, Hiratzka LF, Wright CB, Eastham CL. Decreased coronary reserve: A mechanism for angina pectoris in patients with aortic stenosis and normal coronary arteries. N Engl J Med 1982; 307: 1362–1366.
- 19.
Nakano K, Corin WJ, Spann JF Jr, Biederman RW, Denslow S, Carabello BA. Abnormal subendocardial blood flow in pressure overload hypertrophy is associated with pacing-induced subendocardial dysfunction. Circ Res 1989; 65: 1555–1564.
- 20.
Ito K, Yan X, Feng X, Manning WJ, Dillmann WH, Lorell BH. Transgenic expression of sarcoplasmic reticulum Ca(2+) atpase modifies the transition from hypertrophy to early heart failure. Circ Res 2001; 89: 422–429.
- 21.
Hein S, Arnon E, Kostin S, Schonburg M, Elsasser A, Polyakova V, et al. Progression from compensated hypertrophy to failure in the pressure-overloaded human heart: Structural deterioration and compensatory mechanisms. Circulation 2003; 107: 984–991.
- 22.
Herrmann S, Stork S, Niemann M, Lange V, Strotmann JM, Frantz S, et al. Low-gradient aortic valve stenosis myocardial fibrosis and its influence on function and outcome. J Am Coll Cardiol 2011; 58: 402–412.
- 23.
Le Ven F, Freeman M, Webb J, Clavel MA, Wheeler M, Dumont E, et al. Impact of low flow on the outcome of high-risk patients undergoing transcatheter aortic valve replacement. J Am Coll Cardiol 2013; 62: 782–788.
- 24.
Abe Y, Akamatsu K, Furukawa A, Ito K, Matsumura Y, Haze K, et al. Pre-load-induced changes in forward LV stroke and functional mitral regurgitation: Echocardiographic detection of the descending limb of Starling’s curve. JACC Cardiovasc Imaging, doi:10.1016/j.jcmg.2016.07.010.
- 25.
Park HE, Chang SA, Kim HK, Shin DH, Kim JH, Seo MK, et al. Impact of loading condition on the 2D speckle tracking-derived left ventricular dyssynchrony index in nonischemic dilated cardiomyopathy. Circ Cardiovasc Imaging 2010; 3: 272–281.
- 26.
Spartera M, Galderisi M, Mele D, Cameli M, D’Andrea A, Rossi A, et al. Role of cardiac dyssynchrony and resynchronization therapy in functional mitral regurgitation. Eur Heart J Cardiovasc Imaging 2016; 17: 471–480.
- 27.
Quere JP, Monin JL, Levy F, Petit H, Baleynaud S, Chauvel C, et al. Influence of preoperative left ventricular contractile reserve on postoperative ejection fraction in low-gradient aortic stenosis. Circulation 2006; 113: 1738–1744.
- 28.
Monin JL, Quere JP, Monchi M, Petit H, Baleynaud S, Chauvel C, et al. Low-gradient aortic stenosis: Operative risk stratification and predictors for long-term outcome: A multicenter study using dobutamine stress hemodynamics. Circulation 2003; 108: 319–324.
- 29.
Lund O, Nielsen TT, Emmertsen K, Flo C, Rasmussen B, Jensen FT, et al. Mortality and worsening of prognostic profile during waiting time for valve replacement in aortic stenosis. Thorac Cardiovasc Surg 1996; 44: 289–295.
- 30.
Malaisrie SC, McDonald E, Kruse J, Li Z, McGee EC Jr, Abicht TO, et al. Mortality while waiting for aortic valve replacement. Ann Thorac Surg 2014; 98: 1564–1570; discussion 1570–1571.