Abstract
Background:
Myocardial bridges (MB) are commonly seen on coronary CT angiography (CCTA) in asymptomatic individuals, but in patients with recurrent typical angina symptoms, yet no obstructive coronary artery disease (CAD), evaluation of their potential hemodynamic significance is clinically relevant. The aim of this study was to compare CCTA to invasive coronary angiography (ICA), including intravascular ultrasound (IVUS), to confirm MB morphology and estimate their functional significance in symptomatic patients.
Methods and Results:
We retrospectively identified 59 patients from our clinical databases between 2009 and 2014 in whom the suspicion for MB was raised by symptoms of recurrent typical angina in the absence of significant obstructive CAD on ICA. All patients underwent CCTA, ICA and IVUS. MB length and depth by CCTA agreed well with length (0.6±23.7 mm) and depth (CT coverage) as seen on IVUS. The product of CT length and depth (CT coverage), (MB muscle index (MMI)), ≥31 predicted an abnormal diastolic fractional flow reserve (dFFR) ≤0.76 with a sensitivity and specificity of 74% and 62% respectively (area under the curve=0.722).
Conclusions:
In patients with recurrent symptoms of typical angina yet no obstructive CAD, clinicians should consider dynamic ischemia from an MB in the differential diagnosis. The product of length and depth (i.e., MMI) by CCTA may provide some non-invasive insight into the hemodynamic significance of a myocardial bridge, as compared with invasive assessment with dFFR.
A myocardial bridge (MB) is a common coronary variant, mostly affecting the left anterior descending (LAD) coronary artery with a segment of the vessel covered by myocardium. The majority of people with a bridge are asymptomatic, but a small subset of patients develop angina, likely secondary to dynamic ischemia in the myocardial territory of septal branches embedded within the bridged segment.1
Symptoms may develop or progress with the patient’s age, because of associated conditions such as endothelial dysfunction, diastolic dysfunction and ventricular hypertrophy.2
In addition, atherosclerotic plaque can accumulate proximal to the MB, possibly from dynamic retrograde flow in the LAD resulting from compression of the bridged vessel segment.3,4
Current non-invasive imaging techniques are unable to accurately assess the hemodynamic relevance of MBs.
MBs are commonly seen on coronary computed tomography angiography (CCTA). Given their prevalence, the consensus is that they are merely innocent findings, not hemodynamically important, and do not cause ischemia. However, in patients with recurrent symptoms of typical angina, without obstructive coronary artery disease (CAD), evaluation of their potential hemodynamic significance may become clinically important.5
CCTA allows visualization of both the coronary artery lumen and the myocardium,6
but there is limited data on the comparison between CCTA and the clinical standard of intravascular ultrasound (IVUS) for the assessment of MBs7
and no data on potential parameters measured by CCTA that may be valuable in predicting hemodynamic significance. Simulation of coronary fluid dynamics based on CCTA is being developed to estimate mean fractional flow reserve (FFR) at resting heart rates, in fixed coronary artery stenosis; however, such measurements are not suited for assessment of the dynamic MB lesion. Escaned et al have shown the need to use an inotrope to increase the heart rate and contractility and to measure the diastolic FFR (dFFR), as the most appropriate approach.8
Although not extensively studied, invasive coronary angiography (ICA) with inotropic challenge and pressure measurements to assess dFFR appears to be the best tool currently available. In this study, we investigated whether anatomic features on CCTA predict hemodynamically relevant MBs as determined by ICA and dFFR. Ishii and colleagues3
first introduced the concept of the MB muscle index (MMI=MB length×MB depth) to assess significance of MBs from autopsy studies. They found a higher LAD plaque burden proximal to the MB when the MMI was greater, from which they concluded that larger MB mass likely resulted in greater hemodynamic compromise. There has not been a proposed non-invasive index for the assessment of severity of MBs. In clinical practice, we have encountered symptomatic patients with superficial MBs, yet of significant length, who have reduced dFFR upon invasive testing. Therefore, our hypothesis was that any MB may be significant, even if superficial. Length and coverage (a surrogate for depth) of the MB can be easily measured by CTA.
Methods
We retrospectively reviewed the clinical databases at Stanford Hospital and Clinics for patients who presented with symptoms of recurrent typical angina between 2009 and 2014, and underwent all of the following imaging studies: stress echocardiography suggestive of MB,1
ICA demonstrating no obstructive CAD, and CCTA. Patients with confirmed presence of MB by IVUS then underwent dFFR assessment in the LAD. We identified 67 patients. After initial review of the CCTA data, 8 examinations were deemed uninterpretable because of poor image quality. The present analysis includes the remaining 59 patients. The CCTA scans were read by 2 radiologists independently and 2 interventional cardiologists read the IVUS and dFFR data, respectively.
The institutional Review Board approved the study.
Cardiac CT
All CT angiograms were acquired by retrospective ECG-gated spiral scan mode clinically using single- and dual-source CT systems: Siemens Somatom Definition (25 patients) or Siemens Somatom Definition Flash (26 patients) (Siemens, Forchheim, Germany); GE Lightspeed VCT (5 patients) or GE Discovery HD750 (2 patients) (General Electric, Milwaukee, WI, USA); and Philips Brilliance 40 (1 patient) (Philips, Eindhoven, The Netherlands). Patients were administered 0.4 mg sublingual nitroglycerin and intravenous and/or oral metoprolol with goal heart rate <60 beats/min before image acquisition. Reconstructed CCTA images, with slice thickness between 0.6 and 1.0 mm, were re-evaluated on an external workstation (SyngoVia, VA30A, Siemens Medical Solutions) by 2 experienced radiologists. Diastolic datasets were reviewed. Multi- and curved-planar reformations were used for the assessment of the MB in 2 planes, 1 parallel and 1 perpendicular to the vessel’s course.
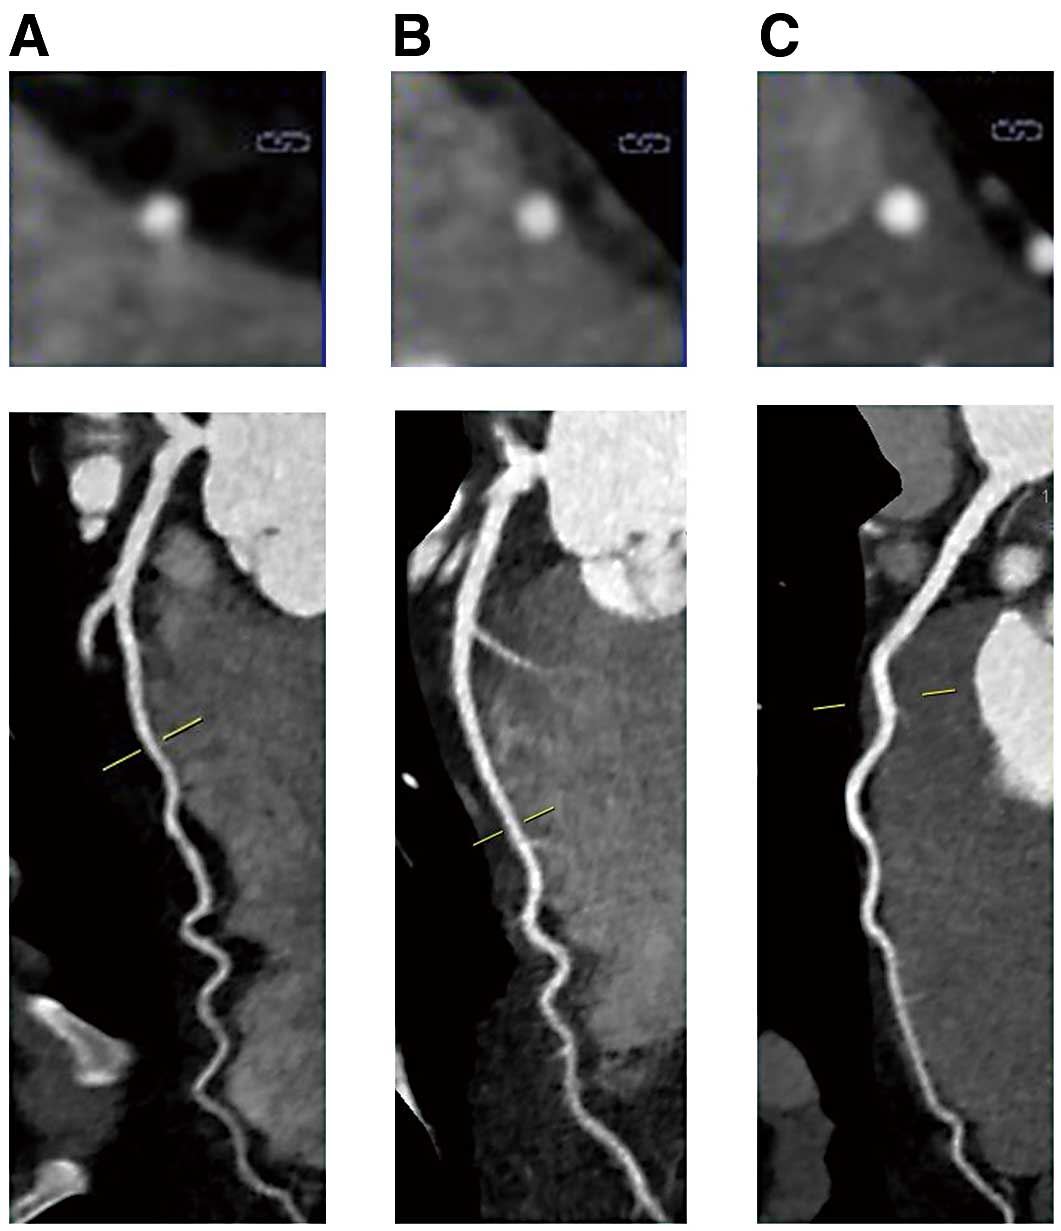
MBs were graded according to the criteria proposed by Kim et al:9
LAD running through the epicardial fat without myocardium contact (0=no bridge), LAD within the interventricular groove and in myocardium contact (1=partial coverage), full encasement of LAD, but without visibly overlying myocardium (2=unroofed) and full encasement of LAD with visibly overlying myocardium (3=full coverage) (Figure 1).
The MB location was determined by measuring the distance from the LAD ostium to the bridge’s entrance. The MB length was measured in millimeters (mm) along the vessel axis from the disappearance of the epicardial fat plane proximally to its re-emergence distally. In 4 cases, the distal end of the MB was not precisely determined by CCTA because of motion artifact or minimal epicardial fat. In these cases, the length of the MB that could be visualized was used for analysis. We calculated the MMI as MB length (mm)×MB coverage; 1, 2 or 3.3
The presence or absence of atherosclerotic plaque proximal to the MB was assessed. When present, plaques were categorized into 5 groups (no plaque, non-calcified, mixed, calcified, and stented).
IVUS
Ultrasonography measurements were performed with a 40-MHz mechanical IVUS catheter (Atlantis SR Pro2, Boston Scientific, Marlborough, MA, USA), placed as far distally in the LAD as safely possible. Recordings were obtained during an automated pullback at 0.5 mm/s and at a stationary wire position during manual pullback. Qualitative and quantitative evaluations were performed with EchoPlaqueTM
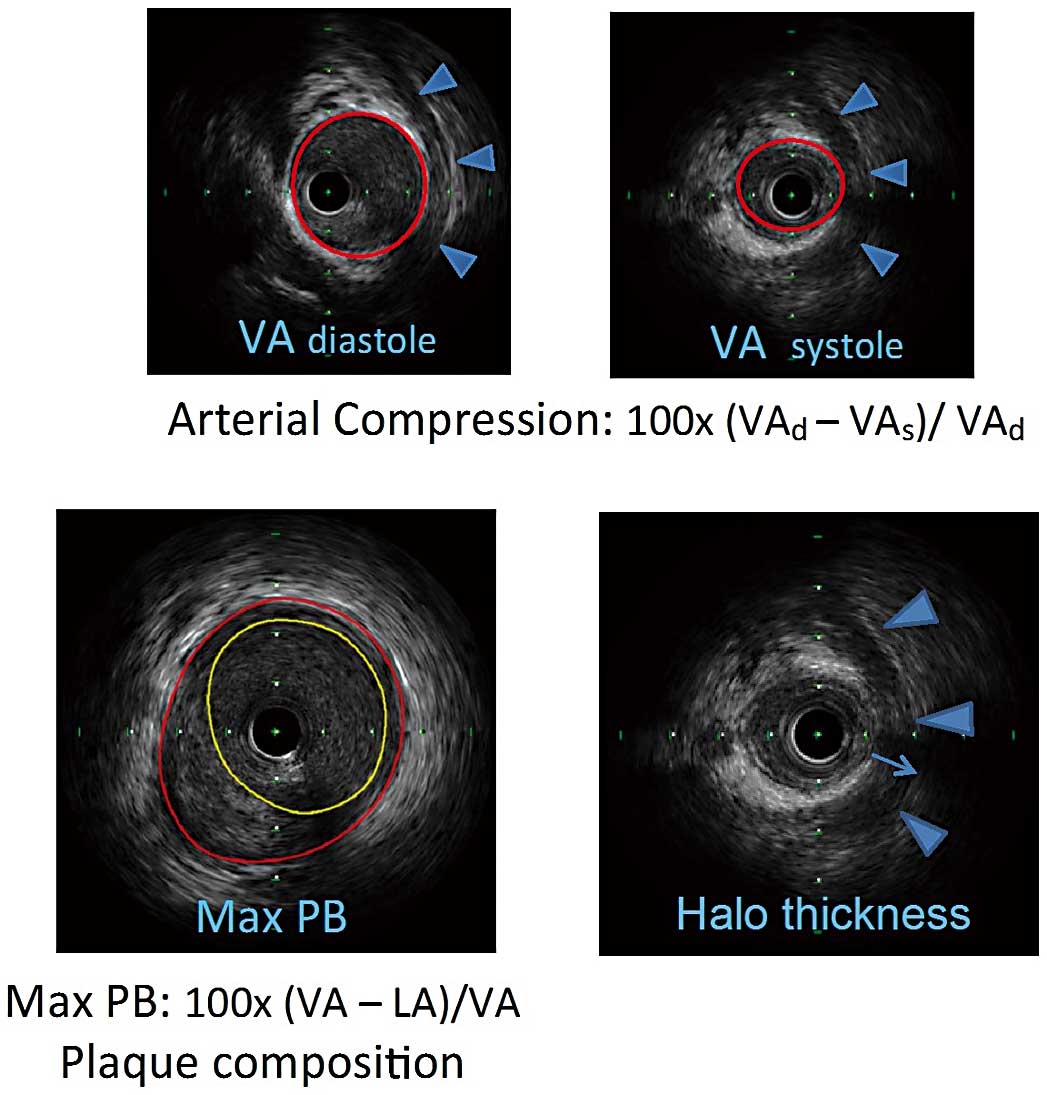
(Indec Systems, Inc., Santa Clara, CA, USA). Two experienced invasive cardiologists from an independent core laboratory (Cardiovascular Core Analysis Laboratory at Stanford University) reviewed all IVUS recordings. MB was defined as an echo-lucent half-moon (“halo”) and/or systolic luminal area compression >10%. The systolic compression of the bridged segment obtained from the stationary wire position was calculated by the following equation: 100×(vessel area in diastole−vessel area in systole)/vessel area in diastole. The length and location of the MB were assessed from the first emergence to the disappearance of the echo-lucent halo during the automatic catheter pullback. The MB halo thickness was measured (in mm) at its widest point (Figure 2). In 2 cases, the distance from the LAD ostium to the MB entrance was unobtainable because a halo was absent, but significant dynamic compression of LAD was seen and therefore a bridge was considered present. In both cases CCTA identified the MBs. Similar to CCTA, plaque composition by IVUS was characterized into 5 groups. The maximal plaque burden was calculated as: (vessel area−lumen area)/vessel area (%) at the location of the largest plaque burden.
Two experienced cardiologists reviewed the hemodynamic measurements. All measurements were made with the ComboWire®
XT Pressure Wire (Volcano Corporation, San Diego, CA, USA) within the MB at rest and at peak dobutamine stress. Dobutamine was given intravenously in increments of 10–20 μg/kg/min every 3 min until 85% of the maximal heart rate for age was achieved or a maximum of 50 μg/kg/min. Up to 1.0 mg atropine was administered. Recordings were stored on the ComboMap®
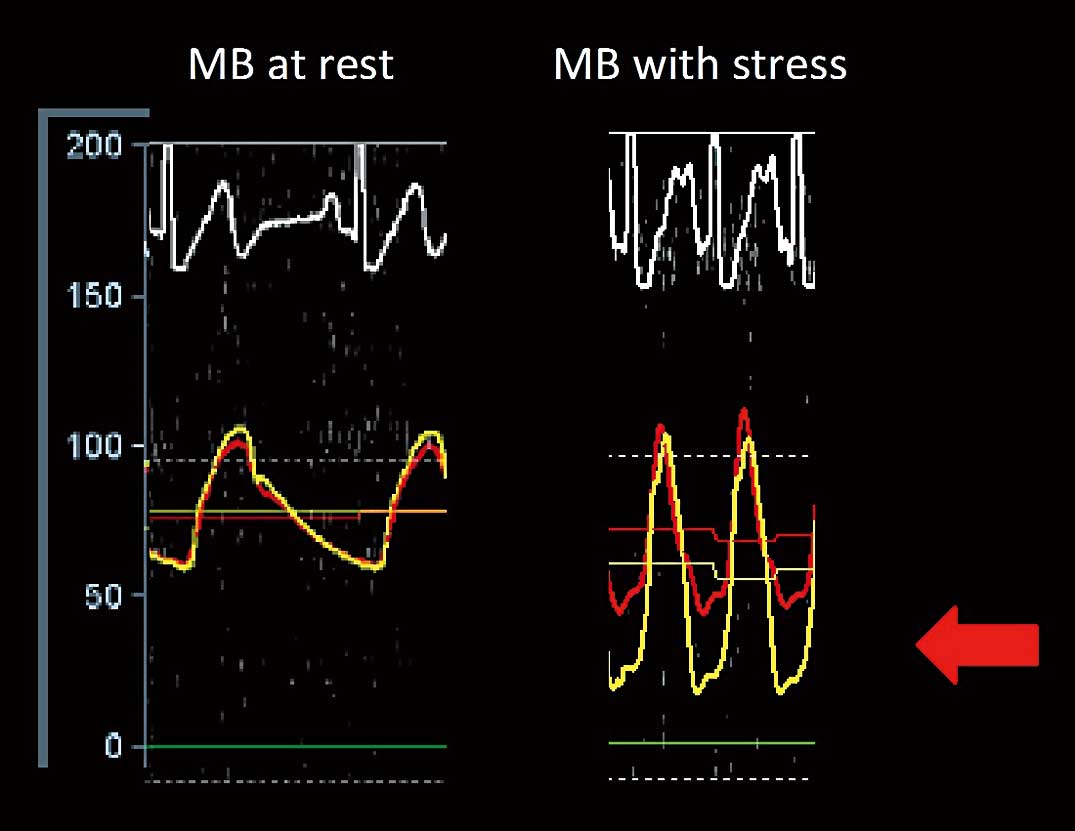
console for offline analysis. Using an electronic caliper, an instantaneous dFFR was measured as a fraction of coronary pressure divided by aortic pressure (Pd/Pa), at 3–5 points throughout diastole on a single heartbeat. An average dFFR for the same heartbeat was then calculated. This calculation was repeated for 2–3 additional adjacent heartbeats and the final average dFFR from these heartbeats was obtained, representing the resting state and peak stress, respectively. The diastolic phase of the pressure curves was identified from the simultaneous ECG tracing. The resting dFFRs were all within normal limits (>0.90). The stress dFFR measurements ranged from normal to very abnormal values. A dFFR ≤0.76 was considered hemodynamically significant (Figure 3). Only the stress dFFR was compared with the MMI. None of the proximal plaques was flow limiting. The pressure curves from the aorta and coronary arteries were continuously monitored during pullback of the catheter during peak stress. The dFFR values in the proximal segment of the LAD during stress were all within normal limits (>0.90).
Limit of agreement (mean difference ±1.96 standard deviations of the difference) and systematic error between CCTA and IVUS for the length and location of the MB were determined by using Bland-Altman plot, two-sample paired t-test, ANOVA, and Kappa analysis. CCTA bridge coverage was compared with IVUS halo thickness by box plot analysis, and the categories were tested for significant differences with Kruskal-Wallis test. A 2×2 contingency table was used for comparing the presence of atherosclerotic plaques proximal to the MB. Missing data were calculated by multiple imputations.
MB-related variables were tested for their ability to predict abnormal dFFR in univariable binary logistics regression analysis. Variables with a P<0.2 were considered for inclusion in the multivariable forward stepwise logistic regression analysis to determine independent predictor. Less significant univariables correlating significantly (R>0.6) with other variables in the model were removed to avoid multicollinearity. Because MMI was found to be an independent predictor of abnormal dFFR, a receiver-operating characteristic curve (ROC) curve was plotted to establish a value of MMI to identify abnormal dFFR. A test was considered statistically significant if P<0.05.
All statistical analyses were performed using the SPSS Statistic 22 (IBM Corporation, Armonk, NY, USA).
Results
Patients’ characteristics are presented in
Table 1. The majority of patients were young and female. Among the 59 patients, an MB was present in 51 (86%) and 50 (85%) patients by CCTA and IVUS, respectively. All MBs seen by IVUS were also been seen by CCTA; in 1 patient, an MB was detected by CCTA but not by IVUS. There was an almost perfect agreement between CCTA and IVUS, κ=0.93 (95% CI: 0.80–1.00) in identifying the presence of a MB. A consensus reading was performed by 2 cardiologists, familiar with the clinical history in 2 cases of significant discordance within the readers’ pair where IVUS suggested no MB but CCTA suggested MB. One patient underwent un-roofing surgery and was found to have a thin, completely fibrotic MB; the other patient had a very abnormal dFFR on invasive testing. Both patients had an arterial compression of ≥10%.
Table 1.
Study Patient’s Characteristics
| Parameter |
Men |
Women |
Total |
| No. of patients (%) |
16 (27) |
43 (73) |
59 |
| Mean age in years (SD) |
41.8 (±20.9) |
37.1 (±14.9) |
38.4 (±16.7) |
| Hyperlipidemia, n (%) |
7 (44) |
11 (26) |
18 (31) |
| Hypertension, n (%) |
5 (31) |
10 (23) |
15 (26) |
| Diabetes mellitus, n (%) |
1 |
0 |
1 |
| Smoker |
| Never, n (%) |
11 (68.7) |
39 (91) |
50 (85) |
| Former, n (%) |
1 (6.3) |
1 (2.3) |
2 (3) |
| Current, n (%) |
4 (25) |
3 (7) |
7 (12) |
| Family history of CAD, n (%) |
4 (25) |
9 (21) |
13 (22) |
CAD, coronary artery disease; SD, standard deviation.
The mean length of the MB as assessed by CCTA was 28.3±20.0 mm (range 2.0–93.0 mm), whereas the mean length as assessed by IVUS was 27.2±15.3 mm (range 4.2–68.9 mm). The mean difference was 0.6 mm (95% CI: −2.9–4.1). The distance from the LAD ostium to the entrance of the MB as measured by CCTA was 36.7±19.5 mm (range 7.0–116.0 mm), whereas the same mean distance as measured by IVUS (including 48 cases) was 35.0±13.4 mm (range 2.6–69.7 mm). The mean difference (including 48 valid comparisons) was 1.6 mm (95% CI: −2.8–5.9). The systematic discordance and limit of agreement between CCTA and IVUS for the length and distance was 0.6 mm and −23.1–24.3 mm (Figure 4A) and 1.6 mm and −27.4–30.6 mm (Figure 4B), respectively.

Among the 51 patients with a MB on CCTA, there was partial coverage, unroofed, and full coverage in 14 (27%), 21 (41%), and 16 (31%), respectively. In 2 cases, a halo was not measured by IVUS and in 1 case, compression was not measured by IVUS. Thus, further comparisons of the results from CCTA and IVUS regarding halo were limited to 48 patients. There was a significant association between halo thickness by IVUS and the type of myocardial coverage seen on CCTA, with a median halo thickness of 0.27 mm, 0.42 mm, and 0.77 mm for partial, unroofed, and full coverage, respectively (P<0.001) (Figure 5). Comparisons among the 3 categories (partial vs. unroofed, partial vs. full, and unroofed vs. full) were all statistically significant (P<0.03).

All patients with an MB had proximal atherosclerotic plaque on IVUS, whereas proximal plaque was identified in only 13 (26%) by CCTA. The mean maximal plaque burden proximal to the MB measured by IVUS was 29.8±17.2% (range 9.4–75%). The inability to identify this proximal plaque on CCTA was present throughout the range of maximal plaque burden observed by IVUS. The plaque characteristics identified by CCTA were calcified (n=5), partially calcified (n=6), and stented (n=2). No non-calcified plaques were detected by CCTA. The plaque characteristics identified by IVUS were non-calcified (46), partially calcified (1), calcified (2), and stented (1).
Of the total 50 patients with confirmed MB by IVUS, 47 underwent dFFR assessment; the remaining 3 did not undergo dFFR study, because we could not obtain informed consent for 2 patients and in 1 patient the LAD was too small to pass the ComboWire safely. A total of 39 (78.9%) had dFFR ≤0.76 within the MB, and 45 (95.7%) patients had dFFR ≤0.76 within/distal to the MB. Patients with dFFR ≤0.76 had significantly longer MB length (28.7±19.9 vs. 14.3±20.9, P=0.03), more coverage (P=0.01), and higher MMI by CCTA (15.9±13.9 vs. 6.9±9.6, P=0.01).
Table S1
presents the clinical characteristics of patients with dFFR ≤0.76 within/distal to the MB. Of the 9 patients without an MB, 1 had severe endothelial dysfunction, 1 had symptomatic premature ventricular contractions and in 7 patients the cause of angina could not be determined.
On univariable logistic regression analysis, several CCTA parameters were found to be associated with abnormal dFFR, including MB length, MB coverage, distance of MB from bifurcation and MMI (Table 2A). Because MB length and MMI correlated significantly with each other (Spearman rank correlation=0.78, P<0.001), of the 2 factors only MMI was included in the multivariable analysis. On multivariable forward stepwise logistic regression analysis MMI was found to be independent predictor of abnormal dFFR (Table 2B). MMI by CCTA correlated significantly with bridge stress dFFR with Spearman rank correlation: −0.30 (95% CI −0.52 to −0.02), P=0.042 (Figure S1). A receiver-operator curve was plotted to identify the value of MMI by CCTA that is predictive of abnormal dFFR. An MMI by CCTA was found to be moderately predictive (area under the curve=0.722 (95% CI 0.50–0.87); P=0.003) of a hemodynamically significant dFFR. MMI by CCTA ≥31.0 can be used as a cut off value to predict a hemodynamically significant MB (dFFR ≤0.76) with a sensitivity of 71.1% and a specificity of 62% (Figure 6).
Table 2.
(A) Univariable Logistic Regression Analysis to Test the Ability of Variables to Predict Abnormal dFFR, (B) Multivariable Logistic Regression Analysis to Predict Abnormal dFFR
| A |
MB variable |
OR (95% CI) |
P value |
| Bridge dFFR ≤0.76 |
MB length |
1.04 (1.00–1.07) |
0.02 |
| |
MB coverage |
2.58 (1.39–4.79) |
0.002 |
| |
Distance from bifurcation |
1.03 (1.00–1.06) |
0.019 |
| |
MB muscle index |
1.06 (1.01–1.12) |
0.017 |
| B |
|
| Bridge dFFR ≤0.76 |
MB muscle index |
1.06 (1.01–1.12) |
0.021 |
CI, confidence interval; dFFR, diastolic fractional flow reserve; MB, myocardial bridge; OR, odds ratio.
Discussion
This study demonstrated that CCTA can not only serve as a valuable non-invasive test for the anatomic definition of an MB but also provide insight into the potential hemodynamic significance of the bridge in patients with recurrent symptoms of typical angina without obstructive CAD. Specifically, we showed that (1) CCTA is comparable to IVUS in determining MB length and location, (2) the coverage of an MB by CCTA correlates well with the MB thickness by IVUS, and (3) CCTA can give an indication of the hemodynamic significance of an MB. Surprisingly, CCTA identified only a fraction of the upstream plaque, as compared with IVUS. It should be noted, however, that plaque accumulation often is eccentric and spatial resolution by CT is limited to detection of plaques >0.5 mm.
More than 30% of patients with angina referred for ICA have no significant obstructive CAD.10
In these patients, other coronary abnormalities, including hemodynamically significant MBs, should be considered.11
Although an MB is commonly seen on CCTA and often regarded as an innocent finding, some MBs can lead to ischemic symptoms in selected cases and surgical un-roofing can yield significant symptomatic improvement.12
It is therefore necessary to have a method for determining which MBs are hemodynamically important. Although ICA with IVUS and dobutamine stress dFFR can reliably provide an anatomical and functional assessment of the MB,1,13
non-invasive insights into the potential hemodynamic significance of the MB may help guide the need for invasive assessment in symptomatic patients. Of note, however, we had 5 patients with an MMI <31, yet they had significant dFFR upon invasive testing. Hence one should not dismiss a patient with less than this cutoff value as not potentially suffering from a hemodynamic MB. Although the sensitivity and specificity were modest in this small series, there are no other studies published to date that have put forward a non-invasive tool for estimating the significance of an MB. Furthermore, as a non-invasive tool, it is not dissimilar from other non-invasive tests when it comes to predicting occlusive CAD. For instance, in a meta-analysis of 44 studies the quoted sensitivity/specificity for predicting occlusive CAD with exercise echocardiography was 85%/77% and for single-photon emission computed tomography (SPECT) it was 87%/64%.14
However, in subgroups of patients with hypertension it was 74%/87% for echo and 87%/44% for SPECT. It is well recognized that exercise electrocardiography is substantially less sensitive and specific than any imaging exercise test. Suffice to say the MMI is not perfect, and future studies are needed to further refine and improve the accuracy of this index.
Criteria for identifying an MB by CCTA vary but require identification of the entrance and exit of the tunneled segment. On IVUS, the extent of an MB is identified by the appearance and disappearance of an echo-lucent halo. This halo is pathognomonic for an MB,4
and has been shown to represent the muscle bands overlying the artery.15
In this study, the coverage of an MB by CCTA correlated well with the halo thickness by IVUS, highlighting that any degree of coverage on CCTA, even partial, signifies the presence of an MB. Although there was a larger spread in halo thickness among MBs that were considered partially covered by CCTA, our findings demonstrate that some individuals have a significant MB by IVUS, even if CCTA shows partial coverage.8
However, there was a relatively wide limit of agreement between the CCTA and IVUS for length or location in 6 patients who were outside 2 standard deviations. The majority of these discordant measurements can be explained by the challenge in accurately measuring MB length by CCTA, especially in only partially covered segments with higher image noise and low vessel contrast, or when a minimal epicardial fat plane is present.
This is the first study to show that CCTA can predict hemodynamically relevant MBs, with a correlation between MMI and invasive dFFR, and could serve as an important initial screening test. This has implications for how CCTA may be used in the clinical evaluation of MBs. The longer the MB and the more embedded it is in muscle the more likely that it will be hemodynamically significant. Systolic arterial compression by IVUS has been described as a sign of an MB. Although compression is better visualized by IVUS than by ICA, it may also be assessed by CCTA.16
Three studies have reported that systolic compression correlates well with coverage, but not with MB length.17–19
Ma et al reported that 34.9% of patients with MBs had systolic compression >50% by CCTA.20
Unexpectedly, CCTA was inadequate in detecting plaque proximal to the MB, particularly non-calcified plaques. These plaques are seen by IVUS, generally ≥20 mm proximal to the MB entrance,21
and may be a pathologic mechanism for the myocardial infarction (MI) associated with MBs.3,16,22
The risk for associated MI seems to vary according to the length and depth of the MB,23
but with the known presence of atherosclerosis associated with an MB, consideration may be given to preventive measures, including statin therapy. CCTA is clearly less helpful in guiding such a decision.
Study Limitations
This study has several important limitations. The study group was relatively small and highly selected. All patients had symptoms of recurrent typical angina as a prerequisite for invasive evaluations. The analysis may therefore suffer from selection bias and heightened awareness for detecting MBs, which may limit generalization of the findings. This study cohort did not include asymptomatic patients or patients with atypical chest pain, in whom it seems far more likely that an anatomically present MB would be an incidental finding. In addition, because we included subjects over a rather long time period, different CT scanners were used, and thus image quality varied.
Conclusions
CCTA compared well with IVUS in the anatomic assessment of MB location, length and depth. In patients with recurrent symptoms of typical angina, yet no obstructive CAD, clinicians should consider dynamic ischemia from a MB in the differential diagnosis. The product of the MB’s length and depth (MMI) may provide some non-invasive insight into the hemodynamic significance of the bridge, as compared with invasive assessment of dFFR.
Acknowledgments
We are indebted to Dr. Koen Neiman, MD, Associate Professor of the Cardiovascular Institute at Stanford University, Stanford, CA, for his valuable input regarding this manuscript.
Funding
This research did not receive any specific grant from funding agencies in the public, commercial, or not-for-profit sectors.
Disclosures
J.A.T. reports receiving honoraria from Boston Scientific. H.-C.B. reports receiving support from Advenchen, Bayer, Bracco, Guerbet, ICON and Siemens.
Supplementary Files
Supplementary File 1
Figure S1.
MMI by CCTA correlates significantly with myocardial bridge (MB) stress dFFR with Spearman rank correlation −0.30 (95% CI −0.52 to −0.02), P=0.042.
Table S1.
Characteristics of patients with and without abnormal dFFR
Please find supplementary file(s);
http://dx.doi.org/10.1253/circj.CJ-17-0284
References
- 1.
Lin S, Tremmel JA, Yamada R, Rogers IS, Yong CM, Turcott R, et al. A novel stress echocardiography pattern for myocardial bridge with invasive structural and hemodynamic correlation. J Am Heart Assoc 2013; 2: e000097.
- 2.
Corban MT, Hung OY, Eshtehardi P, Rasoul-Arzrumly E, McDaniel M, Mekonnen G, et al. Myocardial bridging: Contemporary understanding of pathophysiology with implications for diagnostic and therapeutic strategies. J Am Coll Cardiol 2014; 63: 2346–2355.
- 3.
Ishii T, Ishikawa Y, Akasaka Y. Myocardial bridge as a structure of “double-edged sword” for the coronary artery. Ann Vasc Dis 2014; 7: 99–108.
- 4.
Ge J, Jeremias A, Rupp A, Abels M, Baumgart D, Liu F, et al. New signs characteristic of myocardial bridging demonstrated by intracoronary ultrasound and Doppler. Eur Heart J 1999; 20: 1707–1716.
- 5.
Nakanishi R, Rajani R, Ishikawa Y, Ishii T, Berman DS. Myocardial bridging on coronary CTA: An innocent bystander or a culprit in myocardial infarction? J Cardiovasc Comput Tomogr 2012; 6: 3–13.
- 6.
De Rosa R, Sacco M, Tedeschi C, Pepe R, Capogrosso P, Montemarano E, et al. Prevalence of coronary artery intramyocardial course in a large population of clinical patients detected by multislice computed tomography coronary angiography. Acta Radiol 2008; 49: 895–901.
- 7.
Wang MH, Sun AJ, Qian JY, Ling QZ, Zeng MS, Ge L, et al. Myocardial bridging detection by non-invasive multislice spiral computed tomography: Comparison with intravascular ultrasound. Chin Med J (Engl) 2008; 121: 17–21.
- 8.
Escaned J, Cortes J, Flores A, Goicolea J, Alfonso F, Hernandez R, et al. Importance of diastolic fractional flow reserve and dobutamine challenge in physiologic assessment of myocardial bridging. J Am Coll Cardiol 2003; 42: 226–233.
- 9.
Kim PJ, Hur G, Kim SY, Namgung J, Hong SW, Kim YH, et al. Frequency of myocardial bridges and dynamic compression of epicardial coronary arteries: A comparison between computed tomography and invasive coronary angiography. Circulation 2009; 119: 1408–1416.
- 10.
Humphries KH, Pu A, Gao M, Carere RG, Pilote L. Angina with “normal” coronary arteries: Sex differences in outcomes. Am Heart J 2008; 155: 375–381.
- 11.
Lee BK, Lim HS, Fearon WF, Yong AS, Yamada R, Tanaka S, et al. Invasive evaluation of patients with angina in the absence of obstructive coronary artery disease. Circulation 2015; 131: 1054–1060.
- 12.
Boyd JH, Pargaonkar VS, Scoville DH, Rogers IS, Kimura T, Tanaka S, et al. Surgical unroofing of hemodynamically significant left anterior descending myocardial bridges. Ann Thorac Surg 2017; 103: 1443–1450.
- 13.
Tsujita K, Maehara A, Mintz GS, Doi H, Kubo T, Castellanos C, et al. Comparison of angiographic and intravascular ultrasonic detection of myocardial bridging of the left anterior descending coronary artery. Am J Cardiol 2008; 102: 1608–1613.
- 14.
Senior R, Monaghan M, Becher H, Mayet J, Nihoyannopoulos P. Stress echocardiography for the diagnosis and risk stratification of patients with suspected or known coronary artery disease: A critical appraisal. Supported by the British Society of Echocardiography. Heart 2005; 91: 427–436.
- 15.
Yamada R, Turcott RG, Connolly AJ, Ikeno F, McConnell MV, Schnittger I, et al. Histological characteristics of myocardial bridge with an ultrasonic echolucent band: Comparison between intravascular ultrasound and histology. Circ J 2014; 78: 502–504.
- 16.
Zhang LJ, Yang GF, Zhou CS, Huang W, Lu GM, Shiroishi MS. Multiphase evaluation of myocardial bridging with dual-source computed tomography. Acta Radiol 2009; 50: 775–780.
- 17.
Liu SH, Yang Q, Chen JH, Wang XM, Wang M, Liu C. Myocardial bridging on dual-source computed tomography: degree of systolic compression of mural coronary artery correlating with length and depth of the myocardial bridge. Clin Imaging 2010; 34: 83–88.
- 18.
Niu YJ, Zhang XL, Cao AD, Leng B. Clinical value of the correlations of mural coronary artery compression extent with myocardial bridge length and thickness evaluated by 128-slice CT. Exp Ther Med 2013; 5: 848–852.
- 19.
Leschka S, Koepfli P, Husmann L, Plass A, Vachenauer R, Gaemperli O, et al. Myocardial bridging: Depiction rate and morphology at CT coronary angiography--comparison with conventional coronary angiography. Radiology 2008; 246: 754–762.
- 20.
Ma ES, Ma GL, Yu HW, Wu W, Li K. Assessment of myocardial bridge and mural coronary artery using ECG-gated 256-slice CT angiography: A retrospective study. Sci World J 2013; 2013: 947876, doi:10.1155/2013/947876.
- 21.
Perl L, Daniels D, Schwartz J, Tanaka S, Yeung A, Tremmel JA, et al. Myocardial bridge and acute plaque rupture. J Investig Med High Impact Case Rep 2016; 4: 2324709616680227.
- 22.
Yamada R, Tremmel JA, Tanaka S, Lin S, Kobayashi Y, Hollak MB, et al. Functional versus anatomic assessment of myocardial bridging by intravascular ultrasound: Impact of arterial compression on proximal atherosclerotic plaque. J Am Heart Assoc 2016; 5: e001735.
- 23.
Ishikawa Y, Akasaka Y, Suzuki K, Fujiwara M, Ogawa T, Yamazaki K, et al. Anatomic properties of myocardial bridge predisposing to myocardial infarction. Circulation 2009; 120: 376–383.