Heart Failure
Differential Effects of Myocardial Afadin on Pressure Overload-Induced Compensated Cardiac Hypertrophy
2017 Volume 81 Issue 12 Pages 1862-1870

Details
2017 Volume 81 Issue 12 Pages 1862-1870
Background: Pressure overload induces cardiac hypertrophy, which often ends in heart failure. Afadin is an adaptor protein that is ubiquitously expressed and, in the heart, it localizes at intercalated disks. The current study aimed to examine the afadin-mediated cardiac phenotype in mice exposed to different types of pressure overload: transverse aortic constriction (TAC) burden and angiotensin II (Ang II) stimulation.
Methods and Results: Conditional knockout mice with selective deletion of afadin (afadin cKO) in cardiomyocytes were generated. TAC-operated and Ang II-infused mice at 4 weeks had a similar degree of pressure overload and cardiac hypertrophy in the heart. In afadin cKO mice, TAC operation caused progressive left ventricular dysfunction and heart failure, while Ang II infusion did not deteriorate cardiac function. Furthermore, TAC operation produced more fibrosis and apoptosis in the heart than Ang II infusion, and the expression of growth differentiation factor 15, which can promote apoptosis, in the afadin cKO heart was higher in TAC-operated mice than Ang II-infused ones.
Conclusions: In the 2 pressure overload models, myocardial afadin is involved in mechanical stress-induced, but not pharmacological Ang II-related, compensated cardiac hypertrophy.
A common cause of cardiac hypertrophy is chronic pressure overload to the heart, and if the overload is prolonged, the hypertrophy often leads to terminal heart failure. The cardiac response to the pressure overload is a consequence of a signaling network, which is still incompletely understood. This response results in alteration of cardiac morphology and function due to the development of processes, such as fibrosis, apoptosis, and inflammation.1,2 Epidemiological studies have shown that aging of the human population worldwide has led to an increase in patients with chronic heart failure, for which the major reasons are hypertension and valvular diseases that cause cardiac hypertrophy.3,4 Therefore, detailed knowledge of mechanisms of cardiac hypertrophy might become the basis of much needed improved concepts of treatment.
The renin-angiotensin system (RAS) is one of the critical mediators in cardiac pathophysiology. The systemic and intracardiac RASs modulate signaling pathways and gene expression,5,6 mainly through angiotensin type 1 receptor (AT1R).7 This occurs not only in cardiomyocytes, but also in non-cardiomyocyte cell types, to drive the process in the development of cardiac hypertrophy.8 Angiotensin II (Ang II) is a central active component of RAS.9 Ang II induces cardiac hypertrophy by: (1) extracardiac mechanisms (increased arterial resistance, and sodium and water retention); and (2) by direct binding to cardiac AT1R and subsequent stimulation of downstream signaling.10 AT1R in cardiomyocytes is also a pressure sensor. Mechanical stress can establish specific active receptor conformation without the involvement of Ang II that is sufficient to evoke a hypertrophic response.11,12
Afadin is an ubiquitously expressed actin-binding adaptor protein. Together with nectins, afadin forms an adhesive complex in adherens junctions.13,14 Afadin has wide biological functionality, ranging from embryonic growth and cellular physiology to cancer progression.15–17 This protein is a constituent of cardiac intercalated disks, but until recently, its role in heart physiology was unknown. We reported that myocardial afadin is an obligatory component of left ventricular (LV) function supporting machinery during chronic pressure overload.18 In mice with selective deletion of afadin in cardiomyocytes (afadin cKO), transverse aortic constriction (TAC) evoked significant LV systolic dysfunction because of enhanced macrophage infiltration, fibrosis, and apoptosis. Afadin appears to counteract adverse cardiac phenotypes through interaction with transforming growth factor-β signaling.
In the current investigation, we clarify the effects of afadin in another model of pressure overload in mice using Ang II delivery by micro-osmotic pump. Unexpectedly, Ang II infusion did not deteriorate cardiac function in afadin cKO mice, although similar progression of LV hypertrophy was observed between TAC and Ang II models. Our results suggest that afadin predominantly opposes cardiac dysfunction initiated by a TAC-induced mechanical burden, but not by Ang II-stimulated overload.
C57BL/6 mice with homozygous floxed exon 2 of the afadin gene were crossed with mice expressing Cre recombinase under the control of the α-myosin heavy chain gene promoter (Myh6-Cre; Jackson Laboratory, Bar Harbor, ME, USA). This was performed to create afadin cKO with selective afadin deletion in cardiomyocytes.18,19 Mice harboring afadin-floxed alleles alone were used as controls.
Chronic Pressure Overload Models in MiceTreatment of the animals was approved and followed the guidelines of the Animal Ethics Committee of the Shiga University of Medical Science, Japan.
Ang II-Infusion Model Mice were anesthetized by an intraperitoneal injection of 30 mg/kg pentobarbital sodium and implanted with subcutaneous micro-osmotic pumps (ALZET model 1004; Durect Corp., Cupertino, CA, USA) to deliver Ang II for 4 weeks at a constant flow of 400 ng∙kg−1∙min−1 or saline, as previously reported.20
TAC-Operation Model Mice were anesthetized, as described above, and ventilated through an intratracheal cannula (rodent ventilator model 28025; Ugo Basile, Varese, Italy). The tidal volume was set to 0.1–0.2 mL and the rate of respiration to 120/min. The aortic arch was approached through the left second intercostal space. Silk (7-0) surgical thread was tightened around a 27-gauge needle immediately distal to the innominate artery to create a fixed mechanical obstruction with a diameter of approximately 0.4 mm. Sham mice underwent a similar procedure to that of the TAC operation, except for ligation of the ascending aorta. Ang II/saline-infused and TAC/sham mice were sacrificed after 4 weeks of in vivo observation.
Measurement of Blood Pressure (BP)Arterial BP was measured non-invasively in conscious mice by the plethysmographic tail-cuff method (model BP-98-AL; Softron, Tokyo, Japan). Mice were warmed for at least 5 min at 37℃ in the cylindrical thermostat of the BP-98-AL machine before and during the course of BP measurement. BP was measured in 2-min intervals and the mean of 5 steady state measurements was accepted as the true BP in each mouse.
Cardiac Ultrasound ImagingLV dimensions and pump function were monitored by transthoracic ultrasonography on the Vevo 2100 system (VisualSonics Inc., Toronto, Canada). During the procedure, mice were anesthetized on a 37℃ heating table with an isoflurane/air mix (induction with 4% and maintenance with 1.0–1.5% isoflurane). Two-dimensional (B mode)-guided M mode images of LV were recorded in the parasternal short-axis position at the level of the papillary muscles and used for evaluation of LV parameters. LV mass was calculated by using the following formula: LV mass (mg)=1.055×[(LVDd+PWd+IVSd)3−LVDd3], where LVDd indicates LV diastolic diameter (mm), and PWd and IVSd indicate diastolic thickness of LV posterior wall and interventricular septum (mm), respectively.21,22 The aortic arch and TAC stenosis were visualized in the B mode and color Doppler mode. Peak blood velocity (V, m/s) through the stenotic site was assessed by pulsed-wave Doppler mode. The pressure drop/gradient was calculated using the simplified Bernouli equation as follows: pressure gradient=4V2 (mmHg).23,24 Addition of the value of the stenotic pressure gradient to systemic systolic BP provides prestenotic systolic BP in the ascending aorta.
Histological Staining of Heart Sections and ImmunohistochemistryMice hearts were frozen within water-soluble medium (Surgipath FSC 22; Leica Biosystems, Wetzlar, Germany) or fixed with 4% paraformaldehyde, and subsequently embedded in paraffin blocks. Cryosections, 10-μm thick, were fixed by 4% paraformaldehyde on the top of poly-L-lysine-coated slides immediately after cutting the sections in a cryostat (Leica Biosystems). The sections were then permeabilized with 0.1% Triton X-100 and blocked with 1% bovine serum albumin. Primary antibody (Ab) was applied in bovine serum albumin-containing blocking solution overnight followed by a 1-h incubation with fluorescent dye-labeled secondary Ab. Confocal images were taken by using C1si Laser Scanning Microscope (Nikon, Tokyo, Japan). Paraffin sections, 4-μm thick, were stained with Masson’s trichrome using standard techniques. Images for analysis of myocardial histology were captured by using a color CCD camera (MicroPublisher 5.0 RTV; Qimaging, Surrey, BC, Canada) under the control of Image-Pro Plus software (Media Cybernetics, Rockville, MD, USA) mounted on a Nikon FXA light microscope. Interstitial fibrotic content in cardiac sections was quantified as a ratio of the collagen-positive area/whole area of visible myocardium×100 (%) using Fiji software.25
Apoptosis AssaysActivated apoptotic signaling in cardiomyocytes was assessed by the immunostaining of frozen cardiac sections for cleaved caspase 3, and the fractional area of positive staining was compared among all groups. To detect fragmented DNA in apoptotic nuclei, the terminal deoxynucleotidyl transferase-mediated dUTP nick-end-labeling (TUNEL) reaction was performed on sections of frozen hearts (DeadEndTM Fluorometric TUNEL System; Promega, Madison, WI, USA) and fluorescence of stained nuclei was visualized by using a confocal microscopy. For each studied group of mice, the percentage of TUNEL-positive nuclei was estimated after evaluation of 1000 nuclei in every cardiac section.
Dilutions/Working Concentrations of Abs and Fluorescent DyesWe used anti-cleaved caspase 3 (1:400) rabbit monoclonal Ab (Cell Signaling Technology, Danvers, MA, USA), anti-GDF15 (1:100) mouse monoclonal Ab (Santa Cruz Biotechnology, Dallas, TX, USA), Alexa Fluor 488 (1:1,000) goat anti-rabbit Ab, wheat germ agglutinin tetramethylrhodamin conjugate (5 μg/mL), propidium iodide (1 μg/mL) (Invitrogen, Carlsbad, CA, USA), and 4´,6-diamidino-2-phenylindole (DAPI) (1 μg/mL) (Dojindo, Kumamoto, Japan).
Langendorff’s Perfusion ProtocolsControl and afadin cKO mice were anesthetized with pentobarbital sodium (30 mg/kg intraperitoneally). After thoracotomy, the heart was excised and immersed in the ice-cold Krebs-Henseleit bicarbonate buffer (composition in mmol/L: NaCl 118.5, NaHCO3 25, KCl 4.7, MgSO4 1.2, KH2PO4 1.2, glucose 11, and CaCl2 1.2), as described previously.26 The ascending aorta was cannulated with metal cannula (19 gauge). Then, the heart was mounted on the Langendorff’s apparatus (ADInstruments Pty Ltd, Bella Vista, NSW, Australia), and perfused with 95% oxygen/5% carbon dioxide bubbled, 37℃ warmed Krebs-Henseleit buffer at the rate of 6 mL/min to apply high mechanical stress to LV cardiomyocytes. Heart perfusion was maintained for 20 min in order to avoid significant consequences of ischemia and edema on the myocardium. Flow rate and pressure are recorded by LabChart software (ADInstruments Pty Ltd).
Quantification of mRNA in Mouse CardiomyocytesTotal RNA was extracted by using RNeasy Fibrous Tissue Kit (Qiagen, Hilden, Germany). cDNA was synthesized by reverse transcription PCR (ReverTra AceTM qPCR RT Master Mix, Toyobo, Osaka, Japan) with a random primer. Samples for qPCR were prepared by using Light Cycler 480 SYBR Green I Master (Roche, Basel, Germany) and amplified in a Roche Light Cycler 480 with the following primers: natriuretic peptide A forward 5´-GAGGAGAAGATGCCGGTAGAAGA-3´ and reverse 5´-GAGCACTGCCGTCTCTCAGA-3´ (product length 148 bp); natriuretic peptide B forward 5´-AGCTGCTGGAGCTGATAAGAGAA-3´ and reverse 5´-TGCCCAAAGCAGCTTGAGATATG-3´ (product length 178 bp); connective tissue growth factor forward 5´-CTCCACCCGAGTTACCAATGAC-3´ and reverse 5´-GTGCAGCCAGAAAGCTCAAAC-3´ (product length 171 bp); tumor necrosis factor-α forward 5´-ATGAGCACAGAAAGCATGATC-3´ and reverse 5´-TACAGGCTTGTCACTCGAATT-3´ (product length 276 bp); interleukin-6 forward 5´-GACAAAGCCAGAGTCCTTCAGAGA-3´ and reverse 5´-CTAGGTTTGCCGAGTAGATCTC-3´ (product length 170 bp); and growth differentiation factor 15 forward 5´-GAGACTCGAACTCAGAACCAAG-3´ and reverse 5´-CTTCAGGGGCCTAGTGATGTC-3´ (product length 204 bp). The quantity of mRNA that was measured by the crossing points in qPCR was normalized to the value of β-actin in the same samples and the ratios were used for comparison.
Statistical AnalysisAll numerical values are shown as mean±standard error of the mean. Differences between 2 groups were examined by using the Student’s t-test. Three or more grouped data were evaluated by one-way analysis of variance followed by Tukey’s post-hoc test.
We first compare hemodynamics between TAC-operated or Ang II-infused mice for 4 weeks. To estimate mechanical load on LV during systole in TAC-operated mice, we calculated prestenotic systolic BP in the ascending aorta by echocardiography. The aortic arch in mice after the 4-week sham or TAC procedure was depicted in B mode (Figure 1A). Blood flow velocity through the intact and stenotic aortic arches was visualized in color Doppler mode (Figures 1A; Movies S1,S2). Measurement of peak blood flow velocity was conducted in pulsed-wave Doppler mode (Figure 1A). Then, the mean peak blood flow velocity and the pressure gradient were calculated (Figure 1B). The values are in agreement with previous studies.23,27 Systolic BP proximal to TAC (ascending aorta) was estimated by addition of the pressure gradient to systemic systolic BP, as measured from the tail artery (Figure 1C). Ang II induced systolic and diastolic hypertension without heart rate alteration, and saline had no effect on BP and heart rate (Figure 1D). Taken together, systolic BP elevated by Ang II was similar to that proximal to TAC for 4 weeks, although the mode of increase of BP is different between the 2 models. TAC causes an immediate increase in mechanical tension, resulting in rapid BP elevation proximal to the stenosis,27 while Ang II infusion gradually raises systemic BP, reaching the maximal values within approximately 2 weeks.28

Hemodynamic effects in mice exposed to transverse aortic constriction (TAC) burden or angiotensin II (Ang II) infusion for 4 weeks. (A) Visualization and measurement of the pressure gradient through the TAC stenosis (arrow). B mode and color Doppler mode images show morphology and blood flow through the normal aortic arch and stenosis caused by TAC. Numbers in the B mode/sham image indicate the following: 1, ascending aorta; 2, innominate artery; 3, left common carotid artery; and 4, left subclavian artery. Pulsed-wave (PW) Doppler images show enhanced blood flow velocity through the stenotic site. (B) Mean peak blood flow velocity and calculated pressure gradient in the ascending aorta in sham mice and across TAC stenosis. (C) Mean systemic systolic blood pressure (BP) in TAC-operated mice as measured from the tail artery, and calculated systolic BP in the ascending aorta proximal to the TAC stenosis. *P<0.05. (D) BP and heart rate (Inset) in mice that were infused with saline or Ang II. *P<0.05 vs. 0 week, n=8 per group.
The LV dimensions and function were followed in vivo by cardiac echography before and every 2 weeks during the observational period. As presented in our previous report,18 TAC in afadin cKO mice evoked LV hypertrophy, with an increase in LV wall thickness and mass, and attenuated LV pump function evaluated by ejection fraction, compared with that in control mice (Figure 2A,B). Next, we examined the effect of Ang II on afadin cKO mice. Ang II infusion caused a similar degree of progression of LV hypertrophy to TAC (Figure 2C,D). However, we found that Ang II infusion for 4 weeks did not deteriorate cardiac function in afadin cKO as well as control mice. Other echocardiographic parameters are shown in Table.

Left ventricular (LV) dimensions and function during 4-week transverse aortic constriction (TAC) burden or angiotensin II (Ang II) infusion. (A,C) Typical images of M mode echocardiography. (B,D) Summary graphs of LV wall thickening evaluated by LV posterior wall diastolic thickness (LVPWd), LV mass, and ejection fraction (n=8–9 per group). Control: afadin-floxed mice. *P<0.05 vs. 0 week.
| TAC | Ang II | |||
|---|---|---|---|---|
| Control | Afadin cKO | Control | Afadin cKO | |
| IVSd (mm) | ||||
| 0 weeks | 0.58±0.02 | 0.58±0.02 | 0.68±0.02 | 0.68±0.01 |
| 2 weeks | 0.80±0.03* | 0.77±0.02* | 0.75±0.03 | 0.78±0.03* |
| 4 weeks | 0.80±0.03* | 0.77±0.03* | 0.87±0.04* | 0.87±0.03* |
| LVDd (mm) | ||||
| 0 weeks | 3.97±0.08 | 3.85±0.10 | 3.87±0.08 | 3.87±0.03 |
| 2 weeks | 3.86±0.08 | 3.88±0.07 | 4.12±0.15 | 3.78±0.04 |
| 4 weeks | 3.93±0.11 | 4.06±0.10 | 3.98±0.15 | 3.91±0.04 |
| FS (%) | ||||
| 0 weeks | 34.41±2.61 | 34.17±1.39 | 37.00±1.45 | 37.20±1.89 |
| 2 weeks | 34.00±1.64 | 26.92±2.74 | 35.47±1.81 | 35.27±2.40 |
| 4 weeks | 35.56±3.20 | 22.73±2.30* | 39.42±1.85 | 33.20±1.67 |
Ang II, angiotensin II; cKO, conditional knockout; FS, fractional shortening; IVSd, interventricular septal thickness at diastole; LVDd, left ventricular end-diastolic diameter; TAC, transverse aortic constriction. *P<0.05 vs. 0 week.
Morphometry of the hearts and lungs after 4 weeks of TAC and Ang II challenge confirmed the above findings. TAC operation and Ang II infusion similarly enlarged the heart, compared with sham operation (Figure 3A,B). A direct effect of LV pump failure is congestion in the pulmonary circulation and a resultant rise in lung mass.29 There was a small but significant increase in normalized lung weight in afadin cKO mice compared with control mice after TAC operation, but Ang II treatment or sham operation did not increase normalized lung weight (Figure 3C). These results suggest that the inhibitory role of afadin in the development of cardiac dysfunction and failure is dependent on the types of pressure overload.

Morphometry of the hearts and lungs after a 4-week transverse aortic constriction (TAC) burden or angiotensin II (Ang II) infusion. (A) Typical images of hearts exposed to sham operation, TAC burden or Ang II infusion. Heart weight is indicated in each image. (B) Summary graphs of normalized heart weight (heart weight to tibia length ratio). (C) Summary graphs of normalized lung weight (lung weight to tibia length ratio). In (B) and (C), n=3–4 per group. Control: afadin-floxed mice. *P<0.05.
To explore the reason why afadin deletion in cardiomyocytes differentially responded to TAC operation and Ang II infusion, we examined the interstitial fibrosis, which affects cardiac function,30 by Masson’s staining that detects collagen deposition. Positively stained areas in the sections of TAC-operated afadin cKO hearts were more abundant than those in control hearts, while these areas were similar between Ang II-infused control and afadin cKO hearts (Figure 4). Moreover, the level of collagen accumulation in the heart of TAC-operated afadin cKO mice was higher than that of Ang II-infused afadin cKO mice. These findings suggest that deletion of afadin accelerates TAC-induced, but not Ang II-related, myocardial fibrosis, leading to cardiac dysfunction.

Effects of transverse aortic constriction (TAC) and angiotensin II (Ang II) on myocardial collagen production after 4-week treatment. (A) Masson’s staining of cardiac sections from mice of each group. The blue color indicates collagen deposition. (B) Summary graph of quantified fibrotic areas (stained in blue). Control: afadin-floxed mice. *P<0.05, n=6 per group.
Cardiomyocyte loss in the presence of accelerated apoptosis is a causative factor in the progression of cardiac dysfunction and heart failure.31 We investigated activation of apoptosis by using 2 methods: the main cellular effector of the apoptotic process, cleaved caspase 3,32 and the TUNEL reaction, which detects DNA fragments that are produced by digestion of nuclear DNA in the caspase 3-mediated apoptotic process.33 In TAC-operated mice, staining of cleaved caspase 3, an active form of caspase 3, by immunohistochemistry detected significant activation of apoptosis in afadin cKO hearts, compared with control hearts (Figure 5A,B). In addition, TAC-operated afadin cKO hearts had more accentuated staining than Ang II-infused hearts. In Ang II-infused mice, there was no difference in the staining between control and afadin cKO hearts. Corresponding to cleaved caspase 3 staining, TUNEL-positive nuclei showed a significantly higher density in TAC-operated afadin cKO hearts than in control hearts (Figure 5C,D). In the afadin cKO TAC group, the percentage of TUNEL-positive nuclei was higher than that in the afadin cKO Ang II group. Increased apoptosis in afadin cKO hearts exposed to TAC may be associated with the promotion of myocardial fibrosis, and crucially contribute to deterioration of cardiac function. To exclude the possibility that afadin-deleted cardiomyocytes have less contractility against mechanical stress than control cardiomyocytes, we conducted the Langendorff’s perfusion experiment using the hearts isolated from control and afadin cKO mice. When the hearts were perfused with high constant flow (6 mL/min) to induce excessive mechanical load to LV cardiomyocytes, both hearts generated equal LV systolic (∼210 mmHg) and diastolic (∼160 mmHg) pressure with identical LV beating rate (Figure S1), suggesting that the functional contraction of cardiomyocytes is not reduced by ablation of afadin in the pressure-overloaded conditions.

Staining of apoptotic markers after a 4-week treatment. (A) Immunohistochemistry for cleaved caspase 3 in mouse hearts. (B) Summary graphs of the percentage of the fractional area positive for cleaved caspase 3. (C) Fractionated DNA (arrows) detected by the transferase-mediated dUTP nick-end labelling (TUNEL) reaction in nuclei. (D) Summary graphs of the percentage of TUNEL-positive nuclei. Control: afadin-floxed mice. *P<0.05, n=3–4 per group.
Finally, we aimed to understand the mechanism responsible for the difference in cardiac phenotype in the TAC and Ang II models. We quantified mRNA of several molecules that are related to cardiac injury or inflammation in afadin cKO hearts that underwent 4 weeks of sham operation, TAC challenge or Ang II infusion.34,35 The amounts of mRNA of tested molecules were all elevated by TAC or Ang II stimulation compared with sham, except for growth differentiation factor 15 (GDF15; also called non-steroidal anti-inflammatory drug-activated gene 1, macrophage inhibitory cytokine 1, or prostate-derived factor). The mRNA amount of GDF15 was significantly less in Ang II-infused mice than TAC-operated mice, while those of the other molecules were similar between TAC operation and Ang II infusion (Figure 6A). The expression of GDF15 in the protein level was also confirmed by Western blotting (Figure 6B). Because it is known that GDF15 promotes apoptosis,36,37 reduced expression of GDF15 may contribute to the suppression of apoptotic response in Ang II-treated afadin cKO hearts.
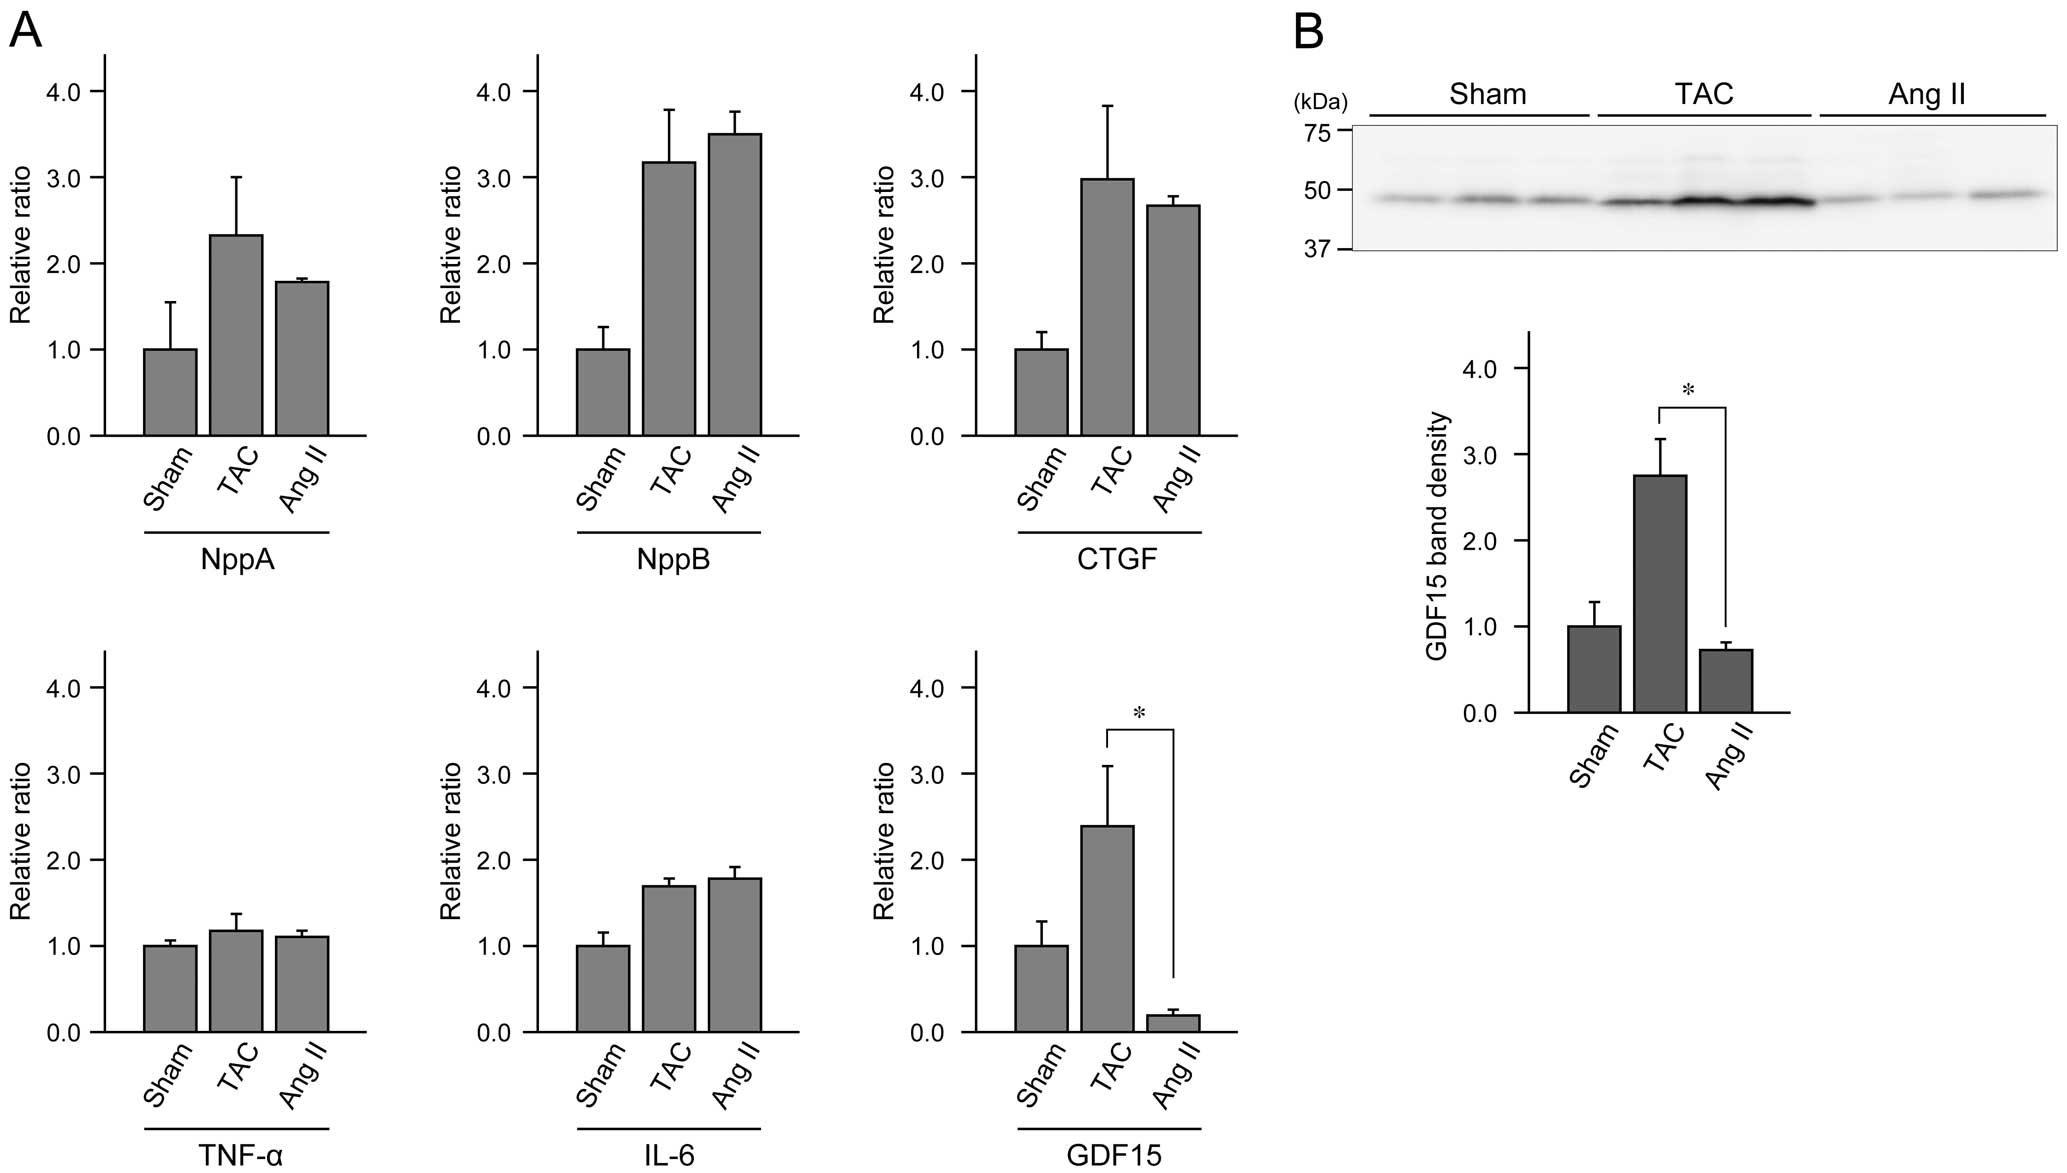
Comparison of expression levels of regulatory molecules related to cardiac function and inflammation after 4-week of sham operation, transverse aortic constriction (TAC) burden or angiotensin II (Ang II) infusion in afadin conditional knockout (cKO) mice. (A) mRNA levels of each molecule quantified by quantitative polymerase chain reaction (qPCR). NppA, natriuretic peptide A; NppB, natriuretic peptide B; CTGF, connective tissue growth factor; TNF-α, tumor necrosis factor-α; IL-6, interleukin-6; GDF15, growth differentiation factor 15. (B) Western blotting for GDF15. The value of sham-operated hearts is set as 1.0. *P<0.05, n=3–4 per group.
TAC burden and Ang II treatment produce chronic pressure overload, and in our experiments, a similar degree of cardiac hypertrophy was observed in both TAC- and Ang II-challenged hearts. In control mice, TAC operation or Ang II infusion did not affect LV pump function. In afadin cKO mice, however, responses to TAC and Ang II were different; Ang II infusion did not deteriorate cardiac function, while TAC operation induced LV dysfunction and heart failure. The discordant effect of TAC and Ang II on LV function in afadin cKO mice may be due to the differences in at least hemodynamics. Only considering the tension of LV, the time-course of LV hemodynamic load is dissimilar at the beginning of TAC and Ang II exposure. There is a slow increase in LV afterload in the Ang II model,28 and is an abrupt and steady mechanical stress to LV in TAC procedure. Afadin might be important for instantaneous resistance against the mechanical burden to LV. Slow development of pressure overload in the Ang II model may allow activation of protective mechanisms that maintain LV function even in the absence of afadin, although Ang II strongly stimulates various signaling pathways in cardiomyocytes, which modulates cardiac function, mainly through AT1R, a G protein-coupled receptor (GPCR).38–40 Based on the fact that we did not identify an adverse cardiac phenotype in afadin cKO hearts of Ang II-infused mice, it appears that there is no interaction of afadin with AT1R itself and/or its downstream signaling molecules activated by Ang II.
In addition, Ang II type 1 receptor (AT1R) is one of the mechanosensors in the heart. It is demonstrated that even in the absence of Ang II, AT1R and downstream signaling are activated and cardiac hypertrophy is developed by TAC-mediated mechanical stretch.12 It is also shown that the active conformation of AT1R during mechanical stimulation is not identical to its active conformation after binding of Ang II.11 Particular conformation of activated GPCRs such as AT1R is known to have selective affinity to specific G proteins.41 Therefore, the signaling triggered by different stimuli acting on the same GPCR depends on the activation of a specific G protein and its downstream molecules. Considering the above, the inconsistency in the cardiac phenotype between Ang II-treated and TAC-operated afadin cKO mice in our study is most probably a result of different intracellular processes, as suggested by quantification of GDF15 mRNA and protein levels (Figure 6). Afadin appears to participate in the signaling inside cardiomyocytes during mechanical overload, but not in Ang II-stimulated signaling. In fact, similar distinction of cardiac phenotype is reported about NADPH oxidase-induced cardiac hypertrophy. In gp91phox knockout hearts, NADPH oxidase activation and hypertrophic response are inhibited in Ang II-infused mice, but persist in the TAC-operated ones due to the stimulation of an alternative signaling mechanism.42
Systolic heart failure is known to be accompanied by ventricular cavity expansion due to the decline of the ejection fraction. Lack of increase of LV dimensions in the afadin cKO TAC hearts in our data looks unusual, but in fact, after 4 weeks of TAC procedure, LV of afadin cKO mice gradually expands, as can be seen in our previous study.18 It appears that during the first 4 weeks after TAC operation, LV can resist the expansion of the cavity because of relatively small systolic dysfunction and/or available collagen accumulation, which may counteract the increased intraventricular diastolic pressure that is created by the blood congestion in the left part of the circulation.
Accelerated fibrosis and apoptosis in the heart are the adverse cardiac responses, and are causative factors for transition to or progression of heart failure.30,31,43,44 We found significant upregulation of fibrosis and apoptosis in TAC-operated afadin cKO hearts compared with control hearts. Additionally, this upregulation was not observed in Ang II-treated hearts, and the apoptotic process and fibrogenesis in the heart were less activated by Ang II treatment than TAC operation in afadin cKO mice. This finding suggests that prevention of cardiomyocyte loss and fibrotic alteration appears to be a key factor to maintain cardiac function in Ang II-infused afadin cKO mice. In support of this observation, expression of GDF15, a promoter of apoptosis, was significantly reduced in the hearts of Ang II-infused afadin cKO mice compared with that of TAC-operated mice. This may also contribute to inhibition of the progress of LV dysfunction induced by Ang II-mediated pressure overload in the afadin-deleted heart.
In conclusion, afadin has different cardioprotective effects against stimuli that mediate a heavy cardiac burden. In afadin cKO mice, Ang II stimulation caused cardiac hypertrophy, but not dysfunction, whereas TAC burden induced cardiac hypertrophy and consequent dysfunction. Thus, afadin appears to interact with mechanical stress-induced signaling, but might not be associated with Ang II/AT1R-coupled pathways.
We thank Mr. Akira Yokoe and Mr. Takefumi Yamamoto at Shiga University of Medical Science for their excellent technical assistance in this study, and Dr. Miki Tanaka-Okamoto and Dr. Jun Miyoshi at Osaka Medical Center for Cancer and Cardiovascular Disease for kindly providing us with afadin-floxed mice.
Grants-in-aid for Scientific Research <KAKENHI> from Japan Society for the Promotion of Science, Takeda Science Foundation, The Naito Foundation.
Supplementary File 1
Figure S1. Langendorff’s perfusion of isolated control and afadin conditional knockout (cKO) hearts perfused with constant flow rate to induce strong mechanical burden on left ventricle (LV).
Supplementary File 2
Movie S1. Color Doppler mode echocardiographic recordings show aortic arch morphology and blood flow in the intact vessels (Movie S1) and after the transverse aortic constriction (TAC) operation (Movie S2). Anatomy of the aortic arch, and the origin of the innominate, common carotid and left subclavian arteries are clearly seen. The blue color indicates flow in the outward direction of the transducer, and the red color indicates flow toward the direction of the transducer. A turbulent jet in the stenotic location of the ascending aorta can be seen in colors of the yellow spectrum.
Supplementary File 3
Movie S2.
Please find supplementary file(s);
http://dx.doi.org/10.1253/circj.CJ-17-0394