Abstract
Background:
The force-frequency relation (FFR) is a hemodynamic index of the chronotropic relationship between left ventricular (LV) systolic function (percent change in dP/dtmax) and elevation of heart rate. FFR is a marker of myocardial contractile reserve and follows an upward slope in healthy myocardium [monophasic FFR (MoF)], a pattern that becomes biphasic (BiF) under pathological conditions. However, it remains uncertain whether the FFR determines a patient’s prognosis. We investigated the promising role of the FFR as a predictor of cardiac events in the setting of hypertrophic cardiomyopathy (HCM).
Methods and Results:
A total of 113 consecutive patients with HCM (New York Heart Association (NYHA) class I–II) were retrospectively evaluated; 27 (23.9%) had a BiF pattern and they experienced a higher incidence of cardiac events compared with those showing an MoF pattern (median follow-up, 4.7 years; P<0.001). Furthermore, Cox proportional hazard regression analysis revealed that the LV end-diastolic volume index (hazard ratio: 1.051, P=0.014) and BiF pattern (hazard ratio: 15.260, P=0.001) were independent predictors of primary cardiac events. Interestingly, abnormal reductions in myocardial regulatory molecules related to contractility (SERCA2α) were observed exclusively in the patients exhibiting a BiF pattern.
Conclusions:
The FFR reflects latent myocardial abnormalities and predicts cardiac events in the setting of HCM, even during the asymptomatic stages of the disease.
Hypertrophic cardiomyopathy (HCM) is a widely known myocardial disease affecting approximately 1 in 500 individuals.1
Notably, the clinical course of HCM is variable and may include natural longevity, sudden cardiac death (SCD),2
progressive heart failure followed by end-stage heart failure, atrial fibrillation and stroke.3
The comprehensive major risk factors (RFs) for SCD in HCM are as follows: ventricular tachycardia, syncope, family history, maximum left ventricular (LV) wall thickness, abnormal systolic blood pressure responses,4
age, left atrial diameter and hypertrophic obstructive cardiomyopathy (HOCM).5–7
Previous studies have demonstrated that approximately 3–5% of patients with HCM exhibiting either no risk or a low (exhibiting only one RF) risk of SCD experienced cardiac events8
and that the overall mortality rate of HCM among patients with a low risk of SCD was high as 0.53–0.6% per year.9,10
It is important to estimate the latent myocardial damage in the setting of asymptomatic stages of HCM.
In normal myocardium, an increased heart rate progressively enhances the force of ventricular contraction (Bowditch’s staircase phenomenon).11
This theory is known as the force-frequency relationship (FFR), which is indicative of the chronotropic potential of myocardial contractility. In healthy myocardium, the FFR increases in response to heart rate (monophasic FFR pattern: MoF). However, the FFR assumes a biphasic (BiF) pattern that presumably reflects latent myocardial abnormalities in the setting of heart disease. Indeed, previous studies have demonstrated that either a flat or a negative FFR pattern is indicative of limited contractile reserve in HCM.12,13
However, it remains unclear whether changes in FFR affect clinical outcomes or if a BiF is associated with a poor prognosis in the setting of HCM. Therefore, we investigated the promising role of the FFR as a predictor of cardiac events in the setting of HCM during the disease’s clinically asymptomatic stages.
Methods
Study Population
We enrolled 113 consecutive patients with HCM with preserved LV ejection fraction (from 1998 to 2014). HCM was diagnosed by cardiovascular specialists based on patient examinations and previously proposed diagnostic criteria.14
All patients underwent laboratory measurements, echocardiography, cardiac catheterization, and endomyocardial biopsies to exclude a diagnosis of secondary cardiomyopathy attributable to known systemic conditions. At the time of registration, patients were excluded if they had coronary artery stenosis requiring therapeutic intervention, prior evidence of primary valvular disease, cardiac hypertrophy caused by essential or secondary hypertension, chronic atrial fibrillation, or implanted cardiac pacemaker or defibrillator. Furthermore, patients classified as New York Heart Association (NYHA) functional class III or IV were excluded. Composite cardiac events were defined as SCD, admission for worsening heart failure and automated implantable cardioverter defibrillator implantation because of lethal arrhythmia. Daily doses of β-blockers were recorded as carvedilol equivalents (carvedilol-equivalent doses: bisoprolol, 0.2).15
The study protocol was approved by the Ethics Review Board of the Nagoya University School of Medicine (approval no. 359), and written informed consent was provided by all study subjects.
Patient Assessment
A comprehensive assessment of the major RFs for SCD was recommended in the 2011 ACCF/AHA4
and 2014 ESC5
guidelines for HCM. In the present study, the RFs for SCD were defined as follows: (1) documented non-sustained ventricular tachycardia, defined as >3 consecutive ventricular extra systoles during Holter monitoring; (2) unexplained syncope; (3) family history of SCD; (4) maximal LV wall thickness >30 mm on echocardiography; (5) abnormal systolic blood pressure response to exercise in patients <40 years of age (a rise in systolic blood pressure <20 mmHg from rest to peak exercise on a treadmill); and (6) hypertrophic obstructive cardiomyopathy (HOCM) characterized by an LV outflow tract (LVOT) obstruction with a resting gradient >30 mmHg.
Echocardiography
Standard M-mode and 2D echocardiography, Doppler blood flow, and tissue Doppler imaging measurements were performed in accordance with the American Society of Echocardiography guidelines using a Vivid 7 system (Vivid 7, GE Healthcare, WI, USA).14
LV ejection fraction was calculated using 2D apical images and the modified Simpson’s method. LV mass was also calculated using 2D measurements with a formula approved by the guidelines. Apical HCM (APH) was defined as LV wall thickness confined to the most distal region at the apex below the papillary muscle level.
Cardiac Catheterization and the FFR Evaluation Protocol
All patients underwent biventricular cardiac catheterization analysis and an atrial pacing study to evaluate the FFR. Right heart catheterization was performed using a 7F triple-lumen Swan-Ganz thermodilution pulmonary artery catheter (Edwards Life Science Co., CA, USA) at rest. After baseline hemodynamic data were collected, a 6F fluid-filled pigtail catheter with a high-fidelity micromanometer (CA-61000-PLB Pressure-tip Catheter, CD Leycom, Zoetermeer, the Netherlands) was advanced into the LV cavity through either the right or left upper limb artery to measure LV pressure. Finally, a 5F pacing catheter (St. Jude Medical Inc., MN, USA) was introduced through the right jugular vein and positioned in the high right atrium. To evaluate the FFR, right atrial pacing was initiated at 80 pulses per minute (ppm) and subsequently increased in increments of 10 ppm until 140 ppm was reached. The maximum pacing rate was defined as the heart rate at which either second-degree atrioventricular block or pulsus alternans occurred, as previously described.12,13
FFR Patterns and Patient Classification
Previously, we reported 2 types of FFR pattern in patients with HCM.12,13
The MoF pattern was defined as a progressive increase in LV dP/dtmax
with increases in the pacing rate, whereas the BiF pattern was defined as an initially positive slope followed by a negative slope, with a decrease in LV dP/dtmax
>5% from the highest value to the value at the maximum pacing rate.12,13
Representative traces for the patients with MoF and BiF patterns are shown in
Figure 1A.
Endomyocardial Biopsy Samples
An endomyocardial biopsy was performed to exclude secondary cardiomyopathies such as storage disorders and specific heart muscle diseases. Several biopsy specimens were obtained from the right side of the interventricular septum using a 6F cardiac bioptome catheter (Myocardial Biopsy Forceps, Technowood®, Tokyo, Japan). Endomyocardial biopsy samples used for western blotting analysis were immediately frozen using liquid nitrogen and stored at −80℃ until needed.
Measurement of Cardiac Remodeling via Histology
Myocardial fibrosis in each biopsy specimen was assessed using Sirius red staining, and the positive region was quantified as the collagen volume fraction (CVF). The CVF was calculated by averaging the total connective tissue area from 10 representative fields within sections excluding endocardium and perivascular collagen to specify interstitial fibrosis in a sample-label-blinded fashion. To evaluate cardiac hypertrophy at the histological level, we measured the cardiomyocyte surface area (CSA) in each cardiac biopsy specimen stained with hematoxylin and eosin (H&E). The CVFs were digitized and quantified using Image-J software (version 1.49), and CSA was quantified using a BZ-9000 (Keyence, Osaka, Japan).
Western Blot Analysis
Each myocardial tissue specimen was subjected to frost shattering using a CryopressTM
(Microtech Nichion K.K., Chiba, Japan). The proteins were extracted in RIPA buffer containing protease and phosphatase inhibitor cocktails. Equal amounts (10 μg) of protein from each group were electrophoresed and subjected to western blotting analysis. The protein bands were detected using antibodies specific for the following proteins: SERCA2α (Merck Millipore, Darmstadt, Germany), phospholamban (Thermo Scientific, MA, USA), GAPDH (Cell Signaling Technology, MA, USA) and troponin-T (Santa Cruz Biotechnology, TX, USA). The density of each protein band was analyzed using image analysis software (Image J 1.49) and was normalized to a corresponding amount of GAPDH.
Statistical Analysis
The data are presented as the mean±standard deviation. All statistical analyses were performed with the Statistical Package for the Social Sciences 18.0 software (SPSS/IBM Inc., IL, USA). Parametric variables were compared using Student’s t-test, and non-parametric variables were compared using the Mann-Whitney U-test. The categorical variables were compared using either the chi-square or Fisher’s exact test. Cumulative survival curves were constructed as time-to-first-event plots using the Kaplan-Meier method. Relative risks and 95% confidence intervals were calculated using univariate and multivariate Cox proportional hazards regression models. Multivariate analyses were performed using a forced entry model in which each significant variable included in the univariate analysis was entered into the model, as follows: age, pulmonary artery wedge pressure, LV end-diastolic volume index (LVEDVI), and BiF pattern. P<0.05 was considered statistically significant.
Results
Baseline Clinical Characteristics
Figure 1A
compares representative traces of LV pressure obtained from patients with a MoF pattern or a BiF pattern. The protocol for measurement of the FFR via right atrial pacing and the raw data are included in
Figure 1B. Based on the FFR pattern, we allocated patients into the BiF and MoF groups. The number of patients exhibiting a MoF pattern was 86 (76.1%), and 27 exhibited a BiF pattern (23.9%) (Table 1). There were no differences between the groups in their baseline clinical characteristics, with the exception of the ratio of HOCM and B-type natriuretic peptide (BNP) level (Table 1).16
Regarding the comprehensive RFs for SCD, non-sustained ventricular tachycardia was observed in 16 patients (14.2%); unexplained syncope was observed in 3 patients (2.7%); 5 patients had a family history of SCD (4.4%); and LV wall thickness >30 mm was observed in 1 patient and HOCM was observed in 14 patients (Table 1). No patients exhibited an abnormal systolic blood pressure response when using a treadmill. Left atrial diameter, a RF for SCD, was within the normal range, and no differences between MoF and BiF were observed (Table 1). Notably, 28 patients (24.8%) were diagnosed with APH. The baseline data for the patients with APH and their counterparts are included in
Table S1. The incidence of APH with BiF was similar to that with MoF (Table 1).
Table 1.
Baseline Clinical Characteristics of the Study Patients With Hypertrophic Cardiomyopathy
| |
Total
(n=113) |
MoF group
(n=86) |
BiF group
(n=27) |
P value |
| Age, years |
56.4±11.9 |
56.0±11.4 |
59.3±10.5 |
0.187 |
| Female, n (%) |
24 (21.2) |
17 (19.8) |
7 (25.9) |
0.495 |
| BMI, kg/m2 |
24.0±4.1 |
24.0±3.5 |
24.8±4.1 |
0.334 |
| NYHA functional class I/II |
92/21 |
71/15 |
21/6 |
0.577 |
| Apical hypertrophy, n (%) |
28 (24.8) |
22 (25.6) |
6 (22.2) |
0.724 |
| Medications |
| β-blockers, n (%) |
29 (25.7) |
20 (23.3) |
9 (33.3) |
0.296 |
| (Carvedilol equivalents, mg/day) |
12.5 (8.13–25.0) |
12.5 (6.25–25.0) |
12.5 (10.0–12.5) |
0.443 |
| ACEI, n (%) |
14 (12.4) |
11 (12.8) |
3 (11.1) |
0.559 |
| ARB, n (%) |
39 (34.5) |
32 (37.2) |
7 (25.9) |
0.282 |
| Diuretics, n (%) |
13 (11.5) |
10 (11.6) |
3 (11.1) |
0.624 |
| Aldosterone antagonist, n (%) |
2 (1.8) |
1 (1.2) |
1 (3.7) |
0.422 |
| Amiodarone, n (%) |
1 (0.9) |
1 (1.2) |
0 (0.0) |
0.761 |
| Known risk factors for SCD, n (%) |
| Non-sustained VT |
16 (14.2) |
11 (12.8) |
5 (18.5) |
0.323 |
| Unexplained syncope |
3 (2.7) |
1 (1.2) |
2 (7.4) |
0.141 |
| Family history for SCD |
5 (4.4) |
3 (3.5) |
2 (7.4) |
0.343 |
| LV wall thickness >30 mm |
1 (0.9) |
1 (1.2) |
0 (0) |
0.761 |
| Abnormal SBP response |
0 (0) |
0 (0) |
0 (0) |
NA |
| HOCM |
14 (12.4) |
7 (8.1) |
7 (25.9) |
0.022 |
| Laboratory measurements |
| eGFR, mL/min/1.73 m2 |
72.2±17.0 |
72.8±15.5 |
72.7±18.5 |
0.978 |
| Plasma BNP, pg/mL |
56.4 (32.0–166.7) |
47.9 (21.6–156.5) |
124.0 (54.0–300.0) |
0.026 |
| Echocardiography |
| Heart rate, beats/min |
65.8±12.6 |
65.8±11.6 |
63.6±12.1 |
0.386 |
| LA diameter, mm |
37.5±7.1 |
37.6±5.0 |
38.5±10.2 |
0.655 |
| LVWT, mm |
17.1±4.0 |
17.4±4.0 |
16.9±3.0 |
0.559 |
| LVMI, g/m2 |
156.6±47.2 |
154.3±45.9 |
167.7±47.2 |
0.212 |
| E/A ratio |
1.0±0.5 |
1.0±0.5 |
1.1±0.5 |
0.549 |
| E/Ea ratio |
14.8±8.6 |
14.6±8.7 |
15.6±8.9 |
0.719 |
| Dct, ms |
229.3±63.0 |
224.7±54.9 |
247.8±71.3 |
0.136 |
| Cardiac catheterization |
| LVEF, % |
71.4±12.2 |
71.7±10.7 |
72.8±11.6 |
0.653 |
| LVEDVI, mL/m2 |
68.8±19.0 |
67.6±17.9 |
74.3±20.0 |
0.102 |
| LVESVI, mL/m2 |
20.2±10.9 |
19.6±9.9 |
22.2±13.8 |
0.295 |
| LVEDP, mmHg |
16.0±7.2 |
15.7±7.3 |
17.5±6.8 |
0.255 |
| CI, L/min/m2 |
3.0±0.6 |
3.0±0.6 |
2.9±0.7 |
0.420 |
| PAWP, mmHg |
11.7±5.2 |
11.4±5.0 |
13.0±5.8 |
0.151 |
| LVdP/dtmax at baseline, mmHg/s |
1,680.2±394.1 |
1,710.4±351.9 |
1,632.0±453.2 |
0.350 |
Data are mean±SD or median (interquartile range). ACEI, angiotensin-converting enzyme inhibitor; ARB, angiotensin II receptor blocker; BiF, biphasic force-frequency pattern; BMI, body mass index; BNP, B-type natriuretic peptide; CI, cardiac index; Dct, deceleration time; E/A ratio, ratio of early transmitral flow velocity to atrial flow velocity; E/Ea ratio, ratio of early transmitral flow velocity to early diastolic mitral annular velocity; eGFR, estimated glomerular filtration rate; HOCM, hypertrophic obstructive cardiomyopathy; LA, left atrial; LV, left ventricular; LV dP/dtmax, maximal first derivative of left ventricular pressure; LVEDP, left ventricular end-diastolic pressure; LVEDVI, left ventricular end-diastolic volume index; LVESVI, left ventricular end-systolic volume index; LVEF, left ventricular ejection fraction; LVMI, left ventricular mass index; LVWT, left ventricular wall thickness; MoF, monophasic force-frequency pattern; NA, not applicable; NYHA, New York Heart Association; PAWP, pulmonary arterial wedge pressure; SBP, systolic blood pressure; SCD, sudden cardiac death; VT, ventricular tachycardia.
We compared the incidence of cardiac events between the BiF and MoF groups over a mean follow-up period of 4.7±2.8 years: 12 patients (10.6%) experienced cardiac events [SCD (n=3, 2.7%), worsening heart failure (n=4, 3.5%), and lethal arrhythmias (n=5, 4.4%)] (Table 2). The cardiac event-free survival rate was significantly lower in the BiF group compared with the MoF group (P<0.001,
Figure 2A). We subsequently divided our study population based on the RFs for SCD in the setting of HCM, as defined by the recent guidelines,5
and compared the incidence of cardiac events among them: 80 patients (70.8%) had no RF for SCD; 28 patients (24.8%) had 1 RF (NSVT: n=12, presyncope: n=1, family history: n=4, LV wall thickness >30 mm: n=1, HOCM=10), 4 patient had 2 RFs and 1 patient had 3 RFs.
Table 2.
Cardiac Events in the Study Patients With Hypertrophic Cardiomyopathy During Follow-up
| |
MoF group
(n=86) |
BiF group
(n=27) |
| SCD, n (%) |
1 (1.2) |
2 (7.4) |
| HF, n (%) |
0 (0) |
4 (14.8) |
| ICD, n (%) |
2 (2.3) |
3 (11.1) |
HF, admission for worsening heart failure; ICD, automated implantable cardioverter defibrillator implantation for lethal arrhythmia. Other abbreviations as in Table 1.
The Kaplan-Meier survival curves of the patients with RFs [RF (+) group] demonstrated a tendency to a high number of cardiac events in comparison with patients with no RFs [RF (−) group] (P=0.065,
Figure 2B). But this classical risk stratification did not reveal significant differences in the incidence of cardiac events in our patient population.
APH is indicative of a better prognosis in the setting of HCM,17
and we observed APH in several patients (24.8%,
Table 1); therefore, we compared the prognoses of the patients with APH with those of their counterparts with respect to the incidence of cardiac events (Figure 2C). There was no difference in the incidence of cardiac events between the APH (+) and the APH (−) groups (P=0.335). HOCM is a RF for SCD in the setting of HCM.18
We next compared the incidence of cardiac events with respect to LVOT obstruction in the study population. LVOT obstruction was observed in 14 patients (7 with MoF, 7 with BiF). The cardiac event-free survival rate was significantly lower in the HOCM group compared with the counterparts (P=0.003) (Figure 2D).
We subsequently stratified the RFs for composite cardiac events with respect to patient characteristics and hemodynamic variables using a Cox proportional hazards analysis (Table 3). Age, pulmonary artery wedge pressure, LVEDVI, and BiF pattern were found to be predictors of cardiac events based on the results of a univariate analysis. In the multivariate analysis, LVEDVI (hazard ratio, 1.051; P=0.014) and BiF pattern (hazard ratio, 15.260; P=0.001) were the independent predictors of cardiac events.
Table 3.
Multivariate Cox Regression Analysis for the Composite Endpoint
| Variable |
Univariate analysis |
Multivariate analysis* |
| HR (95% confidence interval) |
P value |
HR (95% confidence interval) |
P value |
| Age |
1.067 (1.005–1.132) |
0.033 |
1.015 (0.952–1.082) |
0.648 |
| Female |
1.557 (0.411–5.902) |
0.515 |
– |
– |
| BMI |
0.942 (0.807–1.099) |
0.446 |
– |
– |
| BNP† |
1.006 (0.992–1.019) |
0.419 |
– |
– |
| PAWP |
1.123 (1.024–1.231) |
0.014 |
1.049 (0.954–1.154) |
0.319 |
| LVEDP |
1.068 (0.987–1.155) |
0.101 |
– |
– |
| LVEDVI |
1.050 (1.016–1.085) |
0.004 |
1.051 (1.010–1.093) |
0.014 |
| LVESVI |
1.037 (0.992–1.085) |
0.109 |
– |
– |
| LVMI |
1.010 (0.999–1.021) |
0.079 |
– |
– |
| BiF |
12.211 (3.296–45.240) |
<0.001 |
15.260 (2.977–78.220) |
0.001 |
*The final model included all univariate predictors. †per 10-pg/mL increments. HR, hazard ratio. Other abbreviations as in Table 1.
We next determined whether there were any differences in cardiac remodeling in the myocardial samples from the BiF and MoF groups.19,20
We measured the degree of cardiac fibrosis using Sirius red staining (Figure 3A,B), as well as measuring the size of the cardiomyocytes (CSA,
Figure 3C) in each myocardial biopsy specimen. The representative CVF findings for the patients with MoF (CVF: 0.8%) and BiF (CVF: 1.6%) are included in
Figure 3A. As summarized in
Figure 3B, there were no differences between the BiF and MoF groups [median 1.32 (0.82–1.80) % for BiF (n=15) and median 1.23 (0.93–1.61) % for MoF (n=39), respectively] (P=0.961). Regarding CSA, we observed no differences between the BiF and MoF groups based on H&E staining [median 436.8 (348.7–492.1)/μm2
for BiF (n=15) and median 398.0 (314.3–477.5)/μm2
for MoF (n=35)] (P=0.415), which was consistent with the trends observed via echocardiography with respect to LV wall thickness (Table 1).

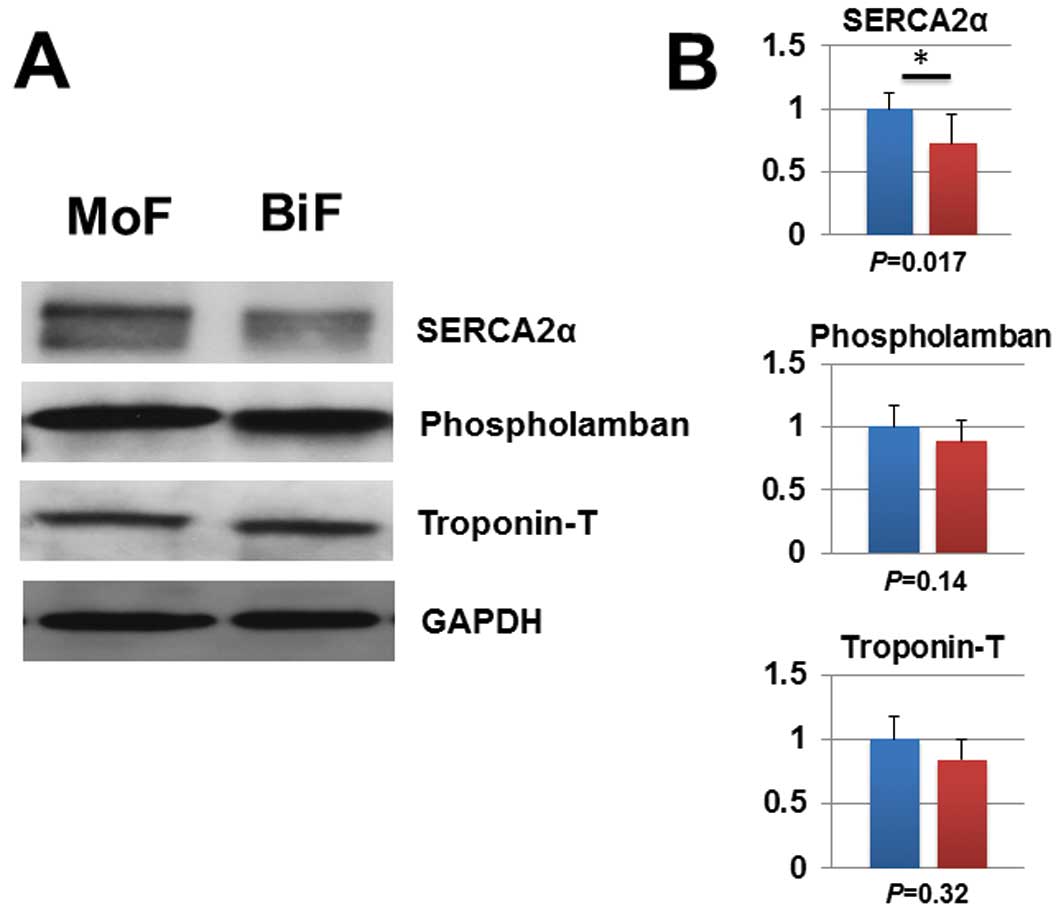
Because we observed no significant differences in cardiac remodeling on histology (Figure 3), we next sought to determine whether there were latent changes in myocardial regulatory molecules in the setting of a BiF pattern (Figure 4). We previously reported that a BiF pattern reflects downregulation of myocardial SERCA2 mRNA levels in patients with HCM.12,13
We therefore analyzed the protein expression levels of the myocardial regulatory molecules associated with contractility (SERCA2α, phospholamban, troponin-T) (Figure 4A,B). The protein levels of SERCA2α were significantly lower in the BiF group compared with the MoF group. The level of phospholamban, a SERCA2α regulator, was unchanged.
Discussion
The primary finding of the present study was that an abnormal FFR (with a BiF pattern) predicts cardiac events in the setting of HCM, even among patients at an asymptomatic stage of the disease. Few markers have been shown to predict primary cardiac events in patients with asymptomatic HCM; however, we determined that the FFR reflects latent myocardial abnormalities undetectable by histological and functional tests. Actually, 71% of the SCD patients have been reported as asymptomatic or mildly symptomatic.21
In addition, 3% of patients without RFs (annual rate 0.45%) and 4.8% of patients with only one RF (annual rate 0.65%) experience cardiac events.8
In the present study, we observed that classical risk stratification did not reveal significant differences in the incidence of cardiac events in this particular patient population (Figure 2B). Therefore, it may be beneficial to identify a variable that allows for more sensitive stratification of the latent risk of HCM.
To date, a variety of SCD RFs have been suggested, including APH and HOCM.18,22
APH is more common among Asians, and Kitaoka et al reported that the prevalence of apical HCM in Japan was 5-fold higher (15%) than that noted in the USA (3%).23
The prognosis of APH is considered to be benign compared with other types of HCM. In the present study, the prevalence of APH was high [24.8% (28 patients)], but its prognosis was similar to that of non-APH patients (Figure 2C). HOCM is also a RF for SCD5,6
and the present study’s results confirmed that the HOCM group experienced a higher incidence of cardiac events compared with others (Figure 2D).
We also examined whether changes in FFR may be indicative of molecular changes causing latent functional impairment characterized by a BiF pattern, as there were no visible differences in cardiac remodeling based on either histologic results (Figure 3) or the physiological performance of cardiomyocytes (Table 1). We observed that myocardial SERCA2α protein expression levels were significantly reduced in the BiF group (Figure 4), which was somewhat consistent with the results of our previous study.12,13
SERCA2α, in particular, has received considerable attention as a therapeutic target for heart failure,24
because SERCA2α gene therapy appears to improve ventricular contractility and reduce the incidence of lethal arrhythmias in animal models.25,26
Furthermore, several clinical trials are investigating the potential benefit of SERCA2α gene therapy for systolic heart failure.27,28
Recently, the largest gene transfer study, known as the CUPID2 phase 2b trial, reported that a single intracoronary infusion of AAV1/SERCA2a did not improve the clinical course of advanced heart failure patients.29
However, the subject disease in CUPID2 was dilated cardiomyopathy and 80% of the patients were classified as NYHA III or IV. Therefore, the efficacy for early-phase HCM patients remains unclear. In the case of asymptomatic HCM characterized by a BiF pattern, any therapeutic interventions for SERCA2α may attenuate the latent impairments in LV contractility, thereby reducing the risk of subsequent cardiac events.
Study Limitations
First, this study was retrospective with a small number of patients at a single center. Second, although Shah et al reported that latent LVOT obstruction may occur in the setting of symptomatic non-obstructive HCM,30
the number of patients with latent obstruction and the influence of said obstruction on their prognosis were not evaluated. Third, FFR patterns were assessed by an invasive method. However, in our study, the cumulative survival curves for cardiac events showed that FFR patterns could stratify HCM patients more clearly than existing RFs. Further study is needed to establish a non- or less-invasive method of evaluating the FFR pattern. Lastly, patients with atrial fibrillation were excluded and this condition has been reported as a RF for worsening heart failure and SCD among patients with HCM.31
Because right atrial pacing via cardiac catheterization is necessary to analyze the FFR, our study was forced to exclude patients with HCM with atrial fibrillation because it is refractory to pacing.
Conclusions
In conclusion, our study demonstrated the diagnostic significance of a BiF pattern as a predictor of future cardiac events among asymptomatic HCM patients with latent myocardial molecular impairment.
Acknowledgments
We thank Akihiro Hirakawa (Center for Advanced Medicine and Clinical Research) at the Nagoya University Graduate School of Medicine for technical assistance.
Disclosures
R.M. belongs to a development endowed by Chugai, Dainippon Sumitomo, Kowa, Kyowa Hakko Kirin, MSD, Nihon Medi-physics, and Nippon Boehringer Ingelheim.
Funding
This project was supported in part by Grant-in-Aid for Scientific Research [No. 25860594 (to T.O.)] from the Ministry of Education, Culture, Sports, Science, and Technology in Japan.
Supplementary Files
Supplementary File 1
Table S1.
Baseline clinical characteristics of study patients with apical hypertrophic cardiomyopathy
Please find supplementary file(s);
http://dx.doi.org/10.1253/circj.CJ-16-1007
References
- 1.
Maron BJ. Hypertrophic cardiomyopathy: A systematic review. JAMA 2002; 287: 1308–1320.
- 2.
Elliott PM, Poloniecki J, Dickie S, Sharma S, Monserrat L, Varnava A, et al. Sudden death in hypertrophic cardiomyopathy: Identification of high risk patients. J Am Coll Cardiol 2000; 36: 2212–2218.
- 3.
Maron BJ, Maron MS. Hypertrophic cardiomyopathy. Lancet 2013; 381: 242–255.
- 4.
Gersh BJ, Maron BJ, Bonow RO, Dearani JA, Fifer MA, Link MS, et al. 2011 ACCF/AHA Guideline for the Diagnosis and Treatment of Hypertrophic Cardiomyopathy: A report of the American College of Cardiology Foundation/American Heart Association Task Force on Practice Guidelines. Developed in collaboration with the American Association for Thoracic Surgery, American Society of Echocardiography, American Society of Nuclear Cardiology, Heart Failure Society of America, Heart Rhythm Society, Society for Cardiovascular Angiography and Interventions, and Society of Thoracic Surgeons. J Am Coll Cardiol 2011; 58: e212–e260.
- 5.
Elliott PM, Anastasakis A, Borger MA, Borggrefe M, Cecchi F, Charron P, et al. 2014 ESC Guidelines on diagnosis and management of hypertrophic cardiomyopathy: The Task Force for the Diagnosis and Management of Hypertrophic Cardiomyopathy of the European Society of Cardiology (ESC). Eur Heart J 2014; 35: 2733–2779.
- 6.
O’Mahony C, Jichi F, Pavlou M, Monserrat L, Anastasakis A, Rapezzi C, et al. A novel clinical risk prediction model for sudden cardiac death in hypertrophic cardiomyopathy (HCM risk-SCD). Eur Heart J 2014; 35: 2010–2020.
- 7.
Song JK. Role of noninvasive imaging modalities to better understand the mechanism of left ventricular outflow tract obstruction and tailored lesion-specific treatment options. Circ J 2014; 78: 1808–1815.
- 8.
O’Mahony C, Tome-Esteban M, Lambiase PD, Pantazis A, Dickie S, McKenna WJ, et al. A validation study of the 2003 American College of Cardiology/European Society of Cardiology and 2011 American College of Cardiology Foundation/American Heart Association risk stratification and treatment algorithms for sudden cardiac death in patients with hypertrophic cardiomyopathy. Heart 2013; 99: 534–541.
- 9.
Spirito P, Autore C, Formisano F, Assenza GE, Biagini E, Haas TS, et al. Risk of sudden death and outcome in patients with hypertrophic cardiomyopathy with benign presentation and without risk factors. Am J Cardiol 2014; 113: 1550–1555.
- 10.
Maron BJ, Rowin EJ, Casey SA, Link MS, Lesser JR, Chan RH, et al. Hypertrophic cardiomyopathy in adulthood associated with low cardiovascular mortality with contemporary management strategies. J Am Coll Cardiol 2015; 65: 1915–1928.
- 11.
Dale AS. The staircase phenomenon in ventricular muscle. J Physiol 1932; 75: 1–16.
- 12.
Somura F, Izawa H, Iwase M, Takeichi Y, Ishiki R, Nishizawa T, et al. Reduced myocardial sarcoplasmic reticulum Ca(2+)-ATPase mRNA expression and biphasic force-frequency relations in patients with hypertrophic cardiomyopathy. Circulation 2001; 104: 658–663.
- 13.
Unno K, Isobe S, Izawa H, Cheng XW, Kobayashi M, Hirashiki A, et al. Relation of functional and morphological changes in mitochondria to myocardial contractile and relaxation reserves in asymptomatic to mildly symptomatic patients with hypertrophic cardiomyopathy. Eur Heart J 2009; 30: 1853–1862.
- 14.
Nagueh SF, Bierig SM, Budoff MJ, Desai M, Dilsizian V, Eidem B, et al. American Society of Echocardiography clinical recommendations for multimodality cardiovascular imaging of patients with hypertrophic cardiomyopathy: Endorsed by the American Society of Nuclear Cardiology, Society for Cardiovascular Magnetic Resonance, and Society of Cardiovascular Computed Tomography. J Am Soc Echocardiogr 2011; 24: 473–498.
- 15.
Düngen HD, Apostolović S, Inkrot S, Tahirović E, Krackhardt F, Pavlović M, et al. Bisoprolol vs. carvedilol in elderly patients with heart failure: Rationale and design of the CIBIS-ELD trial. Clin Res Cardiol 2008; 97: 578–586.
- 16.
Geske JB, McKie PM, Ommen SR, Sorajja P. B-type natriuretic peptide and survival in hypertrophic cardiomyopathy. J Am Coll Cardiol 2013; 61: 2456–2460.
- 17.
Nasermoaddeli A, Miura K, Matsumori A, Soyama Y, Morikawa Y, Kitabatake A, et al. Prognosis and prognostic factors in patients with hypertrophic cardiomyopathy in Japan: Results from a nationwide study. Heart 2007; 93: 711–715.
- 18.
Autore C, Bernabò P, Barillà CS, Bruzzi P, Spirito P. The prognostic importance of left ventricular outflow obstruction in hypertrophic cardiomyopathy varies in relation to the severity of symptoms. J Am Coll Cardiol 2005; 45: 1076–1080.
- 19.
Moravsky G, Ofek E, Rakowski H, Butany J, Williams L, Ralph-Edwards A, et al. Myocardial fibrosis in hypertrophic cardiomyopathy: Accurate reflection of histopathological findings by CMR. JACC Cardiovasc Imaging 2013; 6: 587–596.
- 20.
Wada Y, Aiba T, Matsuyama TA, Nakajima I, Ishibashi K, Miyamoto K, et al. Clinical and pathological impact of tissue fibrosis on lethal arrhythmic events in hypertrophic cardiomyopathy patients with impaired systolic function. Circ J 2015; 79: 1733–1741.
- 21.
Maron BJ, Olivotto I, Spirito P, Casey SA, Bellone P, Gohman TE, et al. Epidemiology of hypertrophic cardiomyopathy-related death: Revisited in a large non-referral-based patient population. Circulation 2000; 102: 858–864.
- 22.
Klarich KW, Attenhofer Jost CH, Binder J, Connolly HM, Scott CG, Freeman WK, et al. Risk of death in long-term follow-up of patients with apical hypertrophic cardiomyopathy. Am J Cardiol 2013; 111: 1784–1791.
- 23.
Kitaoka H, Doi Y, Casey SA, Hitomi N, Furuno T, Maron BJ. Comparison of prevalence of apical hypertrophic cardiomyopathy in Japan and the United States. Am J Cardiol 2003; 92: 1183–1186.
- 24.
Shareef MA, Anwer LA, Poizat C. Cardiac SERCA2A/B: Therapeutic targets for heart failure. Eur J Pharmacol 2014; 724: 1–8.
- 25.
Mariani JA, Smolic A, Preovolos A, Byrne MJ, Power JM, Kaye DM. Augmentation of left ventricular mechanics by recirculation-mediated AAV2/1-SERCA2a gene delivery in experimental heart failure. Eur J Heart Fail 2011; 13: 247–253.
- 26.
Lyon AR, Bannister ML, Collins T, Pearce E, Sepehripour AH, Dubb SS, et al. SERCA2a gene transfer decreases sarcoplasmic reticulum calcium leak and reduces ventricular arrhythmias in a model of chronic heart failure. Circ Arrhythm Electrophysiol 2011; 4: 362–372.
- 27.
Jessup M, Greenberg B, Mancini D, Cappola T, Pauly DF, Jaski B, et al. Calcium Upregulation by Percutaneous Administration of Gene Therapy in Cardiac Disease (CUPID): A phase 2 trial of intracoronary gene therapy of sarcoplasmic reticulum Ca2+-ATPase in patients with advanced heart failure. Circulation 2011; 124: 304–313.
- 28.
Zsebo K, Yaroshinsky A, Rudy JJ, Wagner K, Greenberg B, Jessup M, et al. Long-term effects of AAV1/SERCA2a gene transfer in patients with severe heart failure: Analysis of recurrent cardiovascular events and mortality. Circ Res 2014; 114: 101–108.
- 29.
Greenberg B, Butler J, Felker GM, Ponikowski P, Voors AA, Desai AS, et al. Calcium Upregulation by Percutaneous administration of gene therapy In patients with cardiac Disease (CUPID 2): A randomised, multinational, double-blind, placebo-controlled, phase 2b trial. Lancet 2016; 387: 1178–1186.
- 30.
Shah JS, Esteban MT, Thaman R, Sharma R, Mist B, Pantazis A, et al. Prevalence of exercise-induced left ventricular outflow tract obstruction in symptomatic patients with non-obstructive hypertrophic cardiomyopathy. Heart 2008; 94: 1288–1294.
- 31.
Melacini P, Basso C, Angelini A, Calore C, Bobbo F, Tokajuk B, et al. Clinicopathological profiles of progressive heart failure in hypertrophic cardiomyopathy. Eur Heart J 2010; 31: 2111–2123.