Abstract
Background:
The current status and outcomes of direct oral anticoagulant (DOAC) use have not been widely evaluated in unselected patients with atrial fibrillation (AF) in the real world.
Methods and Results:
The Fushimi AF Registry is a community-based prospective survey of AF patients who visited the participating medical institutions (n=80) in Fushimi, Kyoto, Japan. Follow-up data with oral anticoagulant (OAC) status were available for 3,731 patients by the end of November 2015. We evaluated OAC status and clinical outcomes according to OAC status. The number (incidence rate) of stroke/systemic embolism (SE) and major bleeding events during the median follow-up of 3.0 years was 224 (2.3%/year) and 177 (1.8%/year), respectively. After the release of DOAC, the prevalence of DOAC use increased gradually and steadily, and that of warfarin, DOAC and no OAC was 37%, 26% and 36%, respectively in 2015. On Cox proportional hazards modeling incorporating change in OAC status as a time-dependent covariate for stroke/SE and major bleeding events, use of DOAC compared with warfarin was not associated with stroke/SE events (HR, 0.95; 95% CI: 0.59–1.51, P=0.82) or major bleeding events (HR, 0.82; 95% CI: 0.50–1.36, P=0.45).
Conclusions:
In real-world clinical practice, there were no significant differences in stroke/SE events or major bleeding events for DOAC compared with warfarin in patients with AF.
Oral anticoagulants (OAC) are essential for stroke prevention in patients with atrial fibrillation (AF). The use of conventional OAC, such as a vitamin K antagonist (VKA), reduces stroke by 64%, compared with non-VKA users.1
Until recently, VKA were the only available OAC but direct oral anticoagulants (DOAC; dabigatran, rivaroxaban, apixaban, and edoxaban) have been introduced for stroke prevention in patients with AF. Recent large-scale randomized clinical trials (RCT) demonstrated the similar efficacy and safety of DOAC, compared with VKA.2–5
In addition, DOAC have predictable pharmacokinetics without the need for routine monitoring, unlike for VKA, and a low likelihood of food and drug interactions.
Due to the RCT results and ease of use in daily clinical practice, DOAC have prevailed all over the world. After the release of DOAC, several national guidelines for the management of AF were updated, and now recommend DOAC as broadly preferable to VKA in the vast majority of patients with non-valvular AF.6
RCT, however, are conducted under idealized and rigorously controlled conditions. Thus, RCT patients are highly selected, and hence are not broadly representative of real-world patients. Also, not many studies have investigated the real-world effectiveness and safety of DOAC in unselected patients; and, according to studies involving general practice settings, the outcomes of DOAC in real-world clinical practice do not necessarily coincide with the RCT outcomes.7,8
The aim of this study was therefore to evaluate the change in OAC status over time and the clinical outcomes of DOAC compared with warfarin in a large-scale observational prospective all-comer cohort study of AF in Japan.
Methods
Subjects
The Fushimi AF Registry is a community-based prospective survey of AF patients who visited the participating medical institutions in Fushimi, Kyoto, Japan, a densely populated urban area with a total population of 283,000. The study design and patient enrollment of the Fushimi AF Registry have been previously described.9,10
The inclusion criterion for the registry was documentation of AF on 12-lead electrocardiogram or Holter monitor at any time. There were no exclusion criteria. A total of 80 institutions participated in the registry, consisting of 2 cardiovascular centers, 10 small- and medium-sized hospitals (<400 beds), and 68 primary care clinics. Patient enrollment was started in March 2011. The aim of all of the participating institutions was to enroll all consecutive patients with AF under regular outpatient care or under admission. The study protocol was approved by the ethics committees of National Hospital Organization Kyoto Medical Center and Ijinkai Takeda General Hospital.
A total of 4,441 patients were enrolled into the Fushimi AF Registry by the end of November 2015. Of 4,182 patients who were enrolled 1 year before, follow-up data (collected every year) were available for 3,749 patients (follow-up rate, 89.6%). We excluded 18 patients without follow-up OAC data, and hence 3,731 patients were included in the current analysis.
Baseline Characteristics and OAC Status
The Fushimi AF Registry data have been previously described in detail.9–12
Clinical data were registered in the Internet Database System (https://edmsweb16.eps.co.jp/edmsweb/002001/FAF/top.html) by the doctors in charge at each institution. Data were automatically checked for missing or contradictory entries and values out of the normal range. Additional editing checks were performed by clinical research coordinators at the general office of the Registry.
CHADS2
score is the sum of points for the following conditions: congestive heart failure, hypertension, age ≥75 years, diabetes mellitus, prior stroke or transient ischemic attack (2 points).13
CHA2DS2-VASc score is a refinement of the CHADS2
score and extends it by including additional common stroke risk factors: age (≥75 years old, 2 points; 65–74 years old, 1 point), vascular disease and female gender.14
HAS-BLED score is the sum of points for the following conditions: hypertension (systolic blood pressure >160 mmHg), abnormal renal function (chronic dialysis or serum creatinine ≥200 mmol/L), abnormal liver function (aspartate aminotransferase or alanine aminotransferase 3-fold the upper limit of normal), stroke history, bleeding history, elderly (age >65 years), anti-platelet drug (APD), and excess alcohol (≥8 units alcohol/week).15
Labile international normalized ratio (INR) data, bilirubin level, and non-steroidal anti-inflammatory drug use were unavailable in the current study.
In the current analysis, APD included aspirin, clopidogrel, ticlopidine, cilostazol, and prasugrel. OAC status was assessed annually and included VKA (warfarin), and 4 currently available DOAC: dabigatran, rivaroxaban, apixaban, and edoxaban. Prothrombin time INR (PT-INR) was measured at the time of enrollment for patients taking warfarin. Japanese guidelines set different target PT-INR ranges for patients taking warfarin: 1.6–2.6 for elderly patients (≥70 years old) and 2.0–3.0 for younger patients (<70 years old).16
DOAC dose selection was evaluated based on the manufacturer labeling recommendations in Japan (standard dose: dabigatran, 300 mg/day; rivaroxaban, 15 mg/day; apixaban, 10 mg/day; edoxaban, 60 mg/day; reduced dose: dabigatran, 220 mg/day; rivaroxaban, 10 mg/day; apixaban, 5 mg/day; edoxaban, 30 mg/day). Compliance with on-label dosing was evaluated by checking whether the dose was adjusted in accordance with current package insert labeling in Japan. Dabigatran does not have definite dose reduction criteria, but reduction is suggested for any one of the following: age ≥70 years, creatinine clearance 30–50 mL/min, history of major bleeding, and use of p-glycoprotein inhibitors (verapamil). Rivaroxaban and apixaban have dose reduction criteria: rivaroxaban should be reduced in the case of creatinine clearance 15–50 mL/min, and apixaban is indicated to be reduced for any 2 of the following: body weight ≤60 kg, age ≥80 years, and serum creatinine ≥1.5 mg/dL.
Endpoints and Definitions
The primary endpoint of the present study was stroke or systemic embolism (SE) events. Stroke was defined as the sudden onset of a focal neurologic deficit in a location consistent with the territory of a major cerebral artery, with confirmation on computed tomography (CT) or magnetic resonance imaging. SE was defined as acute vascular occlusion of an extremity or organ with confirmation on CT or angiography. The secondary endpoint was major bleeding events. Major bleeding was defined as reduction in hemoglobin by ≥2 g/dL, transfusion ≥2 units of blood, or symptomatic bleeding in a critical area or organ, following the International Society on Thrombosis and Hemostasis definition.17
Statistical Analysis
Continuous variables are expressed as mean±SD. Categorical variables are presented as absolute numbers and percentages. Between-group comparison of continuous baseline variables was performed using one-way analysis of variance (ANOVA). Baseline categorical variables were compared using chi-squared test. Kaplan-Meier analysis was used to estimate event-free survival, and log-rank test was used to compare survival between the groups.
In the current analysis, the entire cohort was divided into 3 groups according to OAC status at baseline (warfarin group, DOAC group and no OAC group), and clinical characteristics compared between the groups. Kaplan-Meier analysis for stroke/SE and major bleeding events was then conducted between the warfarin and DOAC groups. To reduce the effect of potential confounding in this observational study, we used propensity score matching to ensure rigorous adjustment for differences in baseline characteristics.18
The covariates entered into the propensity score were all the components of CHA2DS2-VASc score for stroke/SE events, and all the components of HAS-BLED score for major bleeding events. The propensity score-matched pairs were created by matching warfarin and DOAC groups on the basis of the nearest neighbor pair-matching algorithm with a 0.2 caliper width. A matching ratio of 1:1 was used. The incidences of stroke/SE and major bleeding were compared between the warfarin and DOAC groups after matching.
Finally, we examined the effect of DOAC on time to stroke/SE and major bleeding events using the Cox proportional hazards model with time-dependent covariates, compared with the warfarin group. On Kaplan-Meier analysis, OAC status was stratified only at baseline, not taking the change in OAC status into consideration. In the Cox proportional hazards model, however, we used time-dependent covariates to consider the change in OAC status during the follow-up period. Given that OAC status was assessed annually and the exact date of the switch was not collected, we made the assumption that OAC status switched halfway through the period if it was different to the previous year. The results of Cox proportional hazards modeling are given as hazard ratio (HR) and 95% CI with adjustment for baseline comorbidities (adjusted by including all the components of CHA2DS2-VASc score for stroke/SE, and all the components of HAS-BLED score for major bleeding). To examine the robustness of the analysis, we further conducted a sensitivity analysis by repeating the same Cox proportional hazards model 1,000 times under the assumption that OAC status switched randomly in the period, if OAC status had changed from the previous year.
Two-sided P<0.05 was considered significant. All statistical analysis was carried out using JMP version 11.0 (SAS Institute, Cary, NC, USA) or SAS version 9.4 (SAS Institute).
Results
Baseline Characteristics
Baseline characteristics are listed in
Table 1. The subjects reflected real-world clinical practice, including a large proportion of patients with advanced age (73.6±11.0 years), many comorbidities, and high mean CHADS2
score (2.0±1.3). The DOAC group was the youngest (72.0±10.3 years) and the heaviest (62.0±12.7 kg; body mass index, 23.9±3.9 kg/m2). Mean CHADS2
score and HAS-BLED score were the highest in the warfarin group (CHADS2
score, 2.3±1.3; HAS-BLED score, 1.7±0.9, respectively). History of stroke was the highest in the warfarin group (24%). In contrast, history of major bleeding was similar between the groups. Use of APD was the greatest in the no OAC group (34%). Mean PT-INR for the warfarin group was 1.83±0.47.
Table 1.
Baseline Subject Characteristics
| |
Entire cohort
(n=3,731) |
Warfarin
(n=1,728) |
DOAC
(n=270) |
No OAC
(n=1,733) |
P value† |
| Age (years) |
73.6±11.0 |
74.4±9.1 |
72.0±10.3 |
73.1±12.6 |
<0.001 |
| Male |
2,212 (59) |
1,064 (62) |
167 (62) |
981 (57) |
0.008 |
| Body height (cm) |
159.9±10.1 |
160.0±10.0 |
160.4±9.6 |
159.7±10.2 |
0.43 |
| Body weight (kg) |
59.2±13.2 |
59.6±13.3 |
62.0±12.7 |
58.3±13.2 |
<0.001 |
| BMI (kg/m2) |
23.0±4.0 |
23.2±4.0 |
23.9±3.9 |
22.7±3.9 |
<0.001 |
| SBP (mmHg) |
124.7±19.0 |
122.9±18.8 |
126.3±17.7 |
126.2±19.3 |
<0.001 |
| DBP (mmHg) |
70.6±12.8 |
70.0±12.8 |
71.8±12.1 |
71.0±13.0 |
0.02 |
| Heart rate (beats/min) |
78.0±16.1 |
77.0±15.3 |
81.6±19.0 |
78.5±16.3 |
<0.001 |
| Type of AF |
| Chronic |
1,577 (42) |
978 (57) |
89 (33) |
510 (29) |
|
| Persistent |
327 (9) |
144 (8) |
42 (16) |
141 (8) |
<0.001 |
| Paroxysmal |
1,827 (49) |
606 (35) |
139 (51) |
1,082 (62) |
|
| Asymptomatic |
1,958 (52) |
930 (54) |
149 (55) |
879 (51) |
0.12 |
| Comorbidities |
| CHADS2 score |
2.0±1.3 |
2.3±1.3 |
2.0±1.2 |
1.8±1.3 |
<0.001 |
| CHA2DS2-VASc score |
3.4±1.7 |
3.7±1.6 |
3.2±1.5 |
3.1±1.7 |
<0.001 |
| HAS-BLED score |
1.6±0.9 |
1.7±0.9 |
1.5±0.9 |
1.6±1.0 |
0.003 |
| Heart failure |
1,002 (27) |
593 (34) |
68 (25) |
341 (20) |
<0.001 |
| Hypertension |
2,317 (62) |
1,100 (64) |
181 (67) |
1,036 (60) |
0.01 |
| Diabetes mellitus |
855 (23) |
432 (25) |
60 (22) |
363 (21) |
0.02 |
| Dyslipidemia |
1,613 (43) |
760 (44) |
134 (50) |
719 (41) |
0.03 |
| CAD |
556 (15) |
252 (15) |
27 (10) |
277 (16) |
0.03 |
| CKD |
1,317 (35) |
674 (39) |
89 (33) |
554 (32) |
<0.001 |
| Dialysis |
93 (2.5) |
35 (2.0) |
2 (0.7) |
56 (3.2) |
0.01 |
| PAD |
152 (4.1) |
79 (4.6) |
8 (3.0) |
65 (3.8) |
0.29 |
| COPD |
189 (5.1) |
96 (5.6) |
18 (6.7) |
75 (4.3) |
0.12 |
| eGFR (mL/min/m2) |
51.1±20.6 |
48.9±18.6 |
53.3±16.7 |
53.0±22.8 |
<0.001 |
| Hemoglobin (g/dL) |
12.9±2.0 |
13.0±2.0 |
13.4±1.9 |
12.8±2.1 |
<0.001 |
| History of stroke |
682 (18) |
408 (24) |
47 (17) |
227 (13) |
<0.001 |
| History of major bleeding |
146 (3.9) |
64 (3.7) |
9 (3.3) |
73 (4.2) |
0.65 |
| Medication |
| Antiplatelet drugs |
1,082 (29) |
440 (25) |
45 (17) |
597 (34) |
<0.001 |
| Aspirin |
915 (25) |
364 (21) |
30 (11) |
521 (30) |
<0.001 |
| Clopidogrel |
175 (4.7) |
55 (3.2) |
10 (3.7) |
110 (6.4) |
<0.001 |
| Digitalis |
461 (12) |
295 (17) |
9 (3) |
157 (9) |
<0.001 |
| Verapamil |
388 (10) |
232 (13) |
25 (9) |
131 (8) |
<0.001 |
| β-blockers |
1,073 (29) |
635 (37) |
93 (34) |
345 (20) |
<0.001 |
| Anti-arrhythmic drugs |
| Vaughan-Williams classification class I |
681 (18) |
299 (17) |
50 (19) |
332 (19) |
0.37 |
| Amiodarone |
21 (0.6) |
16 (0.9) |
1 (0.4) |
4 (0.2) |
0.02 |
| ACEI |
344 (9) |
198 (11) |
34 (13) |
112 (6) |
<0.001 |
| ARB |
1,346 (36) |
705 (41) |
113 (42) |
528 (30) |
<0.001 |
| Ca antagonist |
1,156 (31) |
545 (32) |
101 (37) |
510 (29) |
0.02 |
| Loop diuretics |
835 (22) |
505 (29) |
50 (19) |
280 (16) |
<0.001 |
Data given as mean±SD or n (%). †ANOVA for continuous variables and chi-squared test for categorical variables. ACEI, angiotensin-converting enzyme inhibitor; AF, atrial fibrillation; ARB, angiotensin II receptor blocker; BMI, body mass index; CAD, coronary artery disease; CKD, chronic kidney disease; COPD, chronic obstructive pulmonary disease; DBP, diastolic blood pressure; DOAC, direct oral anticoagulant; eGFR, estimated glomerular filtration rate; OAC, oral anticoagulant; PAD, peripheral artery disease; SBP, systolic blood pressure.
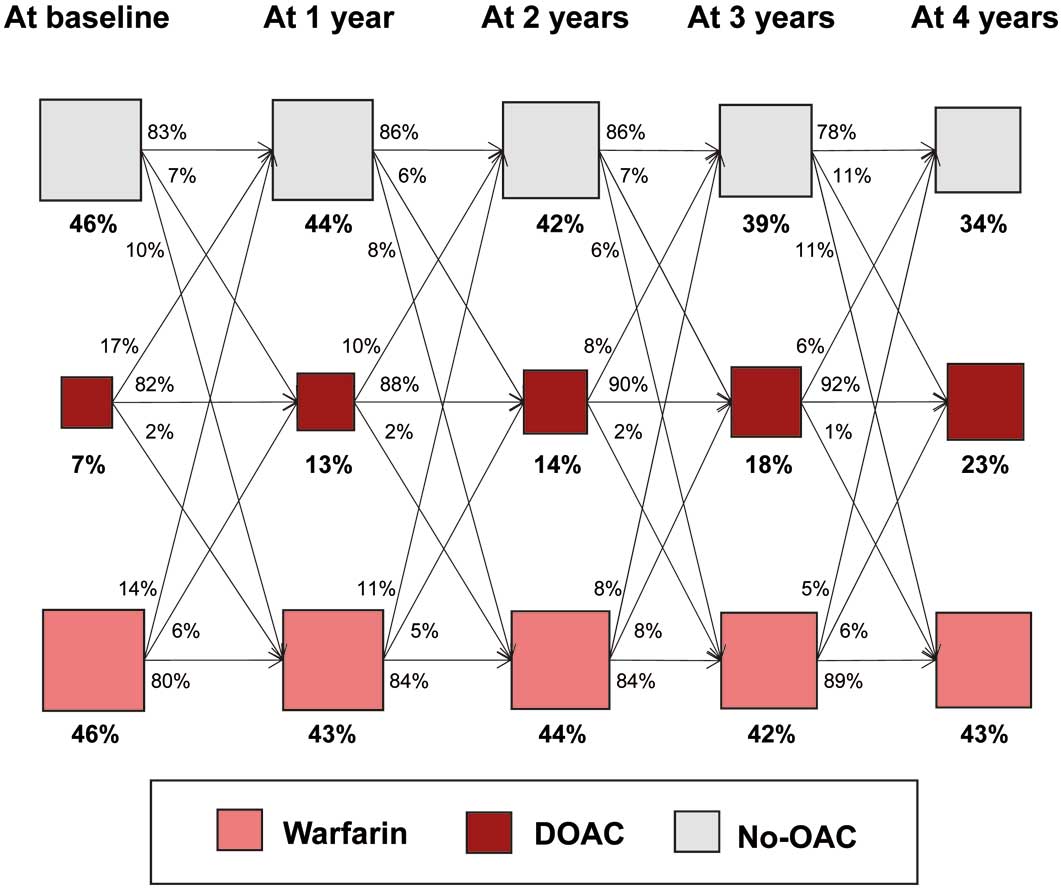
The total prevalence of OAC increased over time: 53% in 2011 and 64% in 2015 (Figure 1A). In 2011, the proportion (number) of patients on warfarin, DOAC and no OAC was 51% (1,345), 2% (52) and 47% (1,220), respectively (Figure 1B). Warfarin was the predominant OAC in 2011. After the release of DOAC in 2011, the prevalence of DOAC increased gradually and steadily from 2011 to 2015. In 2015, the proportion (number) of patients on warfarin, DOAC and no OAC was 38% (775), 26% (545) and 36% (756), respectively. Patients had gone through several transitions of OAC status (warfarin, DOAC, or no OAC), with the net use of DOAC growing yearly (Figure 2).

Figure 3
shows the distribution of OAC status according to CHADS2
score in 2011 and 2015. In 2011, use of OAC (warfarin or DOAC) increased as CHADS2
score increased, but reached a plateau at CHADS2
score ≥3. In 2015, use of OAC increased in all CHADS2
subclasses, but the increase was predominant in low-risk patients, that is, CHADS2
score 0 (from 35% to 49%) and 1 (from 45% to 62%).

Figure 4
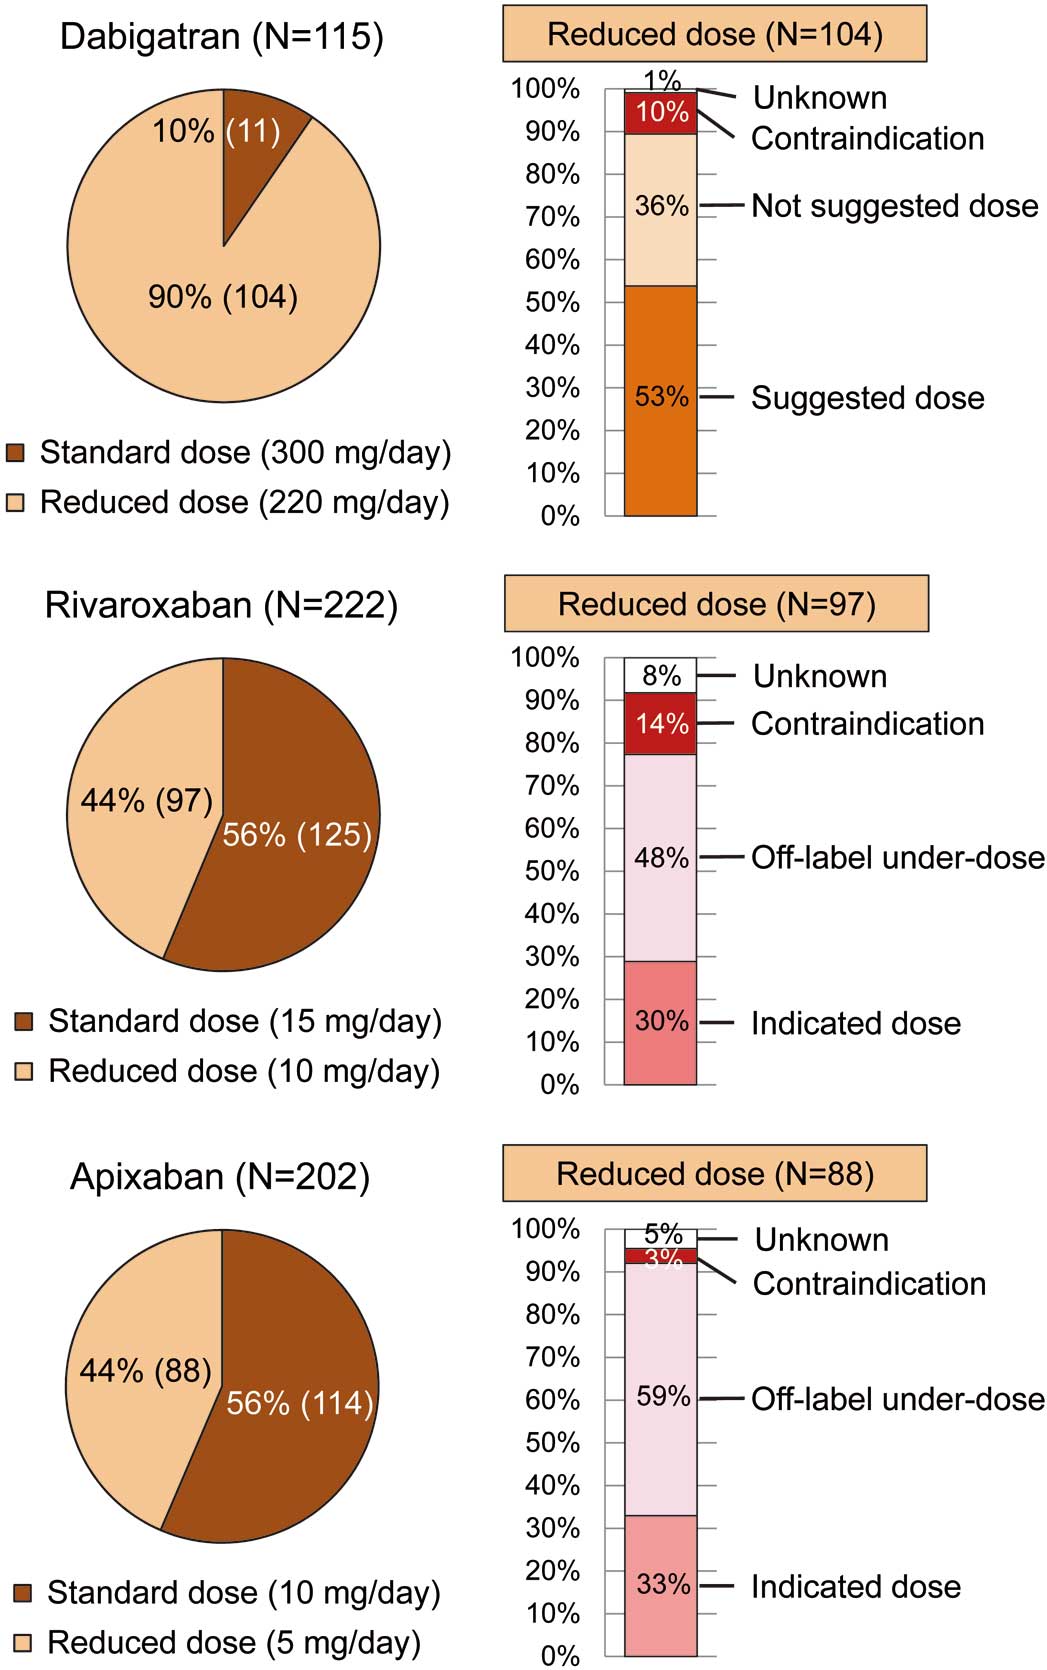
shows DOAC dose selection and compliance rate for on-label dosing and reduced dose in 2015. Among 545 patients who were prescribed DOAC, 104 (90% of) dabigatran users, 97 (44% of) rivaroxaban users, and 88 (44% of) apixaban users were prescribed a reduced dose. In patients with reduced dose, 37 (36% of) dabigatran users were prescribed a not-suggested dose, and 47 (48% of) rivaroxaban users and 52 (59% of) apixaban users were prescribed an off-label under-dose. Also, due to the lack of body weight data some cases were classified as “unknown”. Edoxaban data are not included here because the edoxaban group was small (n=6).
Clinical Outcome of DOAC vs. Warfarin at Baseline
The number (incidence rate) of stroke/SE and major bleeding events in the entire cohort during the follow-up period (median follow-up, 3.0 years) was 224 (2.3%/year) and 177 (1.8%/year), respectively. Kaplan-Meier curves for stroke/SE and major bleeding events according to warfarin and DOAC at baseline are shown in
Figure 5. There was no significant difference in the incidence of stroke/SE events (log-rank, P=0.70) or in the incidence of major bleeding events (log-rank, P=0.34) between the 2 groups.
Propensity score matching for the entire cohort yielded 269 matched patient pairs for stroke/SE and major bleeding events. In the matched cohorts, there was no longer any significant difference between warfarin and DOAC for any covariate (Tables S1,S2). For the 269 propensity score-matched pairs, there was also no significant difference in the incidence of stroke/SE or major bleeding events between the 2 groups (log-rank, P=0.79 and log-rank, P=0.51, respectively;
Figure S1).
Clinical Outcome and Change in OAC Status
Results of Cox proportional hazards modeling incorporating change in OAC status as a time-dependent covariate for stroke/SE events are listed in
Table 2. Use of DOAC was not associated with stroke/SE events, compared with warfarin (HR, 0.95; 95% CI: 0.59–1.51, P=0.82). In contrast, age and history of stroke at baseline were independently associated with stoke/SE events (age per 10 years: HR, 1.51; 95% CI: 1.29–1.76), P<0.001; history of stroke: HR, 1.75; 95% CI: 1.31–2.32, P<0.001).
Table 2.
Indicators of Stroke/SE Events
| Variable |
Hazard ratio
(95% CI) |
P value |
| Baseline characteristics |
| CHF |
1.19 (0.89–1.59) |
0.25 |
| Hypertension |
1.15 (0.87–1.53) |
0.33 |
| Age (per 10 years) |
1.51 (1.29–1.76) |
<0.001 |
| Diabetes mellitus |
1.14 (0.84–1.53) |
0.40 |
| History of stroke |
1.75 (1.31–2.32) |
<0.001 |
| Vascular disease |
1.08 (0.72–1.63) |
0.71 |
| Female sex |
0.85 (0.64–1.13) |
0.26 |
| OAC status (time-dependent covariates) |
| DOAC (vs. warfarin) |
0.95 (0.59–1.51) |
0.82 |
Vascular disease included old myocardial infarction and PAD. CHF, congestive heart failure; SE, systemic embolism. Other abbreviations as in Table 1.
Results of Cox proportional hazards modeling incorporating change in OAC status as a time-dependent covariate for major bleeding events are listed in
Table 3. Use of DOAC was not associated with major bleeding events, compared with warfarin (HR, 0.82; 95% CI: 0.50–1.36, P=0.45). Abnormal renal function, history of major bleeding, age and APD use at baseline were independently associated with major bleeding events (abnormal renal function: HR, 2.87; 95% CI: 1.67–4.95, P<0.001; history of major bleeding: HR, 3.46; 95% CI: 2.04–5.85, P<0.001; age per 10 years: HR, 1.31; 95% CI: 1.11–1.55, P=0.001; APD use: HR, 1.40; 95% CI: 1.03–1.91, P=0.03).
Table 3.
Indicators of Major Bleeding
| Variable |
Hazard ratio
(95% CI) |
P value |
| Baseline characteristics |
| Hypertension† |
1.51 (0.77–2.97) |
0.23 |
| Abnormal renal function‡ |
2.87 (1.67–4.95) |
<0.001 |
| History of stroke |
0.88 (0.60–1.30) |
0.53 |
| History of major bleeding |
3.46 (2.04–5.85) |
<0.001 |
| Age (per 10 years) |
1.31 (1.11–1.55) |
0.001 |
| Anti-platelet drug use |
1.40 (1.03–1.91) |
0.03 |
| Excess alcohol§ |
1.22 (0.84–1.77) |
0.31 |
| OAC status (time-dependent covariate) |
| DOAC (vs. warfarin) |
0.82 (0.50–1.36) |
0.45 |
†Uncontrolled hypertension (SBP >160 mmHg). ‡Dialysis or creatinine >2.26 mg/dL. §≥7drinks/week. Abbreviations as in Table 1.
With regard to sensitivity analysis, distribution of HR estimated by repeating the Cox proportional hazards model 1,000 times under the assumption that OAC status switched randomly in the period, is shown in
Figure S2. The estimated HR of DOAC compared with warfarin for the incidence of stroke/SE events was distributed mainly from 0.93 to 0.97, and that for the incidence of major bleeding events was distributed mainly from 0.81 to 0.85.
Discussion
The main finding of the current study is that the prevalence of DOAC increased gradually over time, and use of DOAC was not associated with stroke/SE or major bleeding events, compared with warfarin, on Cox proportional hazards modeling incorporating change in OAC status as a time-dependent covariate.
In the real world, patients had gone through several transitions of OAC status, with the net use of DOAC growing over time. In the era of warfarin, OAC was overused for low-risk patients, and also underused for high-risk patients.9
After the release of DOAC, the total prevalence of OAC increased gradually, but use of OAC increased predominantly in low-risk patients. This suggests that the issues in the era of warfarin have not been overcome and there is still discordance between the guidelines and real-world clinical practice.
The efficacy and safety of DOAC (dabigatran, rivaroxaban, apixaban, and edoxaban) compared with warfarin were shown in such RCT as the RE-LY, ROCKET AF, ARISTOTLE, and ENGAGE AF–TIMI 48 trials, respectively.2–5
Recently, meta-analysis of these RCT reported that DOAC significantly reduced stroke/SE events by 19%, compared with warfarin, mainly driven by a reduction in hemorrhagic stroke, and DOAC were similar to warfarin with regard to major bleeding events.19
Observational studies in general practice settings, however, warned that some DOAC may have a higher risk of gastrointestinal bleeding than warfarin, especially in older patients.20,21
In a recent report from the Danish nationwide database, there was no significant difference between DOAC and warfarin in terms of ischemic stroke, and the risk of major bleeding was significantly lower for apixaban and dabigatran compared with warfarin, therefore, DOAC seem to be safe and effective alternatives to warfarin in a routine care setting.22
Similarly, in the current study, the use of DOAC was not statistically significant different to warfarin with regard to the incidence of stroke/SE, and there was a tendency toward fewer major bleeding events, although this was not statistically significant.
There are several possible reasons for why the present results do not exactly match the results of RCT. First, frequent use of under-dose DOAC may have had some influence on unfavorable clinical outcome. With regard to US cardiologist prescription data, approximately 20% of DOAC prescriptions were for a reduced dose.23
Use of under-dose DOAC is common in real-world clinical practice, and although it may have a more favorable bleeding profile, it may also result in insufficient stroke prevention.19
In the current study, more than half of the DOAC prescriptions were for reduced dose in 2015. Off-label under-dosing of DOAC in the USA is also associated with an increased risk for cardiovascular hospitalization.24
Second, OAC adherence may have some influence on unfavorable clinical outcomes. In primary care practices in Germany, only approximately 50–60% of DOAC users had good adherence.25
In contrast, a US Veterans Affairs cohort had good adherence to dabigatran (72%), but poor adherence to dabigatran was associated with increased adverse outcome.26
In patients with CHA2DS2-VASc score ≥2, poorer adherence was associated with higher stroke risk and a relatively small decrease in bleeding risk.27
OAC adherence is often suboptimal in real-world clinical practice, and may be associated with poor clinical outcome. The half-lives of DOAC are shorter than that of warfarin, and the anticoagulation effects of DOAC decline more rapidly when scheduled doses are not taken. Therefore, the impact of poor adherence on adverse effects may be greater for DOAC than warfarin.
Study Limitations
This study has several limitations. First, this was an observational study with the limitations inherent to observational study design such as selection bias and unmeasured confounders. Therefore, the Cox regression modeling may still be biased and should be interpreted with caution. Second, OAC status was assessed annually in the current study, and we made an assumption regarding change in OAC status. To compensate for the weakness of the statistical analysis, we conducted an additional sensitivity analysis and confirmed that the results did not change. Third, we investigated neither time in therapeutic range in the warfarin group during follow-up nor OAC adherence, and therefore the effects of quality of warfarin control and of OAC adherence on outcome are unknown. Fourth, the number of patients on DOAC was relatively small, and we could not analyze the impact of DOAC on outcome due to insufficient statistical power. Fifth, although frequent use of under-dose DOAC might have some influence on clinical outcome, we could not conduct further analysis due to the small number of DOAC users and follow-up period. Sixth, data on medical therapy prior to events were not readily available, therefore the impact of this on outcome is not known. And seventh, although blood pressure control is an important factor, we did not investigate this.
Conclusions
In real-world clinical practice, use of DOAC was not significantly different to warfarin with regard to stroke/SE events or major bleeding events in patients with AF.
Acknowledgments
We sincerely appreciate the help of all the institutions participating in the registry and the clinical research coordinators (T. Shinagawa, M. Mitamura, M. Fukahori, M. Kimura, M. Fukuyama, C. Kamata).
Disclosures
Y.Y. received lecture fees from Daiichi-Sankyo. M. Akao received lecture fees from Pfizer, Bristol-Myers Squibb, Boehringer Ingelheim, Bayer Healthcare and Daiichi-Sankyo. The other authors declare no conflict of interest.
Grants
The Fushimi AF Registry is supported by research funding from Boehringer Ingelheim, Bayer Healthcare, Pfizer, Bristol-Myers Squibb, Astellas Pharma, AstraZeneca, Daiichi-Sankyo, Novartis Pharma, MSD, Sanofi-Aventis and Takeda Pharmaceutical. The sponsors had no role in the design or conduct of the study; collection, management, analysis, or interpretation of the data; or preparation, review, and approval of the manuscript. This research is partially supported by the Practical Research Project for Life-Style related Diseases including Cardiovascular Diseases and Diabetes Mellitus from Japan Agency for Medical Research and Development, AMED (15656344, 16768811).
Supplementary Files
Supplementary File 1
Appendix S1.
Participating Registry Institutions
Figure S1.
Kaplan-Meier curves for the incidence of stroke/systemic embolism and major bleeding events in the propensity score-matched cohorts according to oral anticoagulant status at baseline.
Figure S2.
Sensitivity analysis; distribution of hazard ratio estimated by repeating the Cox proportional hazards model 1,000 times under the assumption that oral anticoagulant status switched randomly in the period.
Table S1.
Propensity score-matched cohort for stroke/SE events
Table S2.
Propensity score-matched cohort for major bleeding events
Please find supplementary file(s);
http://dx.doi.org/10.1253/circj.CJ-16-1337
References
- 1.
Hart RG, Pearce LA, Aguilar MI. Meta-analysis: Antithrombotic therapy to prevent stroke in patients who have nonvalvular atrial fibrillation. Ann Intern Med 2007; 146: 857–867.
- 2.
Connolly SJ, Ezekowitz MD, Yusuf S, Eikelboom J, Oldgren J, Parekh A, et al. Dabigatran versus warfarin in patients with atrial fibrillation. N Engl J Med 2009; 361: 1139–1151.
- 3.
Patel MR, Mahaffey KW, Garg J, Pan G, Singer DE, Hacke W, et al. Rivaroxaban versus warfarin in nonvalvular atrial fibrillation. N Engl J Med 2011; 365: 883–891.
- 4.
Granger CB, Alexander JH, McMurray JJ, Lopes RD, Hylek EM, Hanna M, et al. Apixaban versus warfarin in patients with atrial fibrillation. N Engl J Med 2011; 365: 981–992.
- 5.
Giugliano RP, Ruff CT, Braunwald E, Murphy SA, Wiviott SD, Halperin JL, et al. Edoxaban versus warfarin in patients with atrial fibrillation. N Engl J Med 2013; 369: 2093–2104.
- 6.
Camm AJ, Lip GY, De Caterina R, Savelieva I, Atar D, Hohnloser SH, et al. 2012 focused update of the ESC guidelines for the management of atrial fibrillation: An update of the 2010 ESC guidelines for the management of atrial fibrillation: Developed with the special contribution of the European Heart Rhythm Association. Eur Heart J 2012; 33: 2719–2747.
- 7.
Hernandez I, Baik SH, Pinera A, Zhang Y. Risk of bleeding with dabigatran in atrial fibrillation. JAMA Intern Med 2015; 175: 18–24.
- 8.
Graham DJ, Reichman ME, Wernecke M, Zhang R, Southworth MR, Levenson M, et al. Cardiovascular, bleeding, and mortality risks in elderly Medicare patients treated with dabigatran or warfarin for nonvalvular atrial fibrillation. Circulation 2015; 131: 157–164.
- 9.
Akao M, Chun YH, Wada H, Esato M, Hashimoto T, Abe M, et al. Current status of clinical background of patients with atrial fibrillation in a community-based survey: The Fushimi AF Registry. J Cardiol 2013; 61: 260–266.
- 10.
Akao M, Chun YH, Esato M, Abe M, Tsuji H, Wada H, et al. Inappropriate use of oral anticoagulants for patients with atrial fibrillation. Circ J 2014; 78: 2166–2172.
- 11.
Yamashita Y, Hamatani Y, Esato M, Chun YH, Tsuji H, Wada H, et al. Clinical characteristics and outcomes in extreme elderly (age >/= 85 years) Japanese patients with atrial fibrillation: The Fushimi AF Registry. Chest 2016; 149: 401–412.
- 12.
Takabayashi K, Hamatani Y, Yamashita Y, Takagi D, Unoki T, Ishii M, et al. Incidence of stroke or systemic embolism in paroxysmal versus sustained atrial fibrillation: The Fushimi Atrial Fibrillation Registry. Stroke 2015; 46: 3354–3361.
- 13.
Gage BF, Waterman AD, Shannon W, Boechler M, Rich MW, Radford MJ. Validation of clinical classification schemes for predicting stroke: Results from the National Registry of Atrial Fibrillation. JAMA 2001; 285: 2864–2870.
- 14.
Lip GY, Nieuwlaat R, Pisters R, Lane DA, Crijns HJ. Refining clinical risk stratification for predicting stroke and thromboembolism in atrial fibrillation using a novel risk factor-based approach: The euro heart survey on atrial fibrillation. Chest 2010; 137: 263–272.
- 15.
Pisters R, Lane DA, Nieuwlaat R, de Vos CB, Crijns HJ, Lip GY. A novel user-friendly score (HAS-BLED) to assess 1-year risk of major bleeding in patients with atrial fibrillation: The Euro Heart Survey. Chest 2010; 138: 1093–1100.
- 16.
JCS Joint Working Group. Guidelines for pharmacotherapy of atrial fibrillation (JCS 2013): Digest version. Circ J 2014; 78: 1997–2021.
- 17.
Schulman S, Kearon C. Definition of major bleeding in clinical investigations of antihemostatic medicinal products in non-surgical patients. J Thromb Haemost 2005; 3: 692–694.
- 18.
Rosenbaum PR, Rubin DB. The central role of the propensity score in observational studies for causal effects. Biometrika 1983; 70: 41–55.
- 19.
Ruff CT, Giugliano RP, Braunwald E, Hoffman EB, Deenadayalu N, Ezekowitz MD, et al. Comparison of the efficacy and safety of new oral anticoagulants with warfarin in patients with atrial fibrillation: A meta-analysis of randomised trials. Lancet 2014; 383: 955–962.
- 20.
Abraham NS, Singh S, Alexander GC, Heien H, Haas LR, Crown W, et al. Comparative risk of gastrointestinal bleeding with dabigatran, rivaroxaban, and warfarin: Population based cohort study. BMJ 2015; 350: h1857.
- 21.
Chang HY, Zhou M, Tang W, Alexander GC, Singh S. Risk of gastrointestinal bleeding associated with oral anticoagulants: Population based retrospective cohort study. BMJ 2015; 350: h1585.
- 22.
Larsen TB, Skjoth F, Nielsen PB, Kjaeldgaard JN, Lip GY. Comparative effectiveness and safety of non-vitamin K antagonist oral anticoagulants and warfarin in patients with atrial fibrillation: Propensity weighted nationwide cohort study. BMJ 2016; 353: i3189.
- 23.
Nguyen E, White CM, Patel MR, Fields LE, Peacock WF, Crivera C, et al. Doses of apixaban and rivaroxaban prescribed in real-world United States cardiology practices compared to registration trials. Curr Med Res Opin 2016; 32: 1277–1279.
- 24.
Steinberg BA, Shrader P, Thomas L, Ansell J, Fonarow GC, Gersh BJ, et al. Off-Label Dosing of Non-Vitamin K Antagonist Oral Anticoagulants and Adverse Outcomes: The ORBIT-AF II Registry. J Am Coll Cardiol 2016; 68: 2597–2604.
- 25.
Beyer-Westendorf J, Ehlken B, Evers T. Real-world persistence and adherence to oral anticoagulation for stroke risk reduction in patients with atrial fibrillation. Europace 2016; 18: 1150–1157.
- 26.
Shore S, Carey EP, Turakhia MP, Jackevicius CA, Cunningham F, Pilote L, et al. Adherence to dabigatran therapy and longitudinal patient outcomes: Insights from the Veterans Health Administration. Am Heart J 2014; 167: 810–817.
- 27.
Yao X, Abraham NS, Alexander GC, Crown W, Montori VM, Sangaralingham LR, et al. Effect of adherence to oral anticoagulants on risk of stroke and major bleeding among patients with atrial fibrillation. J Am Heart Assoc 2016; 5: e003074.