Abstract
Background:
Previously, we developed an image-based modeling system (V-Modeler) to investigate geometric changes in stent grafts (SGs) following their implantation for abdominal aortic aneurysms (AAAs). The aims of the present study were to improve this system for clinical use, to chronologically analyze postoperative morphological changes in SGs, and to demonstrate scenarios of SG migration.
Methods and Results:
Contrast-enhanced computed tomography data from 36 patients who underwent endovascular aneurysm repair (EVAR) for AAAs were used, with 72 centerline paths, in total, analyzed for bilateral SG legs. The existing V-modeler system was modified by introducing a penalty term, optimizing the number of control points using Akaike’s information criterion, and changing the degree of the function from 3 to 5. Geometric parameters were then analyzed immediately, as well as >1 year after EVAR. Eight migrations were found and although overall SG curvature and curvature at the distal (leg) site did not change, curvature at the proximal (trunk) site of SGs decreased over time. Subanalysis revealed that SGs with severe curvature showed the same trend, whereas distal curvature increased in the non-severe curvature group. In addition, proximal curvature decreased more in Excluder than Zenith devices.
Conclusions:
The present study demonstrates SG behavior after implantation with numerical values for SG length and curvature.
Although endovascular aneurysm repair (EVAR) for abdominal aortic aneurysms (AAAs) has spread worldwide due to excellent short-term results,1,2
it has been shown that the initial benefit of this procedure does not persist over the long term.3–5
This has resulted in a higher reintervention rate compared with open surgery that is due mostly to insufficient interaction between the native aorta/artery and stent graft (SG). In particular, because the SG is not attached to the native aorta with any sutures, SG migration remains a possibility.
Early studies on the use of SGs for aneurysm repair were focused on the optimization of proximal fixation, resulting in optimization of the suprarenal stent, hook, and sizing between the SG and native aorta.6–8
This optimization initially seemed to be successful, with SGs having a very low rate of migration in large population studies.1,2,9
In contrast, there have been only a few reports regarding migration of the distal landing zone.10
For example, we reported on an patient after EVAR whose implanted SG had undergone a morphological change and showed upward migration of its distal edge, resulting in an impending rupture.11
We hypothesized that distal migration had occurred in this case due to the elastic restoring force of the SG implanted in the angulated native aorta and because the hookless distal edge of the SG exerted less friction against the native aorta than at the proximal site.
In our previous study,11
we developed an image-based modeling system (V-modeler) to extract vascular geometry and identify geometric parameters such as curvature and torsion. However, the system had some problems: there were outlier values in the curvature and torsion graphs, and the values for the parameters measured changed depending on the setting of control points. Thus, it was clear that the modeling system needed to be improved for clinical use.
In the present study, we modified the V-modeler system and applied it to multiple cases for optimization. First, we followed SG centerlines at 2 time points and detected any migration. Chronological changes in SG curvature were then analyzed in terms of total SG length, as well as the lengths of proximal and distal SG sites. In addition, we performed 2 subanalyses: (1) comparisons between patients with severe SG curvature (total average curvature ≥0.017) and non-severe SG curvature (total average curvature <0.017); and (2) comparisons of the 2 devices (i.e., Zenith and Exclude) used in patients.
Methods
Modeling System
In our previous study11
we developed V-Modeler, an effective modeling system for constructing the 3-dimensional (D) geometry of both SGs and the aortic lumen. The advantages of this system included its ability to construct arterial networks as centerlines, to represent the centerlines as spline functions, and to quantify morphological changes over time based on these spline functions (Figure 1).
In the present study, the parameters used were centerline length (L), including the migrated distance of the distal end of the SG centerline, and curvature (κ) along the centerline.
These 2 geometric parameters were calculated based on the following spline functions:


where
t
is a parameter of the curve and
s′ is defined as follows:

Modification of the Modeling System
After exploratory analysis of several cases using the existing V-Modeler system, we found that the curves resulting from graphing of the parameters had too many artifacts to use clinically, leading us to modify the system. The spline-fitting method we used in V-Modeler is commonly optimized via a penalized spline regression combining a 3rd-degree basis function and a penalty term that is the 2nd derivative of the fitted curve. In the modified model, we instead used a 5th-degree basis function and a 4th derivative penalty term to optimize the curvature and torsion parameters of the fitted curve. In addition, we used the Akaike information criterion (AIC), which is proposed to be a measure of the relative quality of statistical models for a given set of data, to generalize our cross-validation (Figure 1).
Patients
The present retrospective study adhered to the guidelines of the institutional research ethics committee, and all patients provided written informed consent. The data analysis performed in the study was approved by the Institutional Research Ethics Committee of The University of Tokyo Hospital (No. 3316(3)).
Of the patients who underwent EVAR from 2009 to 2015, 36 consecutive patients were selected who had been followed-up with contrast-enhanced computed tomography (CT) every 6 months, with a total of 72 SG centerline paths analyzed for these patients. These centerline paths were analyzed at 2 time points: immediately after the operation (immediate time point) and >1 year after the operation (mid-term time point).
Determination of Proximal and Distal SG Sites
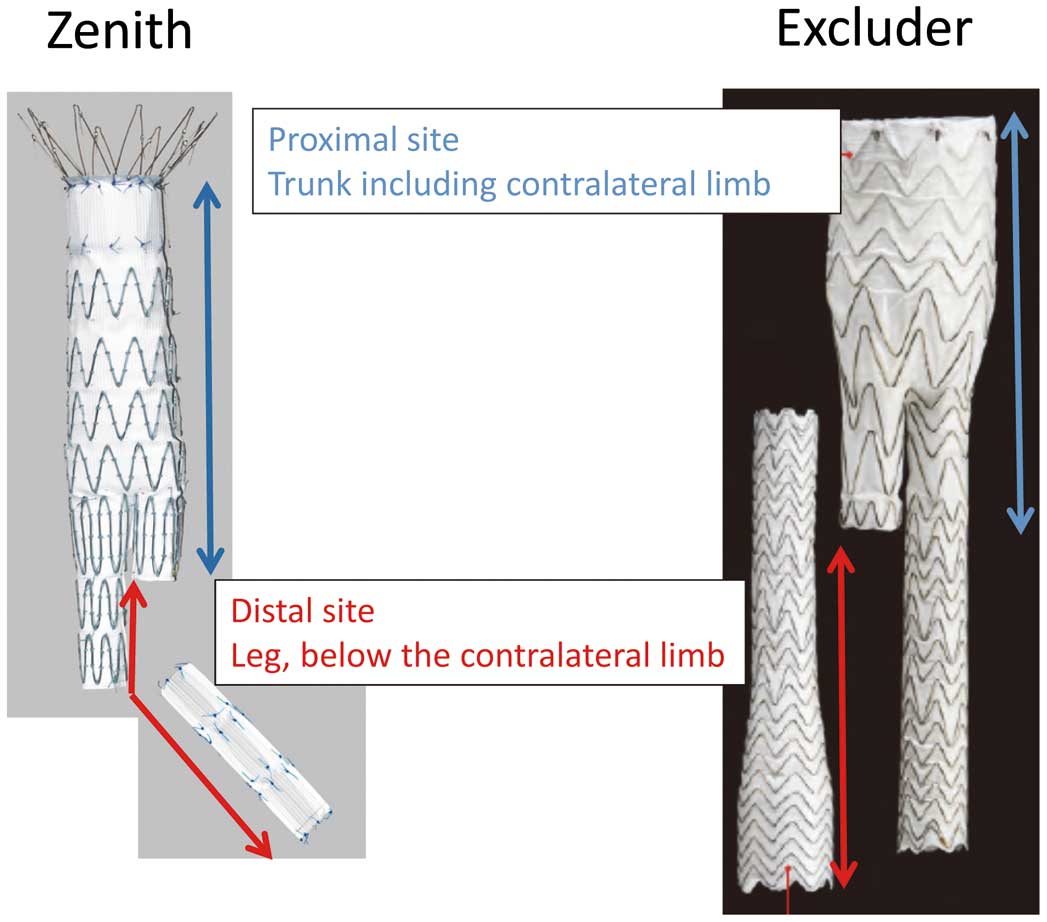
SG morphology was analyzed by dividing the analysis into proximal and distal SG sites. For both Zenith and Excluder devices, the proximal site was set as the trunk, including the contralateral limb, whereas the distal site was set as the leg below the contralateral limb (Figure 2).
Curvature Changes After SG Insertion
The total curvature was calculated for SG centerlines, as well as the curvature of their proximal and distal ends. According to the average value for total curvature, the centerlines were divided into 2 groups: (1) a severe curvature (≥0.017) group (n=35); and (2) a non-severe curvature (<0.017) group (n=37). Changes in proximal and distal curvature were also compared between Zenith and Excluder devices.
Changes in the Diameter of the Aorta/Iliac Arteries After SG Insertion
To evaluate chronological atherosclerotic changes to the native aorta and iliac arteries to which SGs should attach, their diameter was measured at the immediate and mid-term time points. Specifically, the diameter of the proximal aorta and iliac arteries was measured at the edge of the SG, with the enlargement rate (mm/year) defined as follows: (diameter at mid-term time point−diameter at immediate time point)/diameter at immediate time point/follow-up period (years).
Statistical Analyses
Values are reported as mean±SD. Categorical variables were compared using the Chi-squared test. All tests were 2-sided with statistical significance set at P<0.05.
Results
Patients’ Background Characteristics
Patients’ background characteristics are summarized in
Table 1. Across the 24 males and 12 females included in the present study, the mean age was 77.7±8.6 years and the mean aneurysm diameter was 53.9±7.2 mm. Two SG devices were used in these patients: a Cook ZenithTM
(Zenith; Cook Incorporated, Bloomington, IN, USA) was used in 12 patients and a Gore ExcluderTM
(Excluder; W.L. Gore & Associates, Flagstaff, AZ, USA) was used in 24 patients. The following adverse events occurred during the follow-up period (mean 26.5±12.4 months): distal migration of 8 legs in 7 patients, aneurysm sac dilatation >5 mm in 1 patient, and leg occlusion in 1 patient (Table 1).
Table 1.
Patient Characteristics
| Patient background |
| No. males/females |
24/12 |
| Age (years) |
77.7±8.6 |
| No. Zenith/Excluder devices |
12/24 |
| Follow-up period (months) |
26.5±12.4 |
| Aneurysm diameter (mm) |
53.9±7.2 |
| Comorbidities |
| Hypertension |
17 (47) |
| Diabetes mellitus |
4 (11) |
| Cardiovascular disease |
14 (38) |
| Respiratory disorder |
10 (27) |
| Cerebrovascular disease |
5 (13) |
| Chronic renal failure |
3 (8) |
| Postoperative adverse events |
| Distal migration (≥5 mm) |
7 cases/8 legs |
| Aneurysm sac dilatation (≥5 mm) |
1 case |
| SG leg occlusion |
1 case |
Unless indicated otherwise, data are given as the mean±SD or as n (%). SG, stent graft.
SG centerline length was measured from the orifice of the celiac artery to the iliac bifurcation. SG centerline length at the immediate time point (212.1±36.3 mm) was significantly lower than that at the mid-term time point (216.9±36.9 mm; P<0.0001).
SG Migration
Migration results are summarized in
Table 2. We confirmed that no SG proximal edges moved after device implantation. Distal migration was defined as an increase of >5 mm from the distal edge of the SG to the iliac bifurcation. In all, there were 8 cases of migration in 7 patients. In particular, there were 4 cases of migration for each of the Zenith and Excluder devices, with 1 patient experiencing downward migration of a Zenith device. We could not find an association between SG migration and changes in curvature in these cases of migration.
Table 2.
Cases of Migration (≥5 mm)
Patient
no. |
Age and
sex |
Device |
Side |
Follow-up
period
(months) |
Migration
(upward;
mm)* |
Change in curvature (immediate → 1 year after operation) |
| Total |
Proximal |
Distal |
| 1 |
68 M |
Zenith |
Right |
27 |
27.0 |
0.0129 → 0.0221 |
0.0068 → 0.0142 |
0.0166 → 0.0173 |
| |
|
|
Left |
|
7.7 |
0.0192 → 0.0159 |
0.0322 → 0.0276 |
0.0158 → 0.0110 |
| 2 |
83 M |
Zenith |
Left |
9 |
13.8 |
0.0207 → 0.0159 |
0.0161 → 0.0097 |
0.0248 → 0.0181 |
| 3 |
81 F |
Excluder |
Right |
51 |
6.0 |
0.0153 → 0.0145 |
0.0229 → 0.0176 |
0.0120 → 0.0122 |
| 4 |
96 F |
Excluder |
Left |
12 |
7.1 |
0.0160 → 0.0142 |
0.0179 → 0.0134 |
0.0160 → 0.0156 |
| 5 |
81 M |
Zenith |
Right |
12 |
−5.1 |
0.0115 → 0.0118 |
0.0101 → 0.0101 |
0.0118 → 0.0126 |
| 6 |
81 M |
Excluder |
Left |
60 |
9.8 |
0.0160 → 0.0142 |
0.0104 → 0.0097 |
0.0204 → 0.0178 |
| 7 |
81 F |
Excluder |
Left |
24 |
8.0 |
0.0123 → 0.0153 |
0.0148 → 0.0086 |
0.0106 → 0.0164 |
*Negative values indicate migration downward. M, male; F, female.
SG curvature at the immediate and mid-term time points was compared, with mean total curvature not changing between these time points (0.017±0.005 vs. 0.017±0.004, respectively;
Figure 3A). In addition, there was no significant difference in mean distal curvature between the immediate and mid-term time points (0.016±0.001 vs. 0.017±0.001, respectively; P=0.35). In contrast, mean proximal curvature was significantly higher at the immediate than mid-term time point (0.020±0.010 vs. 0.016±0.009, respectively; P<0.0001;
Figure 3B).
Severe Curvature Group vs. Non-Severe Curvature Group
In the severe curvature group, proximal curvature decreased significantly between the immediate and mid-term time points (0.024±0.002 vs. 0.020±0.002, respectively; P=0.0007). Conversely, distal curvature at the immediate time point did not significantly differ from that at the mid-term time point (0.020±0.001 vs. 0.019±0.001, respectively; P=0.11). In the non-severe curvature group, proximal curvature similarly decreased between the immediate and mid-term time points (0.015±0.001 vs. 0.012±0.001, respectively; P=0.0063), whereas distal curvature increased between these time points (0.013±0.0004 vs. 0.015±0.001, respectively; P=0.0011). These results are shown in
Figure 4A.
Device-Specific Analysis (Zenith vs. Excluder)
In the Zenith group, proximal curvature decreased between the immediate and mid-term time points (0.019±0.003 vs. 0.017±0.002, respectively), although the difference did not reach statistical significance (P=0.055). In contrast, distal curvature did not change between the immediate and mid-term time points (0.017±0.001 vs. 0.016±0.001, respectively; P=0.14). In the Excluder group, proximal curvature was higher at the immediate than mid-term time point (0.019±0.001 vs. 0.016±0.001, respectively; P<0.0001), whereas distal curvature did not change (0.017±0.001 vs. 0.018±0.001, respectively; P=0.16). These results are shown in
Figure 4B.
Changes in the Diameter of the Aorta/Iliac Arteries After SG Insertion
Rates of enlargement of the aorta and iliac arteries are shown in
Figure 5. The mean rate of enlargement at the proximal, right distal, and left distal sites was 0.00033±0.052, −0.019±0.058, and −0.0062±0.067 mm/year, respectively. In contrast, there was no tendency for enlargement of native arteries over time.
Discussion
In a previous study,11
we developed a modeling system named “V-modeler” to calculate the geometric parameters of the aorta and SG. Based on 1 case, we revealed morphological changes and migration of the SG, and digitized length, curvature, and torsion parameters. However, subsequent analysis of several SG cases revealed some problems, including noise (peaks) in the graphs of the parameters. In particular, it was difficult to calculate absolute values of curvature because they could change markedly depending on the setting of control points. We were able to solve this problem by modifying the original model and successfully digitized curvature values. After this modification, we confirmed the accuracy of the V-modeler system by measuring the length of the SG, native arteries, and migration. We could accurately evaluate migration length using the modified model, and found an additional 3 cases of migration (≥5 mm) that had not been identified clinically (2-dimensionally).
One of the purposes of the present study was to digitize aortic or SG curvature. Although we can instinctively recognize changes in SG morphology after insertion, there are few methods of representing these changes with numerical values.10
Indeed, measurement of aneurysm sac diameter has recently been the only objective method to be widely used during EVAR follow-up. However, this method is insufficient because sudden rupture due to a Type 1b endoleak cannot be predicted from sac diameter. Thus, if the potential risk of adverse events could be recognized using the present method, immediate reintervention without hesitation could be performed.
When we considered possible causes of morphological changes in SGs, we focused on the Y-shaped form of SGs and differences in the features of proximal and distal SG sites. Our hypothesis was that proximal changes should affect distal behavior. From the analyses of SG curvature in the present study, we confirmed that proximal SG curvature decreased (i.e., the device straightened) in all groups. In contrast, we could not find a common trend across all groups in distal site behavior after SG insertion. However, subanalyses revealed that distal curvature in the non-severe curvature group increased (i.e., the device bent) significantly, whereas distal curvature tended to decrease in the severe curvature and Zenith groups.
It is difficult to explain these interesting phenomena. We hypothesized in our previous study that torsion, which is unevenly distributed along the SG, would become uniform over time.11
In the same way, distal curvature should usually (in anatomically simple cases of EVAR) increase in response to straightening of the proximal site. We show a typical case of this in
Figure 6. However, there are 2 scenarios in which the distal site can instead straighten. First, in cases of severe curvature, the SG is usually pushed upwards after proximal deployment to adapt the device to aortic angulation, causing the SG fabric to fold into a bellows shape (buckling). This buckling needs to be released over time, which may account for SG straightening. Thus, the changes we found in total SG length may have been due to this buckling. Second, device properties may have caused differences in the distal site behavior we observed between the Zenith and Excluder groups. We have shown previously with 2D analysis that, after insertion, Zenith devices tend to straighten and Excluder devices tend to bend over time.12
This is further supported by the results of 3D analysis in the present study (Figure 4B). We propose that the properties of Zenith devices, including a thicker graft, stiffer structure, and lower flexibility, as well as the higher flexibility and thinner graft of Excluder devices, may have contributed to these results.

Although we expected the degree of morphological change to be associated with distal migration, the 8 cases of migration in the present study did not show any correlation with changes in curvature. This indicates that there are other reasons for distal migration In addition to changes in curvature. When an SG is inserted into a severely angulated aorta, the stiffness of the SG should cause recoil. We assume that this “recoil” is represented not only by SG curvature, but also by other parameters, such as torsion. Furthermore, enlargement of the native (iliac) artery with aging should cause the initially implanted SG to become relatively undersized over time.
Considering these reasons, we carefully checked the following 3 points during EVAR follow-up: (1) morphological changes to the SG; (2) enlargement of the diameter of the distal landing zone (iliac artery); and (3) distal migration. We believe that accurate measurement of such geometric factors is necessary for detecting adverse events as early as possible during follow-up. In terms of torsion (τ), calculations were performed in the same way as curvature as shown below, where:

However, our torsion graph showed frequent hectic conversion from negative to positive and vice versa, from which we found it difficult to evaluate torsion numerically. Although we therefore excluded torsion from analysis in the present study, we postulate that torsion could be a clinically useful measurement in combination with other geometric parameters.11
In terms of native aorta enlargement, which should be also checked carefully,13
we did not find any tendency for enlargement of the aorta or iliac arteries. However, there were 2 migrations among 7 cases with large iliac arteries (>20 mm). Therefore, large and short iliac landing zones may be risk factors for migration.
Despite the insights provided by the present study, it does have some limitations. First, the present study was a retrospective single-center observational study. Second, we collected data from a small number of patients. It is possible that morphological trends of the distal SG site would be more clearly revealed in a larger study population. Third, although we did not show the time frame over which geometric values were calculated, there was a learning curve and analysis was time-consuming at first. Recently, it has taken approximately 20 min to calculate curvature values per case. Finally, we only selected cases where either Zenith or Excluder devices were used, and included old generation devices.
In conclusion, we successfully represented SG behavior after implantation with numerical values for SG length and curvature. Although overall and distal SG curvature did not change, curvature at the proximal site decreased over time. The severe curvature group also showed the same trend, whereas distal curvature increased in the non-severe curvature group. In addition, proximal curvature decreased more with Excluder than Zenith devices. We also followed SG centerline length and found 8 migrations; however, we did not find an association between changes in curvature and migration.
Sources of Funding
This research was funded by a Grant-in-Aid for Scientific Research (B) from the Ministry of Education, Culture, Sports, Science and Technology, Japan.
Conflicts of Interest
The authors report no conflicts of interest.
References
- 1.
Greenhalgh RM, Brown LC, Kwong GP, Powell JT, Thompson SG; EVAR Trial Participants. Comparison of endovascular aneurysm repair with open repair in patients with abdominal aortic aneurysm (EVAR Trial 1), 30-day operative mortality results: Randomised controlled trial. Lancet 2004; 364: 843–848.
- 2.
Prinssen M, Verhoeven EL, Buth J, Cuypers PW, van Sambeek MR, Balm R, et al. A randomized trial comparing conventional and endovascular repair of abdominal aortic aneurysms. N Engl J Med 2004; 351: 1607–1618.
- 3.
United Kingdom EVAR Trial Investigators, Greenhalgh RM, Brown LC, Powell JT, Thompson SG, Epstein D, Sculpher MJ. Endovascular versus open repair of abdominal aortic aneurysm. N Engl J Med 2010; 362: 1863–1871.
- 4.
De Bruin JL, Baas AF, Buth J, Prinssen M, Verhoeven ELG, Cuypers PWM, et al. Long-term outcome of open or endovascular repair of abdominal aortic aneurysm. N Engl J Med 2010; 362: 1881–1889.
- 5.
Lederle FA, Freischlag JA, Kyriakides TC, Matsumura JS, Padberg FT, Kohler TR, et al. Long-term comparison of endovascular and open repair of abdominal aortic aneurysm. N Engl J Med 2012; 367: 1988–1997.
- 6.
Schurink GWH, Aarts NJM, van Baalen JM, Kool LJS, van Bockel JH. Stent attachment site-related endoleakage after stent graft treatment: An in vitro study of the effects of graft size, stent type, and atherosclerotic wall changes. J Vasc Surg 1999; 30: 658–667.
- 7.
Albertini JN, Kalliafas S, Travis S, Yusuf W, Macierewicz JA, Whitaker SC, et al. Anatomical risk factors for proximal perigraft endoleak and graft migration following endovascular repair of abdominal aortic aneurysms. Eur J Vasc Endovasc Surg 2000; 19: 308–312.
- 8.
Raghavan ML, Kratzberg JA, Golzarian J. Introduction to biomechanics related to endovascular repair of abdominal aortic aneurysm. Tech Vasc Interventional Rad 2005; 8: 50–55.
- 9.
Lederle FA, Freischlag JA, Kyriakides TC, Padberg FT, Matsumura JS, Kohler TR, et al. Outcomes following endovascular vs open repair of abdominal aortic aneurysm: A randomized trial. JAMA 2009; 302: 1535–1542.
- 10.
Ihara T, Komori K, Banno H, Kodama A, Yamamoto K. Relationship between the distal migration and length of the distal landing zone after endovascular aneurysm repair (EVAR). Surg Today 2016; 46: 56–61.
- 11.
Kobayashi M, Hoshina K, Yamamoto S, Nemoto Y, Akai T, Shigematsu K, et al. Development of an image-based modeling system to investigate evolutional geometric changes of a stent graft in an abdominal aortic aneurysm. Circ J 2015; 79: 1534–1541.
- 12.
Hoshina K, Akai T, Takayama T, Kato M, Nakazawa T, Okamoto H, et al. Outcomes and morphologic changes after endovascular repair for abdominal aortic aneurysms with a severely angulated neck: A device-specific analysis. Circ J 2013; 77: 1996–2002.
- 13.
Abbruzzese TA, Kwolek CJ, Brewster DC, Chung TK, Kang J, Conrad MF, et al. Outcomes following endovascular abdominal aortic aneurysm repair (EVAR): An anatomic and device-specific analysis. J Vasc Surg 2008; 48: 19–28.