Abstract
Background:
Careful device programming is necessary to reduce inappropriate antitachycardia pacing (ATP) and shock therapy in recipients of implantable cardioverter-defibrillators (ICD). This retrospective study investigated the safety and efficacy of a therapy-reducing programming strategy in comparison with conventional strategies in consecutive ICD recipients of a university cardiac center.
Methods and Results:
All 1,471 ICD recipients from 2000 to 2015 were analyzed. Individual ICD programming (IND) was used from 2000 to 2005 followed by standard-three-zone programming (STD) until 2010. From 2010 to 2015 therapy-reducing long detection time programming (RED) was established. The mean follow-up was 2.4±1.6, 2.3±1.6 and 1.7±1.2 years in the IND, STD and RED groups, respectively. Switchover from IND to STD revealed a significant reduction in inappropriate ATP (P=0.024) and shock therapy (P<0.001). Further reduction of 58% (RR=0.42, 95% confidence interval [CI]: 0.17–1.04; P=0.061) in inappropriate ATP and 29% (RR=0.71, 95% CI: 0.29–1.72; P=0.452) in inappropriate shock therapy was achieved by switchover from STD to RED. Kaplan-Meier analysis revealed a significant difference in time until first inappropriate ATP and shock therapy among the 3 groups, being lowest in the RED group (P≤0.001). There was no difference in overall mortality (P=0.416).
Conclusions:
Defensive ICD programming with prolonged detection times is safe and significantly reduced inappropriate ICD therapies.
Major clinical trials have demonstrated the benefits of implantable cardioverter-defibrillator (ICD) therapy in reducing mortality in patients at high risk for ventricular arrhythmias, in both primary and secondary prevention.1–3
Despite the proven benefits of ICDs, inappropriate device therapies that are delivered for causes other than ventricular arrhythmia and their association with increased mortality and reduction in quality of life raise concerns.4,5
Although studies have reported that ICD programming with a prolonged delay in therapy can significantly reduce both inappropriate ICD therapies6–8
and deaths9,10
in selected study populations, there are no data comparing different programming strategies independent of the underlying disease or prevention strategy. Therefore, our retrospective study investigated the influence of 3 programming strategies on the occurrence of inappropriate ICD therapy and death in an unselected real-world population with long follow-up times.
Methods
Study Design and Study Population
This was a retrospective study performed at the Department of Cardiology of the Medical University of Vienna in unselected patients who were implanted with an ICD. The study was approved by the local ethics committee. Inclusion criterion was: all patients who underwent ICD implantation between January 2000 and May 2015 regardless of comorbidities, indication for primary or secondary prevention and type/manufacture of ICD device. January 2000 was chosen as the beginning, because since late 1999 cardiac resynchronization therapy-defibrillator (CRT-D) was established as standard therapy as well as single-chamber ICD (VVI) and dual-chamber ICD (DDD) at the institution. Three programming strategies were consecutively used, starting with the individual programming strategy (IND) from January 2000 to August 2005. The end of follow-up for the IND group was September 2005 when the standard-three-zone programming strategy (STD) was introduced. ICD recipients were included in the STD group if they underwent implantation between September 2005 and September 2010. End of follow-up for the STD group was October 2010, with the beginning of the ‘therapy-reducing long detection time strategy’ (RED). Patients were included in the RED group if they received an ICD between October 2010 and May 2015, with the end of follow-up in June 2015.
Data Source and Follow-up
The data source for this study was the database of the arrhythmia outpatient department of the Medical University of Vienna. It is routinely used daily and provided all relevant data that was required for the study’s purposes, including accurate information on the occurrence and classification of ICD therapy and patient’s mortality outcome. Follow-up was conducted in the arrhythmia outpatient department at least every 6 months or after an (suspected) arrhythmia event. It included analysis of the device storage for occurrence of delivered therapy, which was classified as appropriate and inappropriate antitachycardia pacing (ATP) or shock therapy by a specialized cardiologist. The duration of follow-up was calculated from the time of ICD implantation.
ICD Programming
The IND programming strategy used individual and patient-to-patient different settings at the discretion of the patient’s physician. In the STD programming strategy, 3 zones were determined with standardized ATP or shock therapy: VT 1: ≥160 beats/min, ATP therapy only; VT 2: ≥200 beats/min, ATP+shock therapy; VF: ≥240 beats/min, shock therapy only. The IND and STD programming strategies did not use or re-program detection times. The RED programming strategy aimed to prolong detection times to the maximum number of intervals to detect (NID) (Table 1).
Table 1.
ICD Settings for the Therapy Reducing “RED Phase” (2010–2015)
| Zone |
Parameter |
Value |
Therapy |
| BiotronikTM |
| VT 1 Zone |
beats/min |
162–200 |
None |
| |
Detection (NID) |
50/50 |
|
| |
Redetection (NID) |
30/30 |
|
| VT 2 Zone |
beats/min |
200–240 |
2×ATP burst (8 pulses, 80% interval) |
| |
Detection (NID) |
30/30 |
1×ATP ramp (8 pulses, 80% interval) |
| |
Redetection (NID) |
20/20 |
10 ms decrement |
| VF Zone |
beats/min |
≥240 |
|
| |
Detection (NID) |
12/16 |
1×ATP burst (8 pulses, 85% interval) |
| |
Redetection (NID) |
12/16 |
Max. 8×shock therapy (40 J) |
| Boston ScientificTM |
| VT 1 Zone |
beats/min |
160–180 |
None |
| |
Detection (s) |
10.0 |
|
| |
Redetection (s) |
1.0 |
|
| VT 2 Zone |
beats/min |
180–220 |
4×ATP burst (6 impulses, increment 1 impulse, 81% interval) |
| |
Detection (s) |
10.0 |
4×ATP ramp/scan (6 impulses, increment 1 impulse, 78% interval, decrement 10 ms) |
| |
Redetection (s) |
1.0 |
Max. 6×shock therapy (41J) |
| VF Zone |
beats/min |
≥220 |
QUICK CONVERT ATPTM |
| |
Detection (s) |
5.0 |
Max. 8×shock therapy (41J) |
| |
Redetection (s) |
1.0 |
|
| MedtronicTM |
| VT Zone |
beats/min |
167–200 |
3×ATP burst (8 impulses, 81%) |
| |
Detection (NID) |
32/32 |
3×ATP ramp (8 impulses, 81%, 10 ms) |
| |
Redetection (NID) |
12/12 |
3×ATP ramp+ (8 impulses, 75%, 69%, 66%) |
| VF Zone |
beats/min |
≥200 |
1×ATP during charging (8 impulses, 81%) |
| |
Detection (NID) |
30/40 |
Max. 6×shock therapy 35 J |
| |
Redetection (NID) |
12/16 |
|
| FVT |
beats/min |
200–240 |
3×ATP burst (8 impulses, 81%) |
| |
Detection (NID) |
30/40 |
3×ATP ramp (8 impulses, 78%) |
| |
Redetection (NID) |
12/16 |
3×ATP ramp+ (8 impulses, 75%, 69%, 66%) |
| |
|
|
3×shock therapy (35 J) |
| St. Jude MedicalTM |
| VT 1 Zone |
beats/min |
160–200 |
None |
| |
Detection (NID) |
35/35 |
|
| VT 2 Zone |
beats/min |
200–240 |
3×ATP burst (8 impulses, 85%) |
| |
Detection (NID) |
35/35 |
2×ATP ramp (8 impulses, 82%, decrement 10 ms) |
| VF Zone |
beats/min |
≥240 |
1×ATP during charging (8 impulses, 85%, minimum cycle length 170 ms) |
| |
Detection (NID) |
16/16 |
1×shock (30 J), 5×shock (36–40 J) |
| Sorin/LivaNovaTM |
| Slow VT |
beats/min |
x–160 |
None |
| |
Detection (NID) |
50/50 |
|
| VT Zone |
beats/min |
161–199 |
3×ATP burst (8 impulses, 80% interval) |
| |
Detection (NID) |
30/30 |
3×ATP ramp (6 impulses, +1 impulse/sequence, decrement 8 ms, 85% interval) |
| VF Zone |
beats/min |
≥200 |
1×ATP burst (8 impulses, 80%, 200–240 beats/min) |
| |
Detection (NID) |
20/20 |
Max. 6×shock therapy (42J) |
NID, number of intervals to detect; VF, ventricular fibrillation; VT, ventricular tachycardia.
Left ventricular ejection fraction (LVEF) was initially calculated by echocardiography, ventriculography following coronary angiography or magnetic resonance imaging (gold standard). LVEF was reassessed by echocardiography or radionuclide angiography.
Endpoints and Classification of Death
The primary endpoint was time to ATP or shock therapy. All-cause death was a secondary endpoint. In the case of death, physicians and family members, as well as witnesses, were interviewed for detailed circumstances. The real follow-up endpoint was the last time the device was interrogated, and this date was used for survival analysis. Stored ECGs with RR intervals and device settings for each patient’s ICD were used for data analysis.
Statistical Analysis
Descriptive statistics are presented as number and percentage for categorical variables and as mean±standard deviation for continuous variables. Negative binomial regression was performed to compare counts of appropriate and inappropriate therapy (RED vs. IND and RED vs. STD). Individual follow-up times of each patient were accounted for in terms of an offset variable in the model. Robust variance estimation was used in the calculation of confidence intervals (CIs) and Wald-test P-values for rate ratios. Kaplan-Meier analysis and the log-rank test were used to evaluate differences in time to first occurrence of inappropriate therapy and overall survival. Univariate and multivariate Cox regression was performed to determine predictors of overall survival. The univariate Cox regression models were fit for the explanatory variables age, treatment with antiarrhythmic drugs Class 3 (according to the classification of Vaughan-Williams), implantation for primary preventive indication, device type (VVI, DDD, CRT-D), programming strategy (IND, STD, RED) and LVEF divided into normal, mild, moderate and severe reduction. The multivariate Cox regression model contained variables with a P-value <0.10 in the univariate analysis. The statistical analysis was conducted with the software program SPSS (version 24.0, SPSS Inc., Chicago, IL, USA) with a significance level of a two-sided P-value ≤0.05.
Results
A total of 1,471 patients were included. Their clinical characteristics according to the 3 programming strategies and differences between the groups are presented in
Table 2. Patients in the RED group were significantly older than patients in the STD group. RED patients suffered more often from diabetes, less often took Class 3 antiarrhythmic drugs and their follow-up was shorter compared with IND and STD patients. Furthermore, among the RED patients single-chamber devices were less frequently used and CRT-D devices more frequently compared with patients in the IND and STD groups.
Table 2.
Clinical Characteristics of Patients in the 3 ICD Programming Groups
| |
IND |
STD |
RED |
P value |
RED vs.
IND |
RED vs.
STD |
IND vs. STD
vs. RED |
| No. of patients |
398 |
499 |
574 |
|
|
|
| Age (years, mean±SD) |
60.7±12.7 |
60.5±14.1 |
62.4±14.1 |
0.063 |
0.036 |
0.060 |
| Male (n, %) |
328 (82.4) |
408 (81.8) |
470 (81.9) |
0.832 |
0.960 |
0.966 |
| Follow-up (years, mean±SD) |
2.4±1.6 |
2.3±1.6 |
1.7±1.2 |
<0.001 |
<0.001 |
<0.001 |
| Ischemic heart disease (n, %) |
249 (62.6) |
281 (56.3) |
329 (57.3) |
0.101 |
0.740 |
0.166 |
| Dilated cardiomyopathy (n, %) |
75 (18.8) |
103 (20.6) |
106 (18.5) |
0.882 |
0.370 |
0.642 |
| Other (n, %) |
74 (18.6) |
115 (23.0) |
139 (24.2) |
0.037 |
0.653 |
0.132 |
| Hypertension (n, %) |
269 (67.6) |
318 (63.7) |
367 (63.9) |
0.239 |
0.943 |
0.408 |
| Diabetes mellitus (n, %) |
72 (18.1) |
90 (18.0) |
142 (24.7) |
0.014 |
0.008 |
0.009 |
| AAR according to Vaughan-Williams |
| Class 1 (n, %) |
3 (0.8) |
4 (0.8) |
5 (0.9) |
0.842 |
0.901 |
0.979 |
| Class 2 (n, %) |
322 (80.9) |
403 (80.8) |
468 (81.5) |
0.805 |
0.747 |
0.943 |
| Class 3 (n, %) |
158 (39.7) |
168 (33.7) |
161 (28.0) |
<0.001 |
0.046 |
0.001 |
| Class 4 (n, %) |
46 (11.6) |
48 (9.6) |
45 (7.8) |
0.050 |
0.301 |
0.148 |
| Sotalol (n, %) |
25 (6.3) |
23 (4.6) |
6 (1.0) |
<0.001 |
<0.001 |
<0.001 |
| ACEI/ARB (n, %) |
334 (83.9) |
392 (78.6) |
408 (71.1) |
<0.001 |
0.005 |
<0.001 |
| Digitalis glycosides (n, %) |
89 (22.4) |
44 (8.8) |
35 (6.1) |
<0.001 |
0.089 |
<0.001 |
| Aldosterone antagonists (n, %) |
136 (34.2) |
195 (39.1) |
255 (44.4) |
0.001 |
0.077 |
0.005 |
| Diuretics (n, %) |
241 (60.6) |
271 (54.3) |
304 (53.0) |
0.019 |
0.659 |
0.052 |
| LVEF (existing data/group, %) |
369/398 (92.7) |
460/499 (92.2) |
517/574 (90.1) |
|
|
|
| Normal (n, %) |
62 (16.8) |
84 (18.3) |
88 (17.0) |
0.932 |
0.663 |
0.866 |
| Mild reduction (n, %) |
49 (13.3) |
50 (10.9) |
59 (11.4) |
0.402 |
0.797 |
0.545 |
| Moderate reduction (n, %) |
67 (18.2) |
93 (20.2) |
88 (17.0) |
0.661 |
0.194 |
0.422 |
| Severe reduction (n, %) |
191 (51.8) |
233 (50.7) |
282 (54.5) |
0.413 |
0.237 |
0.472 |
| Single-chamber ICD (n, %) |
200 (50.3) |
229 (45.9) |
200 (34.8) |
<0.001 |
<0.001 |
<0.001 |
| Dual-chamber ICD (n, %) |
184 (46.2) |
151 (30.3) |
151 (26.3) |
<0.001 |
0.151 |
<0.001 |
| CRT-D (n, %) |
14 (3.5) |
119 (23.8) |
223 (38.9) |
<0.001 |
<0.001 |
<0.001 |
| Primary prevention (n, %) |
177 (44.5) |
245 (49.1) |
326 (56.8) |
<0.001 |
0.074 |
0.001 |
AAR, antiarrhythmic drug; ACEI, angiotensin-converting enzyme inhibitor; ARB, angiotensin-receptor blocker; CRT-D, cardiac resynchronization therapy-defibrillator; ICD, implantable cardioverter-defibrillator; IND, individual programming strategy; LVEF, left ventricular ejection fraction; RED, therapy-reducing long detection time programming; SD, standard deviation; STD, standard 3-zone programming.
In the overall study population, 123 (8.4%) patients received inappropriate ATP and 117 (8.0%) patients received inappropriate shock therapy in the years 2000–2015 (Table 3); 52 (13.1%) IND patients, 42 (8.4%) STD patients and 29 (5.1%) RED patients received inappropriate ATP. In 58 (14.6%) IND patients, 34 (6.8%) STD patients and 25 (4.4%) RED patients, inappropriate shock therapy occurred (Figure 1). The respective numbers of appropriate therapies are shown in
Table 3. We did not record syncope with trauma caused by our programming strategy. We did also not record undersensing during VF detection because of prolongation of detection times. Comparisons among the 3 groups are shown for equal follow-up times (IND vs. STD with Chi-square test) in
Table 3
and for non-equal follow-up times in
Table 4
with negative binomial regression analysis.
Table 3.
Patients With Inappropriate and Appropriate ICD Therapy
| |
IND
(n=398) |
STD
(n=499) |
RED
(n=574) |
IND vs. STD |
| P value |
| Inappropriate ATP, n=123 |
52 (13.1) |
42 (8.4) |
29 (5.1) |
0.024 |
| Inappropriate shock, n=117 |
58 (14.6) |
34 (6.8) |
25 (4.4) |
<0.001 |
| Appropriate ATP, n=305 |
122 (30.7) |
109 (21.8) |
74 (12.9) |
0.003 |
| Appropriate shock, n=238 |
91 (22.9) |
76 (15.2) |
71 (12.4) |
0.004 |
ATP, antitachycardia pacing. Other abbreviations as in Table 2.
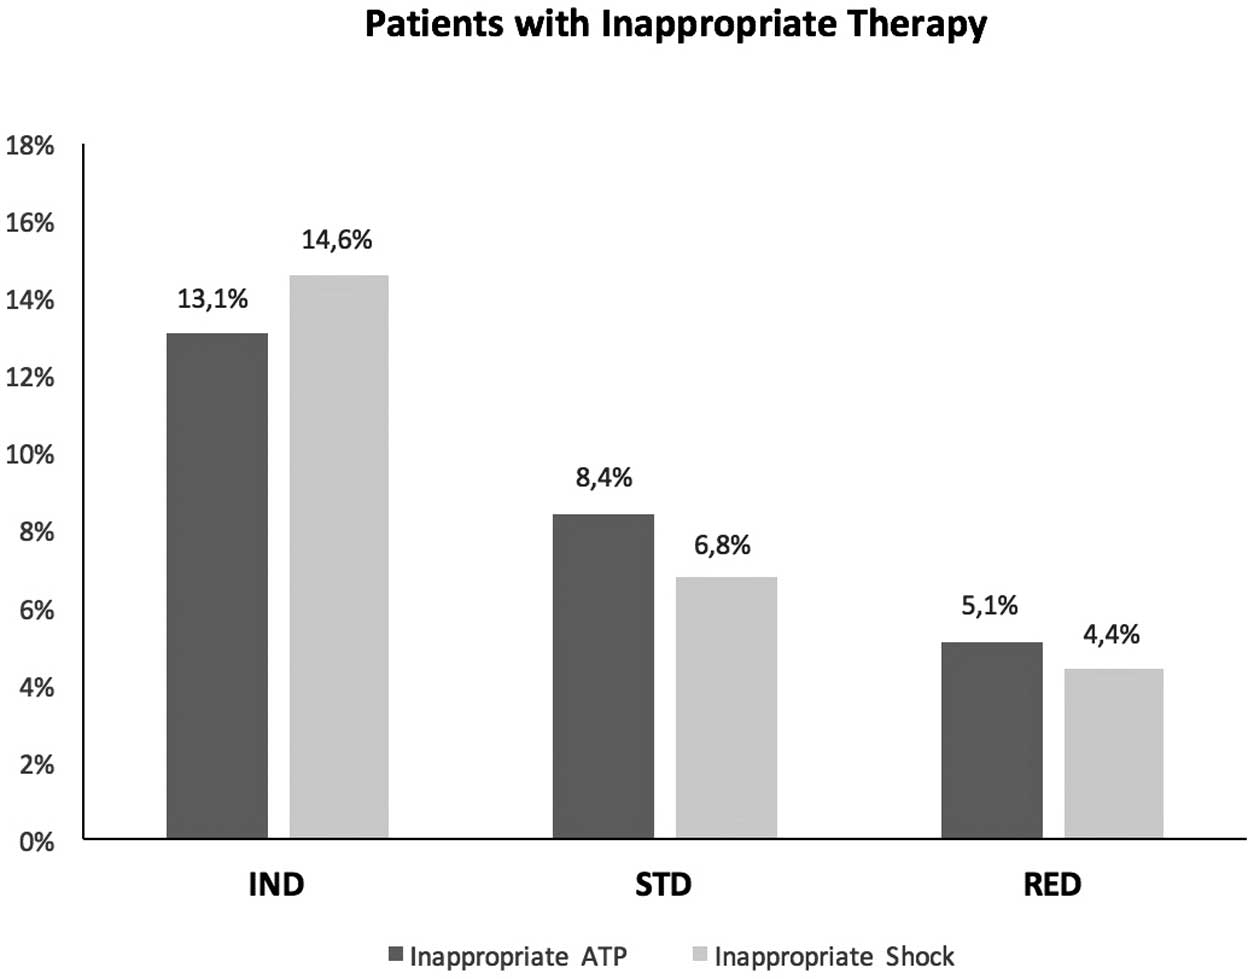
Table 4.
Number of Therapies and Rate per Patient Year: Binomial Regression Analysis of Inappropriate and Appropriate ICD Therapy
| |
IND |
STD |
RED |
RED vs. IND |
RED vs. STD |
| HR (95% CI) |
P value |
HR (95% CI) |
P value |
| Inappropriate ATP |
694 (0.73) |
504 (0.45) |
193 (0.20) |
0.19 (0.06–0.60) |
0.005 |
0.42 (0.17–1.04) |
0.061 |
| Inappropriate shock |
281 (0.30) |
158 (0.14) |
108 (0.11) |
0.31 (0.12–0.81) |
0.016 |
0.71 (0.29–1.72) |
0.452 |
| Appropriate ATP |
3,154 (3.33) |
4,168 (3.68) |
1,539 (1.62) |
0.38 (0.12–1.16) |
0.089 |
0.35 (0.11–1.18) |
0.089 |
| Appropriate shock |
479 (0.51) |
323 (0.29) |
618 (0.65) |
1.11 (0.31–4.00) |
0.870 |
2.13 (0.59–7.69) |
0.246 |
CI, confidence interval. Other abbreviations as in Tables 2,3.
Absolute ATP and shock rate per patient years are outlined in
Table 4. There was a significant reduction of 81% (rate ratio (RR)=0.19, 95% CI: 0.06–0.60; P=0.005) in inappropriate ATP and a significant reduction of 69% (RR=0.31, 95% CI 0.12–0.81; P=0.016) in inappropriate shock therapy in the RED group compared with the IND group. There was a reduction of 58% (RR=0.42, 95% CI: 0.17–1.04; P=0.061) of inappropriate ATP and a non-significant reduction of 29% (RR=0.71, 95% CI: 0.29–1.72; P=0.452) of inappropriate shock therapy in the RED group compared with the STD group. Comparisons regarding appropriate ATP or shock therapy reached no significance between different groups.
First Occurrence of Inappropriate Therapy
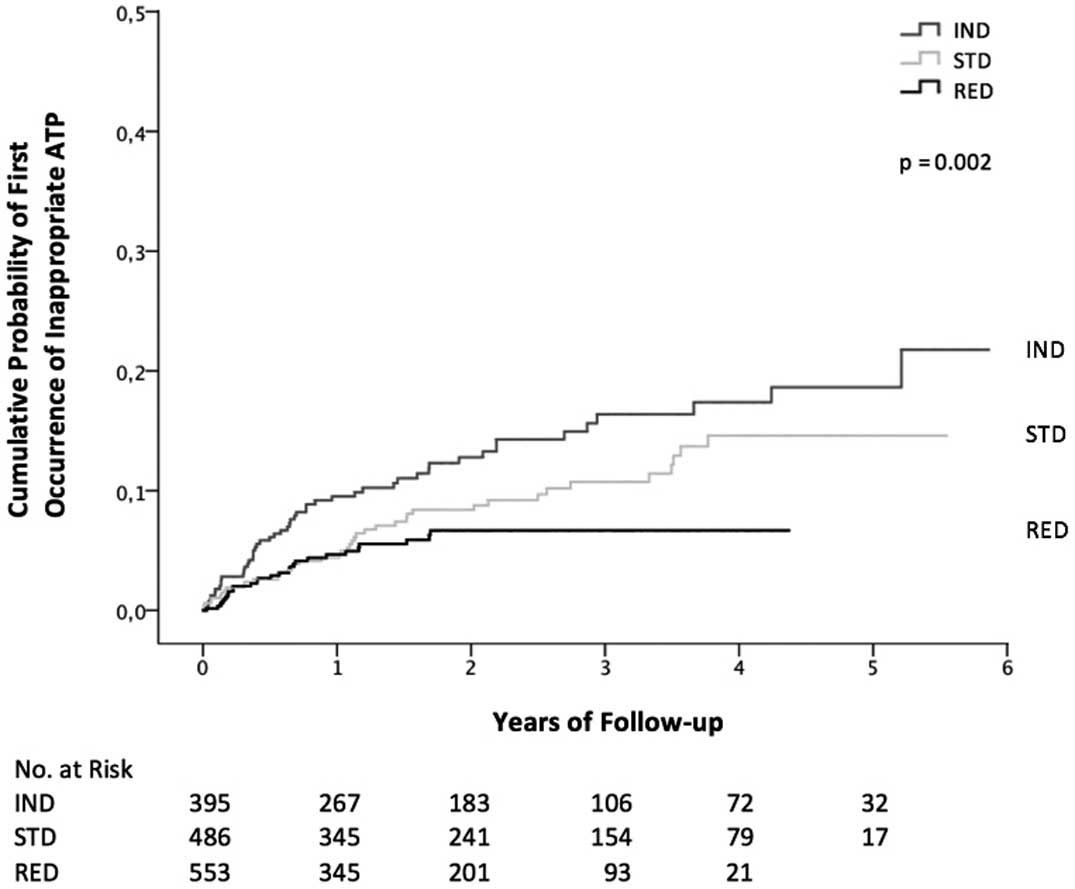
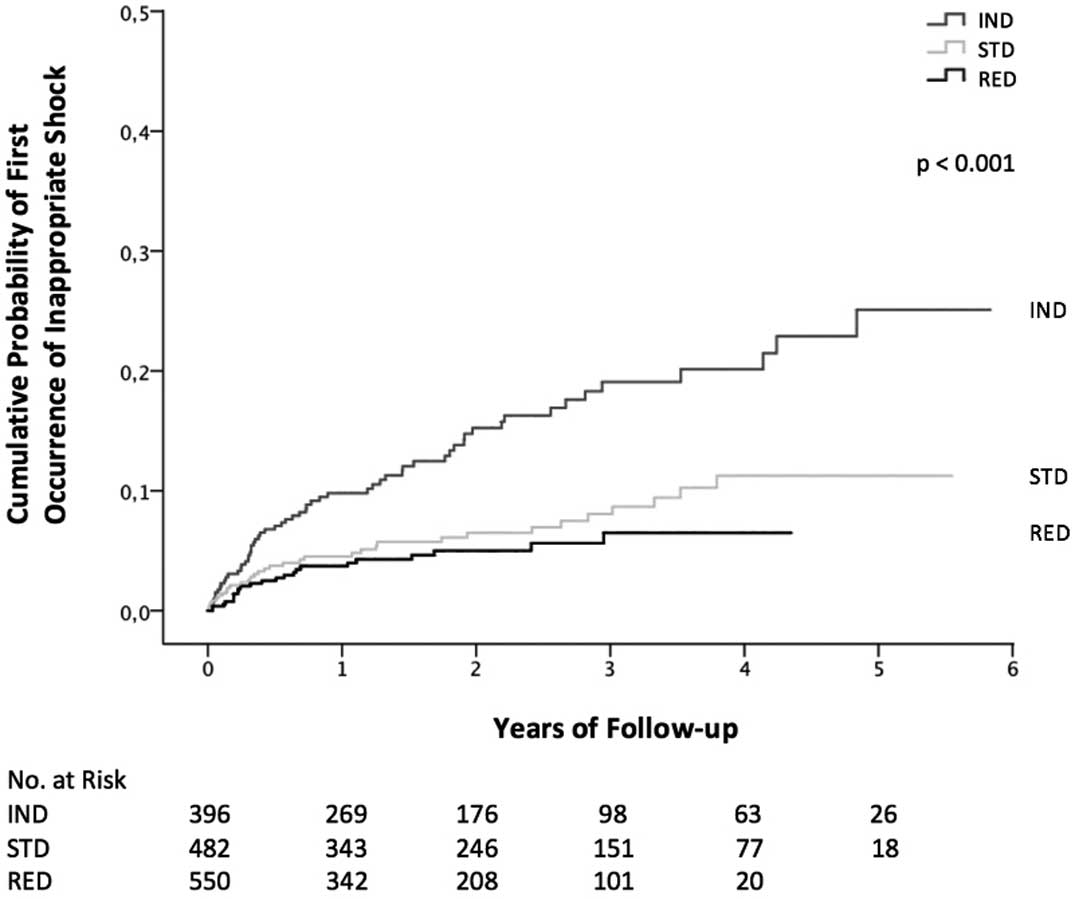
Kaplan-Meier analysis revealed a significant difference of first occurrence of inappropriate ATP (P=0.002) and inappropriate shock therapy (P≤0.001) among the 3 groups. (Figures 2,3) After 1, 2 and 4 years of follow-up, 90.5%, 87.2% and 82.6% of patients, respectively, were free of inappropriate ATP in the IND group, 95.6%, 91.6% and 85.4% of patients in the STD group and 95.3%, 93.3% and 93.3% of patients in the RED group. After 1, 2 and 4 years of follow-up, 90.2%, 84.8% and 79.9% of patients, respectively, were free of inappropriate shock therapy in the IND group, 95.5%, 93.5% and 88.8% of patients in the STD group and 96.3%, 95.0% and 93.5% of patients in the RED group.
Overall Survival
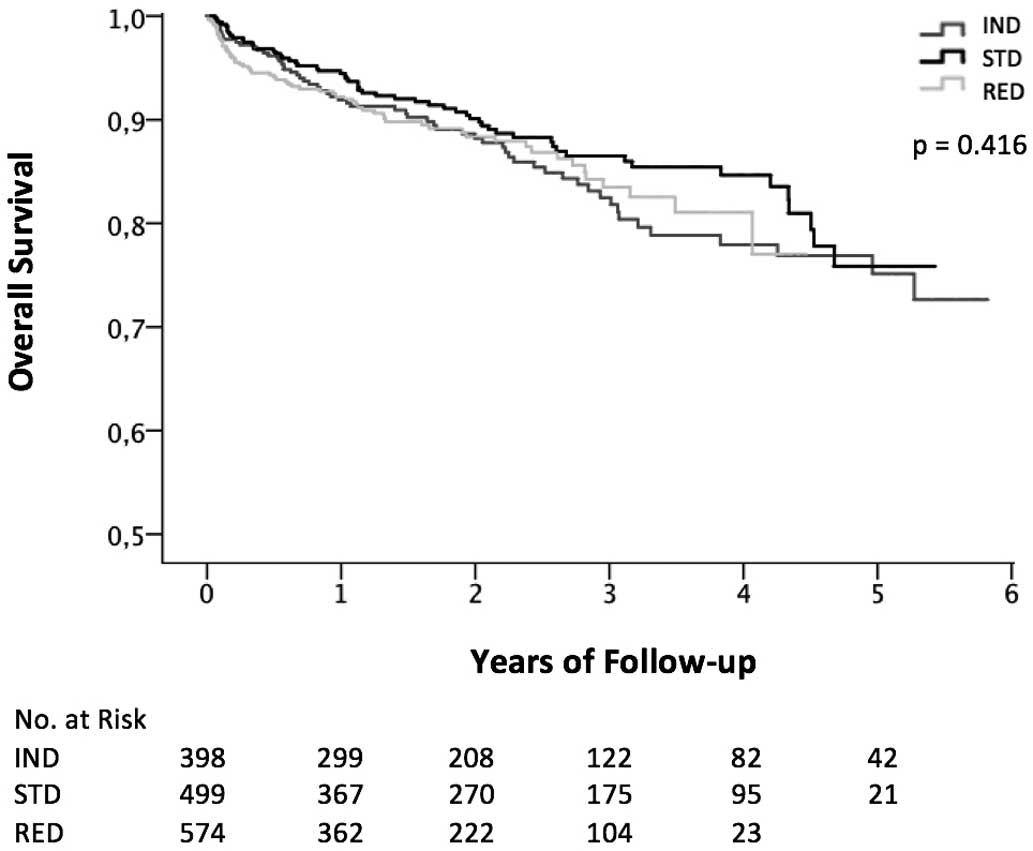
Kaplan-Meier analysis showed no difference in overall survival among the 3 groups (P=0.416) (Figure 4). Furthermore, Kaplan-Meier analysis demonstrated no difference among the 3 programming strategies for overall survival in patients stratified according to the underlying heart disease: ischemic heart disease (P=0.364) and non-ischemic heart disease (P=0.262). Cox regression model analysis was performed to determine predictors for overall death. The univariate analysis revealed that age (hazard ratio [HR]=1.04, 95% CI: 1.03–1.06; P≤0.01), treatment with Class 3 antiarrhythmic drugs (HR=1.70, 95% CI: 1.27–2.29; P≤0.01), normal LVEF (HR=0.43, 95% CI: 0.25–0.73; P≤0.01) and severely reduced LVEF (HR=1.72, 95% CI: 1.26–2.34; P≤0.01) were predictors for overall death. In the multivariate analysis, age (HR=1.04, 95% CI: 1.03–1.06; P≤0.01), treatment with Class 3 antiarrhythmic drugs (HR=1.50, 95% CI: 1.11–2.03; P≤0.01) and severely reduced LVEF (HR=1.50, 95% CI: 1.07–2.10; P≤0.01) remained predictors for overall mortality. The programming strategies IND (HR=1.11, 95% CI: 0.81–1.52; P=0.51), STD (HR=0.81, 95% CI: 0.59–1.11; P=0.19) and RED (1.12, 95% CI: 0.82–1.53; P=0.47) remained non-significant predictors of overall mortality.
An additional Cox model analysis calculated the risk for 1 or >1 inappropriate shock therapies, which might have been related to confounding factors of the 3 programming strategies over time: IND programming was associated with a higher risk for ≥1 inappropriate shocks (HR=1.88, P=0.002), STD programming was not associated with risk for ≥1 inappropriate shocks (HR=0.78, P=0.236) and RED programming was associated with reduced risk for ≥1 inappropriate shocks (HR=0.59, P=0.039).
Discussion
The main finding of this study was that a defensive ICD programming strategy with prolongation of detection times to a maximum significantly reduced the number of inappropriate ICD therapies. Furthermore, prolonged ICD detection times were safe in primary as well as in secondary preventive ICD patients during long-term follow-up.
Tailored or individualized ICD programming was used until 2005. With the switch to a standardized 3-zone programming, inadequate ATP and shock therapy could be reduced by approximately half. Conventional therapy-reducing ICD programming strategies include 2- or 3-zone programming with 1 monitoring zone, detection cutoffs in heart rate between 160 and 200 beats/min, arrhythmia detection windows with up to 30/40 NID, and parameters for discrimination of supraventricular tachycardia mostly demonstrated in primary preventive ICD patients. The RELEVANT, PREPARE and ADVANCE III trials6–8
compared programming strategies with delays between 12/16 and 30/40 NID. The 2016 published ENHANCED-ICD trial,11
demonstrated that a further prolongation of detection times to 60/80 NID is safe. Interestingly, our decision to take the next step and implement a long detection interval programming strategy in all devices starting from October 2010 was influenced by RELEVANT and PREPARE. When MADIT-RIT terminated follow-up in July 2012, our strategy had already been implemented for 1.7 years. In the current analysis, we report a reduction of 81% in the occurrence of inappropriate ATP and a reduction of 69% in inappropriate shock therapy during follow-up. This is in line with results from MADIT-RIT where risk reduction ranged between 79% and 44%.
In this large, real-world population we reported an inappropriate shock rate as low as 3.7% in the first years. This favorable finding compares with published data7,9
and a recent meta-analysis,12
in which annual inappropriate shock rates range between 5.1% and 7.9%, with only 1 study reporting rates of 1.9%.13
There is only a limited number of published studies available that include more than single-chamber devices.6,8,9,14
Our low numbers of inappropriate therapies became more relevant after we included ICD patients with VVI, DDD and CRT-D devices and included devices from all 5 relevant manufacturers. On multiple regression analysis, we could also demonstrate that device type and primary and secondary preventive ICD strategies did not significantly influence outcomes.
This study had a median follow-up period of 2.1±1.5 years with a maximum of 5.8 years, which is longer than in MADIT-RIT (1.4 years) and PREPARE, ADVANCE III and RELEVANT (1.0, 1.0, and 1.17 years, respectively).6–9
There are only 2 published studies with follow-up periods exceeding 3 years: the smaller MADIT-CRT study15
and a retrospective cohort study by van Rees et al.5
In all other published studies mean follow-up times range between 1 and 2.2 years. Following this, we could demonstrate that after 4 years of follow-up, cumulative inappropriate ATP and shock therapies rose up to 17% and 15%, respectively, compared with 11% after 2 years in the Opera study.16
The MADIT-RIT trial reported rates of inappropriate therapy of 29% in the conventional therapy group and 6% in the high-rate and the delayed group at an average follow-up of 2.5 years.9
To the best of our knowledge there are only 4 studies available that are not directly or indirectly supported by device manufacturers.5,7,8,17
The current study analyzed data from all relevant device manufacturers, and for devices implanted for primary and secondary preventive reasons and provides detailed information of all relevant covariables. In contrast, most studies included primary preventive ICD patients only. Some studies did also include secondary preventive ICD patients,5,7,14,17,18
but our study represents an unselected, real-world sample with approximately 60% ischemic heart disease patients, including patients with paroxysmal and persistent atrial fibrillation.
In the Opera study the mortality rates were 7% and 12% at 1 and 2 years of follow-up, respectively.16
In line with others we could demonstrate that with a change in the programming strategy (e.g., prolonging detection times to a maximum), patients’ safety was unaltered.6,14,17,18
The ADVANCE III trial7
confirmed the results of the RELEVANT, PREPARE and MADIT-RIT trials6,8,9
in regard to comorbidities and in patients with primary and secondary preventive implanted devices. Only the MADIT-RIT trial reported a reduction in overall mortality in the delayed therapy and high-rate therapy groups compared with conventional programming. The RELEVANT, PREPARE, ADVANCE III,6–8
the study by Deyell et al17
and the present study could not identify a statistically significant difference in overall mortality. However, inappropriate device therapy was linked with increased mortality in some studies.5,9,10
This could become relevant for patients treated with ICDs who have a mild to moderate reduced EF, because these patients carry a risk for arrhythmias over the long term.19,20
The present study could confirm with multivariate regression analysis that a severely reduced LVEF was the main predictor of all-cause death.
Study Limitations
This was a non-randomized, retrospective observational study performed to assess the potential benefit of ICD reprogramming. The study is unique because the sample size was large, and the follow-up was long and complete. However, longitudinal cohort studies may have limitations related to advances in ICD detection. Therefore, only prospective, double-blinded and randomized ICD trials could give definite answers about the possible true benefit of programming strategies.
Conclusions
The present study demonstrated that ICD programming with prolonged detection times safely reduced inappropriate ICD therapies in a large real-world population. These results should further encourage device clinics towards an overall defensive programming approach in ICD recipients.
Declaration of Interest
None declared. On behalf of all authors, the corresponding author states that there is no conflict of interest. All authors have seen and approved the paper. Authors take responsibility for all aspects of the reliability and freedom from bias of the data presented and their discussed interpretation.
Funding Sources
This research did not receive any specific grant from funding agencies in the public, commercial, or not-for-profit sectors.
References
- 1.
Bansch D, Antz M, Boczor S, Volkmer M, Tebbenjohanns J, Seidl K, et al. Primary prevention of sudden cardiac death in idiopathic dilated cardiomyopathy: The Cardiomyopathy Trial (CAT). Circulation 2002; 105: 1453–1458.
- 2.
Buxton AE, Lee KL, Fisher JD, Josephson ME, Prystowsky EN, Hafley G. A randomized study of the prevention of sudden death in patients with coronary artery disease: Multicenter Unsustained Tachycardia Trial Investigators. N Engl J Med 1999; 341: 1882–1890.
- 3.
Kadish A, Dyer A, Daubert JP, Quigg R, Estes NA, Anderson KP, et al. Prophylactic defibrillator implantation in patients with nonischemic dilated cardiomyopathy. N Engl J Med 2004; 350: 2151–2158.
- 4.
Daubert JP, Zareba W, Cannom DS, McNitt S, Rosero SZ, Wang P, et al. Inappropriate implantable cardioverter-defibrillator shocks in MADIT II: Frequency, mechanisms, predictors, and survival impact. J Am Coll Cardiol 2008; 51: 1357–1365.
- 5.
van Rees JB, Borleffs CJ, de Bie MK, Stijnen T, van Erven L, Bax JJ, et al. Inappropriate implantable cardioverter-defibrillator shocks: Incidence, predictors, and impact on mortality. J Am Coll Cardiol 2011; 57: 556–562.
- 6.
Gasparini M, Menozzi C, Proclemer A, Landolina M, Iacopino S, Carboni A, et al. A simplified biventricular defibrillator with fixed long detection intervals reduces implantable cardioverter defibrillator (ICD) interventions and heart failure hospitalizations in patients with non-ischaemic cardiomyopathy implanted for primary prevention: The RELEVANT [Role of long dEtection window programming in patients with LEft VentriculAr dysfunction, Non-ischemic eTiology in primary prevention treated with a biventricular ICD] study. Eur Heart J 2009; 30: 2758–2767.
- 7.
Gasparini M, Proclemer A, Klersy C, Kloppe A, Lunati M, Ferrer JB, et al. Effect of long-detection interval vs. standard-detection interval for implantable cardioverter-defibrillators on antitachycardia pacing and shock delivery: The ADVANCE III randomized clinical trial. JAMA 2013; 309: 1903–1911.
- 8.
Wilkoff BL, Williamson BD, Stern RS, Moore SL, Lu F, Lee SW, et al. Strategic programming of detection and therapy parameters in implantable cardioverter-defibrillators reduces shocks in primary prevention patients: Results from the PREPARE (Primary Prevention Parameters Evaluation) study. J Am Coll Cardiol 2008; 52: 541–550.
- 9.
Moss AJ, Schuger C, Beck CA, Brown MW, Cannom DS, Daubert JP, et al. Reduction in inappropriate therapy and mortality through ICD programming. N Engl J Med 2012; 367: 2275–2283.
- 10.
Saeed M, Hanna I, Robotis D, Styperek R, Polosajian L, Khan A, et al. Programming implantable cardioverter-defibrillators in patients with primary prevention indication to prolong time to first shock: Results from the PROVIDE study. J Cardiovasc Electrophysiol 2014; 25: 52–59.
- 11.
Mastenbroek MH, Pedersen SS, van der Tweel I, Doevendans PA, Meine M. Results of ENHANCED Implantable Cardioverter Defibrillator Programming to Reduce Therapies and Improve Quality of Life (from the ENHANCED-ICD Study). Am J Cardiol 2016; 117: 596–604.
- 12.
Auricchio A, Hudnall JH, Schloss EJ, Sterns LD, Kurita T, Meijer A, et al. Inappropriate shocks in single-chamber and subcutaneous implantable cardioverter-defibrillators: A systematic review and meta-analysis. Europace 2017; 19: 1973–1980.
- 13.
Sterns LD, Meine M, Kurita T, Meijer A, Auricchio A, Ando K, et al. Extended detection time to reduce shocks is safe in secondary prevention patients: The secondary prevention substudy of PainFree SST. Heart Rhythm 2016; 13: 1489–1496.
- 14.
Gilliam FR, Hayes DL, Boehmer JP, Day J, Heidenreich PA, Seth M, et al. Real world evaluation of dual-zone ICD and CRT-D programming compared to single-zone programming: The ALTITUDE REDUCES study. J Cardiovasc Electrophysiol 2011; 22: 1023–1029.
- 15.
Ruwald AC, Sood N, Ruwald MH, Jons C, Clyne CA, McNitt S, et al. Frequency of inappropriate therapy in patients implanted with dual- versus single-chamber ICD devices in the ICD arm of MADIT-CRT. J Cardiovasc Electrophysiol 2013; 24: 672–679.
- 16.
Leenhardt A, Defaye P, Mouton E, Delay M, Delarche N, Dupuis JM, et al. First inappropriate implantable cardioverter defibrillator therapy is often due to inaccurate device programming: Analysis of the French OPERA registry. Europace 2012; 14: 1465–1474.
- 17.
Deyell MW, Qi A, Chakrabarti S, Yeung-Lai-Wah JA, Tung S, Khoo C, et al. Prognostic impact of inappropriate defibrillator shocks in a population cohort. Heart 2013; 99: 1250–1255.
- 18.
Kolb C, Sturmer M, Sick P, Reif S, Davy JM, Molon G, et al. Reduced risk for inappropriate implantable cardioverter-defibrillator shocks with dual-chamber therapy compared with single-chamber therapy: Results of the randomized OPTION study. JACC Heart Fail 2014; 2: 611–619.
- 19.
Pezawas T, Diedrich A, Robertson D, Winker R, Richter B, Wang L, et al. Risk of arrhythmic death in ischemic heart disease: A prospective, controlled, observer-blind risk stratification over 10 years. Eur J Clin Invest 2017; 47: 231–240.
- 20.
Pezawas T, Diedrich A, Winker R, Robertson D, Richter B, Wang L, et al. Multiple autonomic and repolarization investigation of sudden cardiac death in dilated cardiomyopathy and controls. Circ Arrhythmia Electrophysiol 2014; 7: 1101–1108.