Abstract
Background:
The aim of this study was to assess the echocardiographic characteristics of chronic hemodialysis (HD) patients with end-stage renal disease (ESRD) in a multicenter prospective cohort study.
Methods and Results:
Three hundred and fifteen patients with ESRD (67.9±10.6 years, 47.6% male) on chronic HD for ≥1 year were examined on transthoracic echocardiography, including Doppler-derived aortic valve area (AVA) measurement. Only 11.5% and 3.4% of all patients had normal left ventricular (LV) geometry and normal LV filling pattern, respectively. The majority of patients had aortic and mitral valvular calcification, and approximately 50% of all 315 patients had aortic valve narrowing with AVA <2.0 cm2. Patients were divided into 3 groups according to AVA index tertile: group 1, highest tertile; group 2, middle tertile; and group 3, lowest tertile. Group 3 was older, had a greater cardiothoracic ratio on chest X-ray, higher plasma brain natriuretic peptide and total LV afterload, and lower stroke volume index than the other 2 groups. Age and intact parathyroid hormone (PTH) level were independently associated with low AVA index.
Conclusions:
Patients with ESRD on chronic HD have a high prevalence of cardiac structural and functional abnormalities including calcified aortic sclerosis. High age and PTH were associated with aortic valve narrowing in these patients.
Patients with end-stage renal disease (ESRD) on chronic hemodialysis (HD) often have a high prevalence of structural abnormalities of the heart including calcified valvular sclerosis,1,2
left ventricular (LV) remodeling3,4
and LV diastolic dysfunction,5
which may lead to a high rate of cardiovascular mortality. In particular, multiple pathways including calcium and phosphorus metabolic abnormalities caused by secondary hyperparathyroidism, inflammation and cardiac overload accelerate the process of valvular calcification, and the consequent aortic stenosis (AS) is the most common form of valve disease in patients receiving HD. In a previous retrospective case-control study in Japan, AS progresses rapidly and the prognosis was poor in patients receiving HD.2
No multicenter prospective cohort studies, however, have identified the prevalence and severity of cardiac abnormalities, their progression and contribution to poor outcome in patients on chronic HD in Japan. Accordingly, the aim of this preliminary report was to provide baseline echocardiographic characteristics, primarily focusing on the presence and severity of sclerotic change in aortic valve, in subjects enrolled in the Mie Cardio-Renal and Vascular Echocardiographic Investigation in Patients Receiving Hemodialysis Therapy (MIE-CARE HD) study, a multicenter prospective cohort study in Mie Prefecture, Japan.
Methods
Subjects
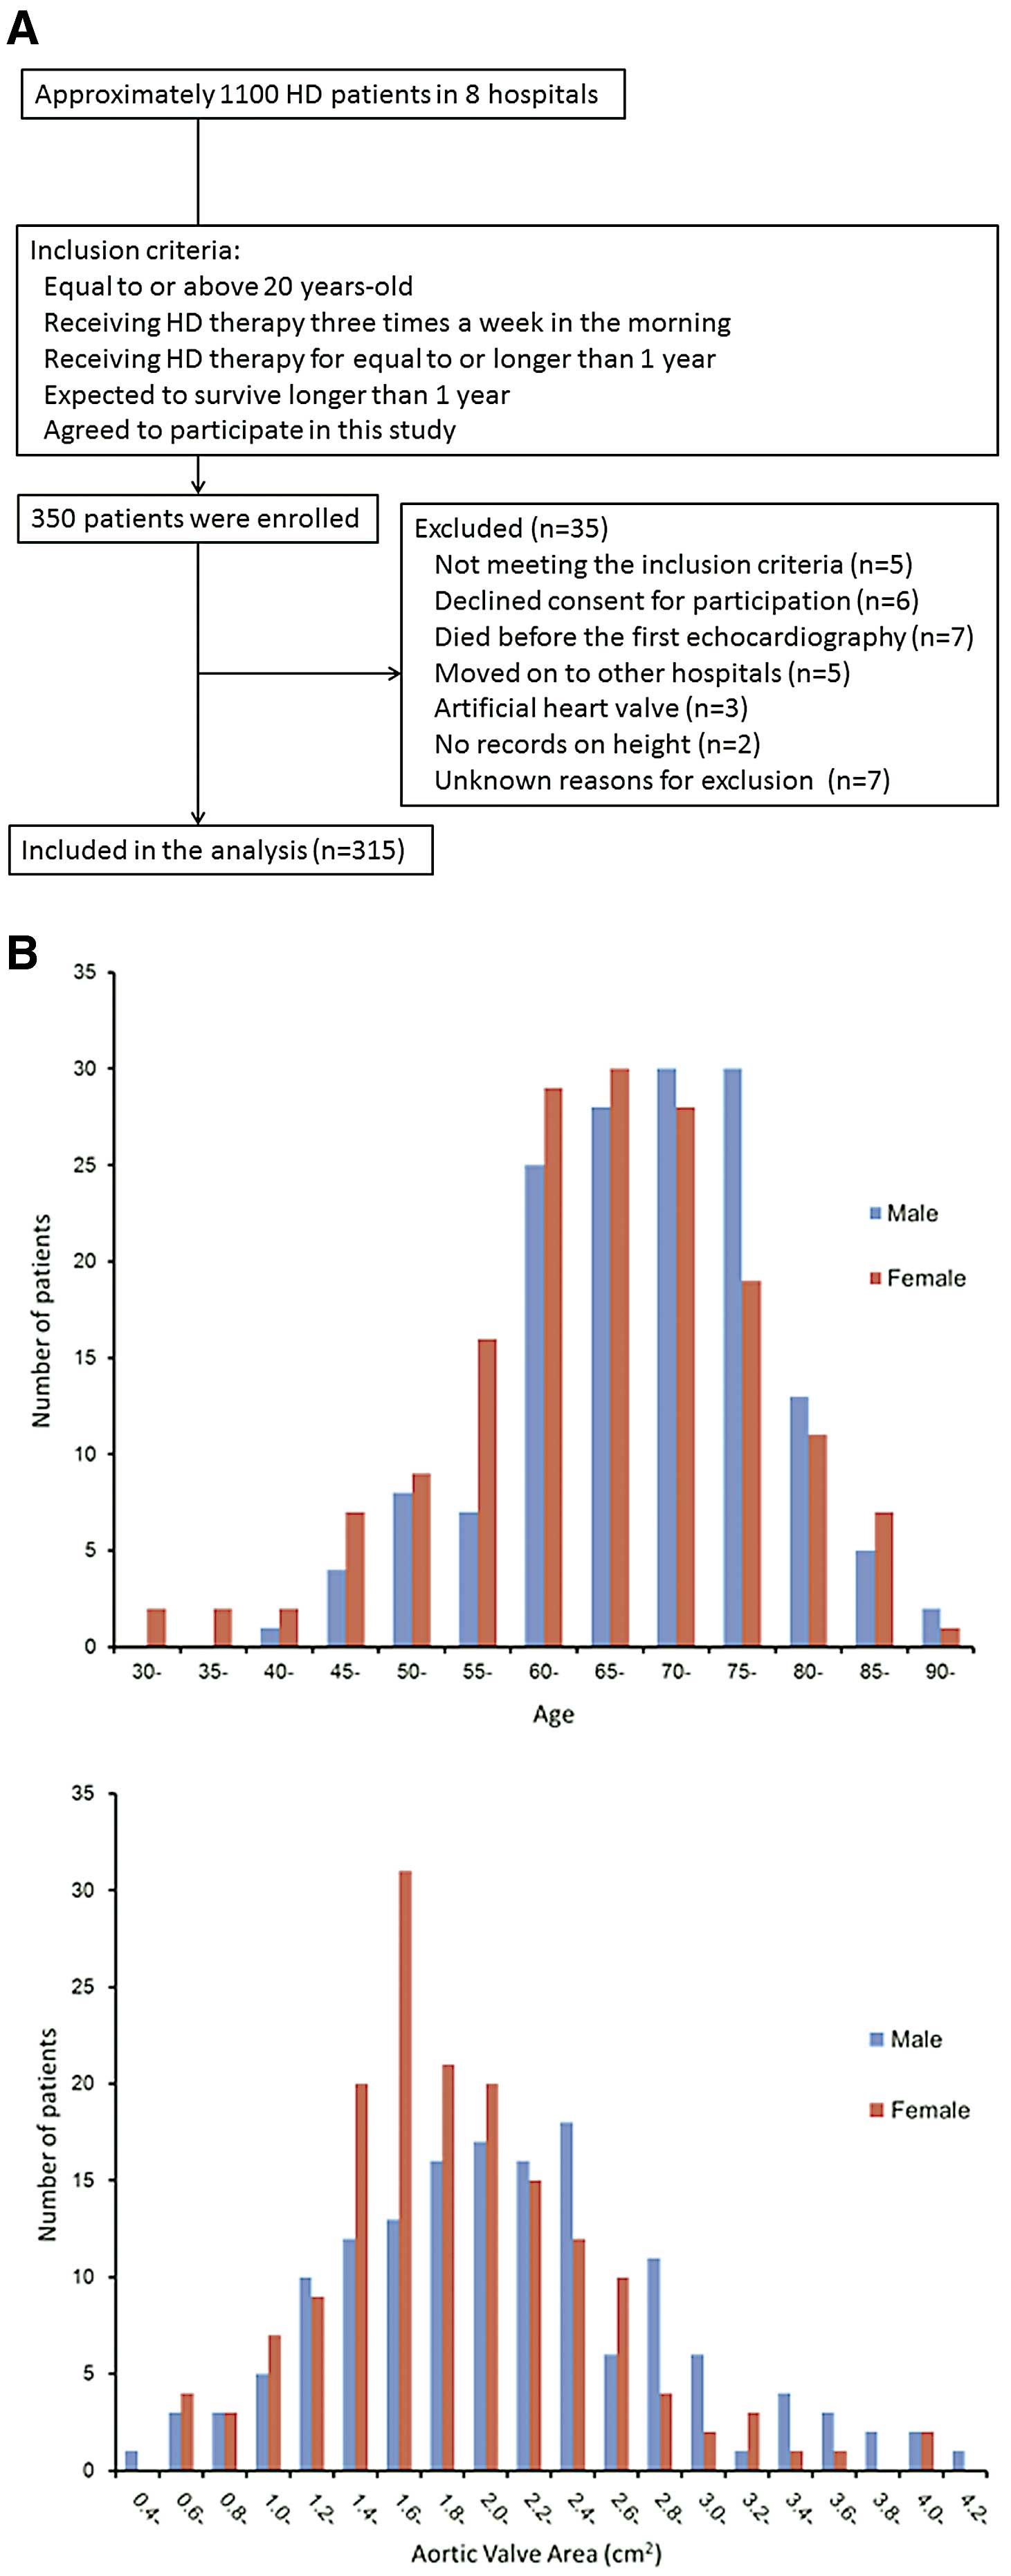
The MIE-CARE HD study is a multicenter prospective cohort study on the prevalence and severity of cardiac abnormalities, their annular progression and contribution to outcome in 300 patients on chronic HD enrolled from 8 hospitals, via 5-year follow-up in Mie Prefecture. Patients were enrolled between August 2011 and September 2014. Patients were included if they were aged ≥20 years, on chronic HD 3 times/week in the morning for ≥1 year, agreed to participate in the study, and signed the informed written consent (Figure 1A). Patients were excluded from the study if they were expected to die within 1 year because of non-cardiac disease, or if they had been on chronic HD for <1 year at the time of study entry. A total of 350 patients were primarily enrolled and 35 patients were excluded from the data analysis after enrollment because 5 patients did not meet inclusion criteria, 6 patients declined consent for participation, 7 patients died before the first echocardiography examination, 5 patients moved to other hospitals, 3 patients had artificial heart valves, and 2 patients had no record of height. The reasons for exclusion after study enrollment were not identified in 7 patients. Thus, this preliminary report on baseline echocardiographic characteristics focused on the presence and severity of aortic valve sclerosis in 315 patients. Given that a total of approximately 1,100 patients were receiving HD annually in the 8 hospitals, the estimated participation rate was 30% in the present study (Figure 1A). Written informed consent was obtained from all patients, and the protocol was approved for use by the Human Studies Subcommittee of Mie University Graduate School of Medicine (reference number 2229).
All patients underwent chronic HD 3 times per week for ≥1 year in principle, and they might have undergone additional HD at the physician’s discretion. Dialysis time, dialysis procedure including dialysis fluid, dialysis membrane, conditioning of the medicine, erythropoietin and dry weight were also determined based on the patient’s condition.
Laboratory, Electrocardiography and Chest X-Ray Data
In principle, blood samples were collected both before and immediately after an HD session within 2 weeks before or after echocardiography, but plasma atrial natriuretic peptide and brain natriuretic peptide (BNP) were collected immediately after an HD session. Electrocardiography and chest X-ray were also performed.
Echocardiography
Complete transthoracic echocardiography was performed in all subjects within 1 h after HD. Left atrial dimension (LAD), interventricular and LV posterior wall thickness (IVST and PWT), LV end-diastolic and end-systolic dimensions (LVDd and LVDs) and fractional shortening were assessed from the parasternal long-axis view. LA and LV dimensions were normalized by body surface area (BSA: LAD index, LVDd index and LVDs index, respectively). The LV outflow tract (LVOT) diameter was measured in the parasternal long-axis view in mid-systole, and then converted to LVOT area: π×(0.5×LVOT diameter)2.6,7
LV volume and ejection fraction (EF) were assessed using the biplane Simpson’s rule. Doppler-derived stroke volume (SV) was calculated as the product of the LVOT area and the LVOT velocity-time integral (VTI) obtained on pulsed Doppler, and was normalized by BSA (SV index). LV mass was calculated using the area-length method and was normalized by BSA (LV mass index), and LV geometries were classified into 4 types: (1) normal, relative wall thickness (RWT; 2×PWT/LV diastolic diameter) <0.42 and LV mass index <88 g/m2
for female subjects and <102 g/m2
for male subjects; (2) concentric remodeling, PWT >0.42 and LV mass index <88 g/m2
for female subjects and <102 g/m2
for male subjects; (3) eccentric hypertrophy, PWT <0.42 and LV mass index >88 g/m2
for female and >102 g/m2
for male subjects; and (4) concentric hypertrophy, PWT >0.42 and LV mass index >88 g/m2
for female subject and >102 g/m2
for male subjects.8
The ratio of peak early (E) to late (A) diastolic transmitral flow velocity (mitral E/A) and deceleration time were calculated using pulsed Doppler echocardiography. Tissue Doppler imaging (TDI) of the mitral annular motion was obtained from the apical 4-chamber view. The sample volume was placed at the septal and lateral mitral annuli, and early (E’) and late (A’) diastolic annular velocities were measured. The ratio of mitral E to septal and lateral E’ as well as to average (septal and lateral) E’ (E/E’Ave) was calculated.9
LV filling patterns in sinus rhythm were classified into 4 types according to the American Society of Echocardiography Guidelines published in 2016 but the classification method was modified because of a lack of LA volume index and TR velocity measurements in the present study: (1) normal filling pattern, E/A >0.8 and normal E’ with lateral E’ ≥10 cm/s and septal E’ ≥7 cm/s; (2) impaired relaxation pattern, E/A ≤0.8 and abnormal E’; (3) pseudo-normal filling pattern, E/A 0.8–2.0 and abnormal E’; and (4) restrictive filling pattern, E/A >2.0 and abnormal E’.
Aortic calcification was defined as increased thickness and bright echoes of the valve leaflets.10
Mitral annular calcification (MAC) was identified by the presence of bright echoes at the base of the mitral leaflets.11
Peak velocity, mean pressure gradient (MPG), and valve area across both aortic and mitral valves were also measured in all subjects. Aortic valve area (AVA) and mitral valve area (MVA) were calculated using the continuity equation: AVA=SV/trans-aortic VTI and MVA=SV/trans-mitral VTI, and were normalized by BSA (AVA index and MVA index) to assess the substantial valvular narrowing.12
The valvuloarterial impedance (ZVA), a surrogate of global LV afterload, was defined as the ratio of the estimated LV systolic pressure (i.e., the sum of systolic blood pressure [SBP] and MPG) to SV index (SVI): ZVA=(SBP+MPG)/SVI.13,14
All echocardiography-derived parameters were measured from a single beat using a representative image in cases of sinus rhythm, and using an average of 3 beats in the case of atrial fibrillation (AF). Valvular regurgitation was semiquantified by color Doppler echocardiography.
Data Management
The Critical Research Support Center at Mie University Hospital (http://www.medic.mie-u.ac.jp/chiken/) performed data management. Clinical and echocardiographic data were obtained according to the study protocol and registered in the database of the Critical Research Support Center at Mie University Hospital via the Internet from each institution. This study was registered in the UMIN Clinical Trials Registry (registration ID number: UMIN000008128).
Statistical Analysis
Patients were divided into 3 groups according to AVA index tertile: group 1, highest tertile; group 2, middle tertile; and group 3, lowest tertile. The normally distributed data, non-normally distributed data, and categorical data are summarized for all patients and each group as mean±SD, median (IQR), or percentage. In order to assess differences between the 3 groups, 1-way analysis of variance (ANOVA) with Bonferroni post-hoc analysis was performed for clinical and laboratory data. Kruskal-Wallis test and Pearson’s chi-squared test for non-normally distributed data and categorical data, respectively were also performed. We evaluated the univariate analysis using correlation coefficients of AVA index and E/E’Ave. Furthermore, to determine independent predictors of AVA index and E/E’Ave, multiple linear stepwise forward selection was performed. Age, gender and other all univariate variables with P<0.1 were added to the model in the stepwise regression. P<0.05 was accepted as significant. Analyses were performed using SPSS for Windows, version 17 (SPSS, Chicago, IL, USA) and R version 3.4.1 (free software environment).
Results
Patient Characteristics
Table 1
lists the patient characteristics and
Figure 1B
shows the distribution of patient age and AVA. Among all 315 patients, mean age was 67.9±10.6 years, 47.6% were male and the median duration of HD was 76 months (IQR, 35–147 months). A total of 23 patients (7.3%) had AF. AVA index range was follows: group 1 (n=105), AVA index ≥1.51 cm2/m2; group 2 (n=105), AVA index <1.51 cm2/m2
and ≥1.16 cm2/m2; and group 3 (n=105), AVA index <1.16 cm2/m2. Group 3 was older than the other 2 groups but the gender and duration of HD were not significantly different between the 3 groups. Cardiothoracic ratio was greater in group 3 than in the other 2 groups. Pre-dialysis vital signs and vascular access were similar in the 3 groups. Etiology of ESRD, coexisting disorders including AF and medications were also similar between the 3 groups except for history of cerebral vascular disorder and prescription rate of calcium carbonate.
Table 2
lists the laboratory data. Group 3 had higher plasma BNP than the other 2 groups. Intact parathyroid hormone (PTH) was not significantly different between the 3 groups.
Table 1.
Subject Clinical Characteristics
| |
Whole group
(n=315) |
Group 1
AVAI ≥1.51
(n=105) |
Group 2
1.51>AVAI≥1.16
(n=105) |
Group 3
AVAI <1.16
(n=105) |
P-value |
| General characteristics |
| Age (years) |
67.9±10.6 |
66.1±9.6 |
66.7±11.5 |
70.9±9.9*,** |
<0.01 |
| Male† |
47.6 |
46.7 |
41.0 |
55.2 |
0.113 |
| Duration of hemodialysis (months)‡ |
76 (35–147) |
66 (32–161) |
75 (34–132) |
90 (41–156) |
0.245 |
| Height (cm) |
158±8.6 |
158±8.1 |
157±8.4 |
159±9.2 |
0.114 |
| Weight (kg) |
53.6±11.2 |
53.8±10.7 |
52.3±11.4 |
54.6±11.4 |
0.345 |
| Pre-dialysis SBP (mmHg) |
150±23 |
151±24 |
149±21 |
150±23 |
0.751 |
| Pre-dialysis DBP (mmHg) |
79±14 |
80±13 |
77±14 |
79±15 |
0.237 |
| Pre-dialysis heart rate (beats/min) |
73±123 |
72±12 |
72±11 |
74±15 |
0.628 |
| CTR on chest X ray (%) |
51.0±5.1 |
49.5±4.0 |
50.6±5.4 |
52.7±5.3*,** |
<0.001 |
| Vascular access† |
|
|
|
|
0.199 |
| AVF |
84.1 |
85.7 |
86.7 |
80.8 |
|
| AVG |
14.6 |
11.4 |
13.3 |
19.2 |
|
| Catheter |
0.6 |
1.9 |
0 |
0 |
|
| Subcutaneously fixed superficial artery |
0.3 |
1.0 |
0 |
0 |
|
| Etiology |
| Diabetic nephropathy† |
41.0 |
40.0 |
41.0 |
41.9 |
0.961 |
| Chronic glomerulopathy† |
40.6 |
40.0 |
41.9 |
39.4 |
0.843 |
| Renal sclerosis† |
6.0 |
6.7 |
4.8 |
6.7 |
0.799 |
| Others† |
12.4 |
13.3 |
11.4 |
12.4 |
0.916 |
| Coexistence |
| Hypertension† |
81.6 |
80.0 |
81.9 |
82.9 |
0.862 |
| Diabetes mellitus† |
43.5 |
41.0 |
43.8 |
45.7 |
0.782 |
| Dyslipidemia† |
16.8 |
15.2 |
12.4 |
22.9 |
0.111 |
| Current smoker† |
10.5 |
8.6 |
14.3 |
8.6 |
0.296 |
| History of IHD† |
19.4 |
15.2 |
18.1 |
24.8 |
0.201 |
| History of CVD† |
19.7 |
21.9 |
11.4 |
25.7** |
<0.05 |
| Atrial fibrillation† |
7.3 |
4.8 |
4.8 |
12.4 |
0.050 |
| Medicine |
| ACEI† |
6.3 |
6.7 |
7.7 |
4.8 |
0.679 |
| ARB† |
55.9 |
60.0 |
59.6 |
48.6 |
0.166 |
| CCB† |
59.4 |
61.9 |
56.2 |
60.0 |
0.734 |
| β-blocker† |
21.9 |
18.1 |
26.9 |
21.0 |
0.291 |
| Statin† |
16.5 |
15.2 |
13.5 |
21.0 |
0.313 |
| Antiplatelet† |
48.9 |
43.8 |
46.2 |
57.1 |
0.119 |
| Calcium carbonate† |
62.2 |
71.4 |
54.8* |
61.0 |
<0.05 |
| Cinacalcet† |
17.5 |
18.1 |
14.4 |
20.0 |
0.560 |
| Vitamin D† |
56.2 |
57.1 |
58.7 |
53.3 |
0.726 |
| Erythropoietin† |
79.7 |
74.3 |
82.7 |
82.9 |
0.208 |
Data given as mean±SD, median (IQR) or %. †P values were calculated with Pearson’s chi-square test. ‡P values were calculated with Kruskal-Wallis test. *P<0.05 between Group1 and Group 2 or Group 3 in post-hoc multiple comparison tests. **P<0.05 between Group2 and Group 3 in post-hoc multiple comparison tests. ACEI, angiotensin-converting enzyme inhibitor; ARB, angiotensin receptor blocker; AVAI, aortic valve area index; AVF, arteriovenous fistula; AVG, arteriovenous graft; CCB, calcium channel blocker; CTR, cardiothoracic ratio; CVD, cerebral vascular disorder; DBP, diastolic blood pressure; IHD, ischemic heart disease; SBP, systolic blood pressure.
Table 2.
Laboratory Data
| |
Whole group
(n=315) |
Group 1
AVAI ≥1.51
(n=105) |
Group 2
1.51>AVAI≥1.16
(n=105) |
Group 3
AVAI <1.16
(n=105) |
P-value |
| Laboratory data |
| Hb (g/dL) |
10.9±1.1 |
11.1±1.1 |
10.7±1.1 |
10.8±1.2 |
0.111 |
| Albumin (g/dL) |
3.7±0.4 |
3.7±0.4 |
3.7±0.3 |
3.6±0.4 |
0.073 |
| Calcium (mg/dL) |
9.3±0.8 |
9.3±0.9 |
9.2±0.8 |
9.4±0.9 |
0.383 |
| Phosphate (mg/dL) |
5.4±1.4 |
5.5±1.4 |
5.4±1.5 |
5.4±1.4 |
0.556 |
| PTH (pg/mL)† |
119 (64–208) |
110 (55–184) |
114 (72–220) |
128 (59–215) |
0.655 |
| Log10PTH |
2.02±0.41 |
1.97±0.44 |
2.06±0.40 |
2.02±0.40 |
0.323 |
| TC (mg/dL) |
160±33 |
162±36 |
159±33 |
157±30 |
0.575 |
| HDL-C (mg/dL) |
50±15.4 |
51±15 |
50±15 |
50±16 |
0.886 |
| LDL-C (mg/dL) |
89±27.1 |
91±28 |
90±30 |
87±23 |
0.415 |
| Triglyceride (mg/dL) |
99±51 |
102±46 |
96±55 |
98±51 |
0.674 |
| CRP (mg/dL)† |
0.13 (0.05–0.47) |
0.09 (0.05–0.38) |
0.12 (0.05–0.35) |
0.18 (0.06–0.64) |
0.105 |
| BNP (pg/mL)† |
226 (115–513) |
186 (93–378) |
207 (115–522) |
332*,** (171–703) |
<0.01 |
| Log10BNP |
2.36±0.46 |
2.26±0.42 |
2.32±0.46 |
2.50±0.48*,** |
<0.01 |
| ANP (pg/mL)† |
95 (57–166) |
85 (54–145) |
96 (59–171) |
104 (53–185) |
0.245 |
| Log10ANP |
1.97±0.33 |
1.94±0.32 |
1.99±0.34 |
1.99±0.34 |
0.432 |
Data given as mean±SD or median (IQR). †P values were calculated with Kruskal-Wallis test. *P<0.05 between Group1 and Group 2 or Group 3 in post-hoc multiple comparison tests. **P<0.05 between Group2 and Group 3 in post-hoc multiple comparison tests. ANP, atrial natriuretic peptide; AVAI, aortic valve area index; BNP, brain natriuretic peptide; CRP, C-reactive protein; Hb, hemoglobin; HDL-C, high-density lipoprotein cholesterol; LDL-C, low-density lipoprotein cholesterol; PTH, parathyroid hormone; TC, total cholesterol.
Classification of LV geometry and LVEF, LV filling pattern, and the prevalence and severity of aortic valve narrowing in all 315 patients are given in
Figure 2. The majority of patients (88.5%) had abnormal LV geometry, and LVH was present in 66.3% of patients: 51.3% with concentric hypertrophy and 15.0% with eccentric hypertrophy. In addition, the vast majority of patients had some degree of abnormal filling pattern or AF, whereas most of the patients had preserved LVEF. Approximately half of the patients on chronic HD had AVA <2.0 cm2
(n=158) in the full cohort; 14 (4.4%) had AVA <1.0 cm2; 46 (14.6%), 1.0≤AVA<1.5 cm2; and 98 (31.1%), 1.5≤AVA<2.0 cm2.
Figure 3
shows the relationship between AVA and MPG across the aortic valve in all participants. AVA=1 cm2
corresponds to an MPG of approximately 21.4 mmHg on the fitted curve, and 13 of 14 patients with AVA <1.0 cm2
had MPG across the aortic valve <40 mmHg. Mean LVOT diameter, SVI and LVEF in these 13 patients were 18.6±2.0 mm (20.0±2.4 mm in all 315 patients), 33.4±11.1 mL/m2
(45.3±13.8 mL/m2
in all 315 patients) and 58.9±12.9% (62.8±10.8% in all 315 patients), respectively, and 8 patients had low SVI <35 mL/m2
with preserved LVEF (≥50%). This indicates that the majority of these patients had paradoxical low-flow low-gradient severe AS despite preserved LVEF.
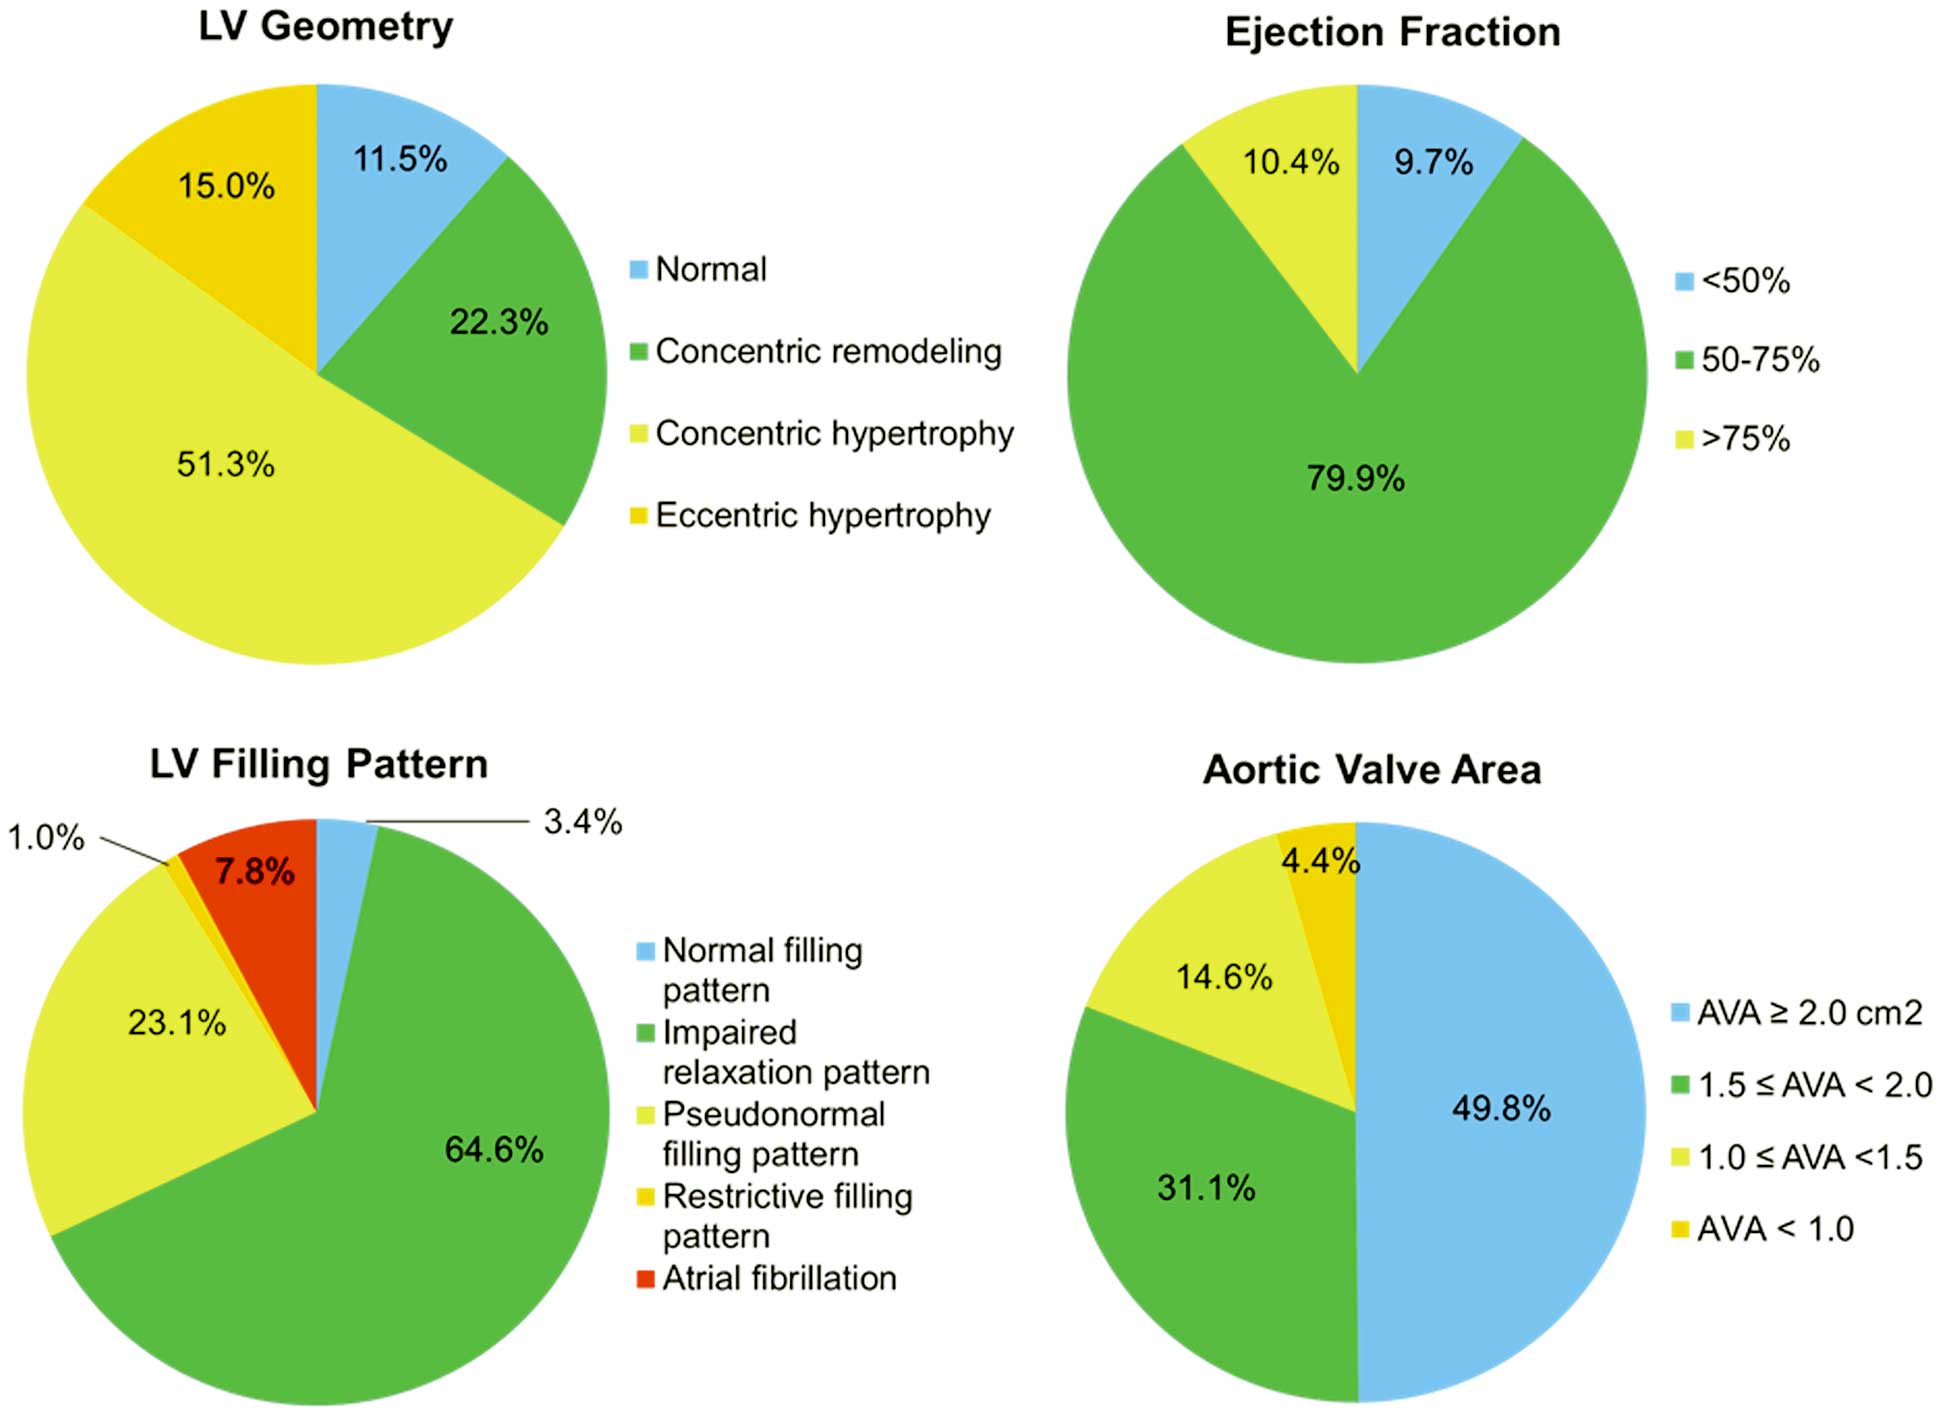
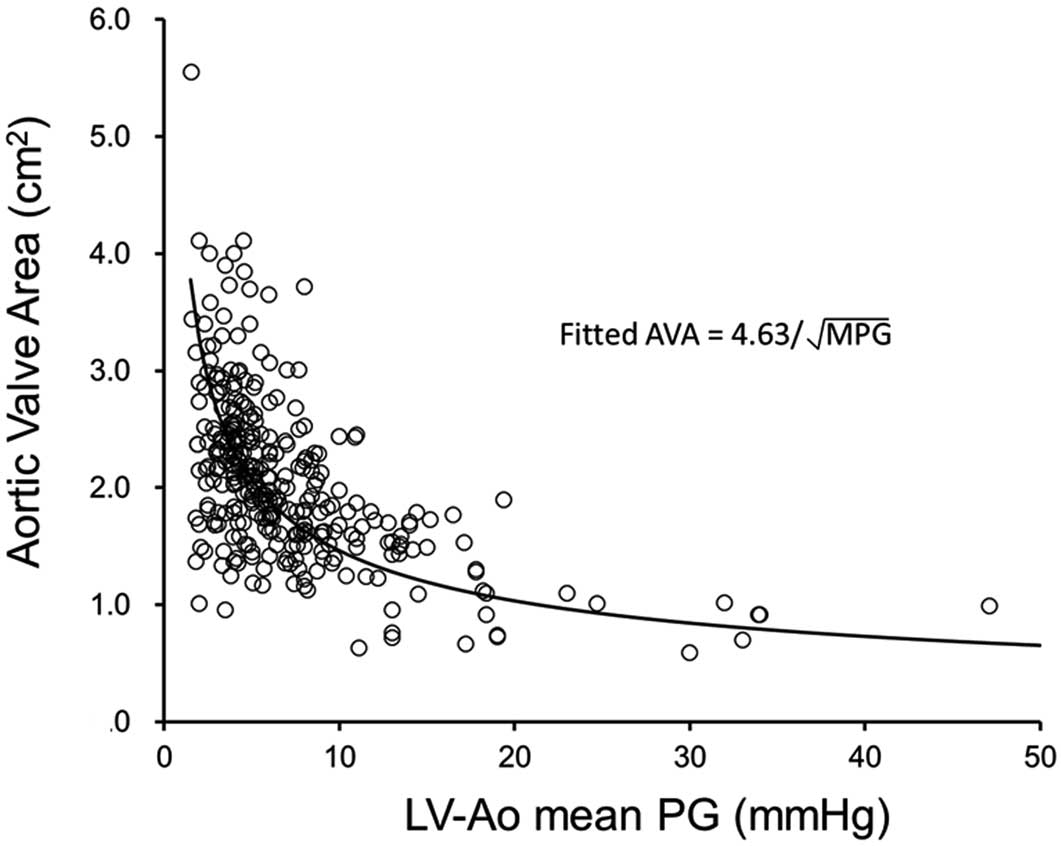
Table 3
lists the echocardiographic data. Group 2 had greater LAD index, LVDd and LVDs than group 1, and group 3 had greater LVDs and LV fractional shortening than group 1. Although LVEF was not significantly different between the 3 groups, group 3 had significantly lower SV index than the other 2 groups. LV mass index was higher in group 3 than in group 1. Groups 2 and 3 had significantly higher E wave and E/E’ than group 1. Of all 315 patients, 76.5% had aortic valve calcification, and it was much more frequently present in group 3 than in the other 2 groups. LVOT diameter was smaller in group 2 than in group 1, and was the smallest in group 3. Both MPG across the aortic valve and ZVA, a measure of global LV afterload, were highest in group 3. Among all 315 patients, 58.4% had MAC, and its prevalence was higher in group 3 than in group 1. MVA index was lower in groups 2 and 3 than in group 1. IVC diameter was greater in group 3 than in the other 2 groups. There were very few patients with severe MR (n=4) or severe AR (n=1) among all 315 patients.
Table 3.
Echocardiographic Data
| |
Whole group
(n=315) |
Group 1
AVAI ≥1.51
(n=105) |
Group 2
1.51>AVAI≥1.16
(n=105) |
Group 3
AVAI <1.16
(n=105) |
P-value |
| LA diameter index (mm/m2) |
24.5±4.4 |
23.4±4.0 |
25.2±4.5* |
24.8±4.6 |
<0.01 |
| LVDd (mm) |
45.6±6.6 |
44.0±5.2 |
46.5±7.0* |
46.1±7.3 |
<0.05 |
| LVDs (mm) |
29.8±7.0 |
28.0±4.8 |
30.7±7.5* |
30.7±8.0* |
<0.01 |
| Fractional shortening (%) |
35.0±8.1 |
36.7±7.1 |
34.3±8.2 |
34.0±8.9* |
<0.05 |
| LVEF (%) |
62.8±10.8 |
64.8±9.4 |
62.1±10.4 |
61.5±12.3 |
0.071 |
| SVI (mL/m2) |
45.3±13.8 |
50.1±13.8 |
46.7±11.8 |
39.1±13.5*,** |
<0.001 |
| LVMI (g/m2) |
114±38 |
107±32 |
113±37 |
122±43* |
<0.05 |
| E wave (cm/s) |
69.7±24.8 |
59.7±18.0 |
73.0±24.2* |
76.3±28.2* |
<0.001 |
| Dec T (s) |
239±83 |
242±76 |
238±83 |
235±91 |
0.844 |
| Septal E’ (cm/s) |
5.0±1.5 |
4.9±1.4 |
4.9±1.4 |
5.2±1.6 |
0.175 |
| Lateral E’ (cm/s) |
7.1±2.2 |
7.1±2.1 |
7.1±2.1 |
7.2±2.5 |
0.978 |
| E/E’Ave |
12.0±4.9 |
10.4±3.8 |
12.8±4.9* |
12.9±5.5* |
<0.001 |
| Aortic valve calcification† |
76.5 |
67.6 |
70.5 |
91.4*,** |
<0.001 |
| One leaflet† |
19.7 |
27.6 |
18.1 |
13.3* |
<0.05 |
| Two leaflets† |
22.5 |
21.0 |
24.8 |
21.9 |
0.789 |
| All leaflets† |
34.3 |
19.0 |
27.6 |
56.2*,** |
<0.001 |
| LVOT diameter (mm) |
20.0±2.4 |
20.8±2.3 |
20.0±2.0* |
19.2±2.4*,** |
<0.001 |
| AVA (cm2) |
2.07±0.70 |
2.79±0.58 |
2.00±0.29* |
1.41±0.35*,** |
<0.001 |
| AVAI (cm2/m2) |
1.36±0.42 |
1.82±0.28 |
1.33±0.10* |
0.92±0.20*,** |
<0.001 |
| LV-Ao MPG (mmHg) |
7.1±5.6 |
4.2±1.6 |
6.4±3.0* |
10.6±7.9*,** |
<0.001 |
| ZVA (mmHg/mL/m2) |
3.6±1.4 |
3.2±0.9 |
3.4±1.0 |
4.3±1.8*,** |
<0.001 |
| MAC† |
58.4 |
47.6 |
60.0 |
67.6* |
<0.05 |
| Anterior annulus |
28.3 |
18.1 |
28.6 |
38.1* |
<0.01 |
| Posterior annulus |
53.0 |
41.0 |
56.2 |
61.9* |
<0.01 |
| Both annuli |
22.9 |
11.4 |
24.8 |
32.4* |
<0.01 |
| MVA (cm2) |
2.86±1.38 |
3.27±1.32 |
2.80±1.11* |
2.49±1.26* |
<0.001 |
| MVAI (cm2/m2) |
1.87±0.85 |
2.16±0.90 |
1.87±0.73* |
1.62±0.80* |
<0.001 |
| IVC (mm) |
12.6±3.5 |
12.2±3.7 |
12.2±3.2 |
13.4±3.6*,** |
<0.05 |
Data given as mean±SD or %. †P values were calculated with Pearson’s chi-square test. *P<0.05 between Group1 and Group 2 or Group 3 in post-hoc multiple comparison tests. **P<0.05 between Group2 and Group 3 in post-hoc multiple comparison tests. E/E’Ave=E/{(septal E’+lateral E’)/2}. Ao, aorta; AVA, aortic valve area; AVAI, AVA index; Dec T, deceleration time; IVC, inferior vena cava; LA, left atrium; LV, left ventricle; LVDd, left ventricular end-diastolic; LVDs, left ventricular end-systolic; LVEF, left ventricular ejection fraction; LVMI, left ventricular mass index; MAC, mitral annular calcification; MPG, mean pressure gradient; MVA, mitral valve area; MVAI, MVA index; SVI, stroke volume index; ZVA, valvuloarterial impedance.
Of the cardiac parameters, there was a significant correlation between E/E’ and AVA index, LV mass index and AVA index, and log10BNP and AVA index (Figure S1). In addition, there were weak relationships between AVA index and various non-cardiac parameters including log10PTH on univariate analysis; and on multivariate linear regression analysis, age and log10PTH were negatively and independently associated with aortic valve narrowing (Table 4;
Figure S1).
Table 4.
Indicators of Aortic Valve Narrowing
| |
Univariate |
Multivariate |
| Coefficients |
P-value |
β |
P-value |
| Age |
−0.196 |
0.000 |
−0.197 |
0.001 |
| Male gender |
0.110 |
0.059 |
|
|
| Hemodialysis duration |
−0.031 |
0.589 |
|
|
| SBP |
−0.039 |
0.488 |
|
|
| ARB |
−0.112 |
0.047 |
|
|
| Antiplatelet |
0.107 |
0.059 |
|
|
| Calcium carbonate |
−0.100 |
0.076 |
|
|
| Cinacalcet |
−0.015 |
0.785 |
|
|
| Hb |
0.063 |
0.261 |
|
|
| Albumin |
−0.110 |
0.047 |
|
|
| Calcium |
−0.039 |
0.488 |
|
|
| Phosphate |
0.107 |
0.059 |
|
|
| Log10PTH |
−0.116 |
0.041 |
−0.160 |
0.007 |
| CRP |
−0.059 |
0.305 |
|
|
Abbreiations as in Tables 1,2.
On multivariate linear stepwise regression analysis, AVA index was the strongest contributor to E/E’Ave
independently of potential confounders including age, SBP, hemoglobin concentration, serum CRP, plasm BNP, LV mass index, MAC and ZVA
(Table 5). In contrast, when patients with MAC were excluded, AVA index was not independently associated with E/E’Ave
(Table S1).
Table 5.
Indicators of E/E’
Ave
| |
Univariate |
Multivariate |
| Coefficients |
P-value |
β |
P-value |
| Age |
0.152 |
0.009 |
|
|
| Male gender |
−0.046 |
0.448 |
|
|
| Hemodialysis duration |
0.016 |
0.780 |
|
|
| SBP |
0.209 |
0.000 |
|
|
| Hypertension |
−0.011 |
0.852 |
|
|
| Diabetes mellitus |
−0.037 |
0.544 |
|
|
| Atrial fibrillation |
0.050 |
0.395 |
|
|
| Hb |
−0.165 |
0.005 |
−0.116 |
0.047 |
| Albumin |
−0.067 |
0.254 |
|
|
| Calcium |
0.002 |
0.978 |
|
|
| Phosphate |
−0.030 |
0.606 |
|
|
| Log10PTH |
0.048 |
0.413 |
|
|
| CRP |
−0.105 |
0.077 |
|
|
| Log10BNP |
0.286 |
0.000 |
0.164 |
0.008 |
| Log10ANP |
0.149 |
0.012 |
|
|
| LV mass index |
0.329 |
0.000 |
0.250 |
0.000 |
| AVA index |
−0.253 |
0.000 |
−0.211 |
0.000 |
| MAC |
0.220 |
0.000 |
|
|
| ZVA |
0.017 |
0.776 |
|
|
E, early diastolic transmitral flow velocity; E’, early diastolic annular velocity; E/E’Ave, ratio of mitral E to septal and lateral E’ as well as to average (septal and lateral) E’; LV, left ventricular. Other abbreiations as in Tables 2–4.
Discussion
This preliminary report from the MIE-CARE HD Study has provided the baseline echocardiographic characteristics of ESRD patients on chronic HD. These patients had an extraordinarily high prevalence of structural abnormalities of the heart including calcified valvular sclerosis, LV remodeling and diastolic dysfunction. The present study has further demonstrated that patients with lower AVA index had much more severe echocardiographic evidence of LV overload and remodeling than those without it.
In the present study, 88.5% of patients had some degree of abnormal LV geometry. Concentric LV geometry is a natural pattern in ESRD,15
and concentric LVH characterizes more severe impairment of the cardiovascular system. Wang et al showed that 49% and 13% had concentric or eccentric LVH with LV mass index >46.7 g/m2.7
in women and >49.2 g/m2.7
in men, and 12% had concentric remodeling in 98 ESRD patients on HD and with preserved LVEF ≥50%,16
when this was calculated using the formula proposed by Devereux et al.17
Similarly, 51.3% and 15.0% of patients had concentric and eccentric LVH, and 22.3% of patients had concentric remodeling in the present study, although the methodology for measuring LV mass index and the cut-off points for defining LVH differed.
Patients with ESRD on HD have a high incidence of LV diastolic dysfunction. Farshid et al showed that some degree of diastolic dysfunction was present in 86% of patients on HD with a mean age of 58.7±15.0 years, and 35% had grade ≥2 diastolic dysfunction, which was a powerful independent predictor of mortality.18
In the present study, almost all patients (i.e., those with mean age, 67.9±10.6 years) had some degree of abnormal LV filling or AF.
Valvular calcification plays a key role in the development of valvular stenosis. A series of population-based studies have demonstrated a high prevalence of aortic valve calcification in patients on chronic HD.19–21
The degree of valvular calcification correlates with the severity of aortic valve narrowing, disease progression, and the development of symptoms and adverse events.22–25
The prevalence and severity of aortic valve narrowing in patients on HD, however, have not been fully evaluated. In the present study approximately half of the patients had aortic valve narrowing <2.0 cm2. Severe AS has been observed in 6–13% of subjects undergoing HD.21
In the present study, AVA <1.0 cm2
was found in 4.4% of patients. The relationship between MPG and AVA observed in the present study is in line with a previous study on a much larger population without HD. In the present study, an AVA of 1 cm2
corresponded to an MPG of approximately 21.4 mmHg on the fitted curve, which is consistent with previous studies.26
Interestingly, the majority of patients with AVA <1.0 cm2
and MPG <40 mmHg had paradoxical low-flow low-gradient severe AS, despite preserved LVEF.
The present study further found that of the non-cardiac parameters, log10PTH was negatively and independently associated with aortic valve narrowing over a wide range of AVA index, based on 315 Japanese patients on chronic HD, while the vast majority of patients had PTH below the upper limit of the target range. Similarly, Iwata et al showed that PTH and SBP were independently associated with progression of AS in 34 Japanese patients with asymptomatic AS receiving HD (mild in 9, moderate in 20, severe in 5, with overall mean AVA 1.31±0.31 cm2
and mean age, 69±8 years).27
Meanwhile, the weak relationship between AVA index and log10PTH may indicate that aortic sclerosis is a complex and multifactorial process caused by the interaction of environmental and genetic factors and hemodynamic-related factors.
Aortic valve narrowing causes an increase in LV wall stress that stimulates hypertrophy of the LV myocardium.25
Patients with AS, however, have marked variation in the magnitude of their hypertrophic response, and the degree of LV hypertrophy is only weakly related to the severity of aortic valve narrowing.25,28–30
This was first established on echocardiography, but has recently been confirmed using cardiac magnetic resonance imaging, on which no correlation between peak aortic valve velocity and LV mass index was observed.31
In the present study, patients in the lowest AVA index tertile (AVA index <1.16 cm2) had a mild but significantly greater LV mass index than those in the highest tertile. Systemic arterial compliance also has an impact on LV mass index even in the presence of severe AS.32
Patients in the lowest AVA index tertile had greater ZVA
than those in the other 2 tertiles.
Patients in the lower 2 AVA index tertiles (AVA index <1.51 cm2) had higher E wave and higher E/E’ than those in the highest tertile. In addition, patients in the lowest AVA index tertile had higher plasma BNP than those in the other 2 tertiles. This may indicate that aortic valve narrowing is associated with higher LV diastolic filling pressure. Notably, AVA index was identified as the strongest determinant of E/E’. E’, an echocardiographic index of LV relaxation, was similar in the 3 AVA index tertiles, therefore the high LV diastolic filling pressure could be at least partially due to increases in LV stiffness. Given that ZVA
was not independently associated with E/E’, afterload-independent stimuli that underlie the progression of aortic sclerosis can induce myocardial damage and fibrosis, which could increase the LV stiffness in patients on chronic HD. As with fibrosis in the valve, the renin-angiotensin system, transforming growth factor-β, and an imbalance in matrix metalloproteinase and tissue inhibitor of matrix metalloproteinase activity have all been implicated in the process of fibrosis of the LV.25,33,34
Losi et al showed that myocardial fibrosis assessed using integrated backscatter signal but not LV mass index was independently associated with the presence of pseudonormal and restrictive patterns in 25 patients with ESRD undergoing HD.5
This may suggest that LV fibrosis plays a central role in the development of LV diastolic dysfunction and the elevation of LV filling pressure in patients with ESRD on chronic HD. Importantly, MAC has been shown to affect mitral annular velocity and therefore may influence the assessment of a causal relationship between aortic valve narrowing and E/E’.35
Indeed, AVA index was not independently associated with E/E’Ave
when patients with MAC were excluded.
Study Limitations
The estimated participation rate was relatively low mainly because the present study enrolled only patients who were receiving HD in the morning, and this selection bias may also have influenced the age and gender distribution. Patient symptoms were not assessed in the present study. Echocardiographic parameters were not compared between control subjects and patients with ESRD on HD to investigate the effect of ESRD and/or HD on the presence and severity of sclerotic change in aortic valve, mainly because it is difficult to select multiple-matched specific characteristics of control subjects, such as age, gender and coexisting disorders and medications. Three-dimensional measurements of LVOT and AVA were not used in the present study. Doppler-derived estimation of AVA using 2-D transthoracic echocardiography, however, is considered to correlate well with simultaneous catheter-derived measurements, and is still widely used clinically.7,12
Several important echocardiography-derived parameters including LV strain, LA volume, right ventricular structures and function were not assessed. The potential influence of sigmoid septum and LVOT obstruction on the accuracy of AVA calculation was not assessed.36
I.v. volume status and LV loading conditions are altered by HD, therefore the LV chamber volume and indices of systolic and diastolic function can differ between before and after HD.37
Conclusions
Patients with ESRD on chronic HD have a high prevalence of cardiac structural and functional abnormalities including calcified valvular sclerosis. The prevalence of AS was as high as 50%, and aortic valve narrowing can adversely influence LV diastolic performance.
Acknowledgments
This work was funded in part by Suzuken Memorial Foundation, Japan (to K.D.). We are grateful to Mayumi Furlong, Haruka Sakaguchi, Sachiko Mizoguchi, Hideki Kawarada, Takahiro Nakayama, Yuki Noda, Mayumi Ichikawa, Yoshiki Yasuda, Yoshitaka Kakiuchi, Yoshihiko Kitagawa, Michiyo Ichinari, Noriko Yamamoto, Shohei Matsuyama, Yuko Yasuda, Mika Sakamoto, Ai Sato, Sumio Inoue, Kazuho Ookawa, Marika Hara, Yoshimi Hamanaka, Keiko Nakashiba, Takako Aiga, Tomoya Ootani, Yutaka Hayashi, Yoshiteru Fukumoto, and Koji Yamamoto for assistance.
Disclosures
K.D. received lecture fees ≥500,000 yen from Otsuka Pharma in 2016. T.T. received lecture fees ≥500,000 yen from Kaneka Medix in 2016. S.N. received lecture fees ≥500,000 yen from Otsuka Pharma in 2016. M.I. received lecture fees ≥500,000 yen from Bayer Yakuhin, Daiichi Sankyo and Mitsubishi Tanabe Pharma in 2016. The Department of Cardiology and Nephrology, Mie University Graduate School of Medicine was supported in part by unrestricted research grants ≥1,000,000 yen from Daiichi Sankyo, Shionogi, Sumitomo Dainippon Pharma, MSD, Astellas Pharma, Takeda Pharmaceutical and Pfizer Japan in 2016. The Division of Hemodialysis Center, Mie University Hospital was supported in part by unrestricted research grants of >1,000,000 yen from Sanwa Kagaku Kenkyusho in 2016. The other authors declare no conflict of interest.
Supplementary Files
Supplementary File 1
Figure S1.
Relationship of aortic valve area index to E/E’Ave, left ventricular mass index, log10brain natriuretic peptide (log10BNP) and log10parathyroid hormone (log10PTH).
Table S1.
Indicators of E/E’Ave
excluding MV calcification
Please find supplementary file(s);
http://dx.doi.org/10.1253/circj.CJ-17-0393
References
- 1.
Michel PL. Aortic stenosis in chronic renal failure patients treated by dialysis. Nephrol Dial Transplant 1998; 13(Suppl 4): 44–48.
- 2.
Ohara T, Hashimoto Y, Matsumura A, Suzuki M, Isobe M. Accelerated progression and morbidity in patients with aortic stenosis on chronic dialysis. Circ J 2005; 69: 1535–1539.
- 3.
Chan CT, Greene T, Chertow GM, Kliger AS, Stokes JB, Beck GJ, et al. Effects of frequent hemodialysis on ventricular volumes and left ventricular remodeling. Clin J Am Soc Nephrol 2013; 8: 2106–2116.
- 4.
Chan CT, Greene T, Chertow GM, Kliger AS, Stokes JB, Beck GJ, et al. Determinants of left ventricular mass in patients on hemodialysis: Frequent Hemodialysis Network (FHN) Trials. Circ Cardiovasc Imaging 2012; 5: 251–261.
- 5.
Losi MA, Memoli B, Contaldi C, Barbati G, Del Prete M, Betocchi S, et al. Myocardial fibrosis and diastolic dysfunction in patients on chronic haemodialysis. Nephrol Dial Transplant 2010; 25: 1950–1954.
- 6.
Quinones MA, Otto CM, Stoddard M, Waggoner A, Zoghbi WA. Recommendations for quantification of Doppler echocardiography: A report from the Doppler Quantification Task Force of the Nomenclature and Standards Committee of the American Society of Echocardiography. J Am Soc Echocardiogr 2002; 15: 167–184.
- 7.
Masuda C, Dohi K, Sakurai Y, Bessho Y, Fukuda H, Fujii S, et al. Impact of chronic kidney disease on the presence and severity of aortic stenosis in patients at high risk for coronary artery disease. Cardiovasc Ultrasound 2011; 9: 31.
- 8.
Lang RM, Badano LP, Mor-Avi V, Afilalo J, Armstrong A, Ernande L, et al. Recommendations for cardiac chamber quantification by echocardiography in adults: An update from the American Society of Echocardiography and the European Association of Cardiovascular Imaging. J Am Soc Echocardiogr 2015; 28: 1–39.e14.
- 9.
Nagueh SF, Appleton CP, Gillebert TC, Marino PN, Oh JK, Smiseth OA, et al. Recommendations for the evaluation of left ventricular diastolic function by echocardiography. J Am Soc Echocardiogr 2009; 22: 107–133.
- 10.
Ventura JE, Tavella N, Romero C, Petraglia A, Báez A, Muñoz L. Aortic valve calcification is an independent factor of left ventricular hypertrophy in patients on maintenance haemodialysis. Nephrol Dial Transplant 2002; 17: 1795–1801.
- 11.
Kizer JR, Wiebers DO, Whisnant JP, Galloway JM, Welty TK, Lee ET, et al. Mitral annular calcification, aortic valve sclerosis, and incident stroke in adults free of clinical cardiovascular disease: The Strong Heart Study. Stroke 2005; 36: 2533–2537.
- 12.
Baumgartner H, Hung J, Bermejo J, Chambers JB, Evangelista A, Griffin BP, et al. Echocardiographic assessment of valve stenosis: EAE/ASE recommendations for clinical practice. J Am Soc Echocardiogr 2009; 22: 1–23; quiz 101–102.
- 13.
Hachicha Z, Dumesnil JG, Bogaty P, Pibarot P. Paradoxical low-flow, low-gradient severe aortic stenosis despite preserved ejection fraction is associated with higher afterload and reduced survival. Circulation 2007; 115: 2856–2864.
- 14.
Magne J, Mohty D, Boulogne C, Deltreuil M, Cassat C, Echahidi N, et al. Prognostic impact of global left ventricular hemodynamic afterload in severe aortic stenosis with preserved ejection fraction. Int J Cardiol 2015; 180: 158–164.
- 15.
de Simone G. Left ventricular geometry and hypotension in end-stage renal disease: A mechanical perspective. J Am Soc Nephrol 2003; 14: 2421–2427.
- 16.
Wang H, Liu J, Yao XD, Li J, Yang Y, Cao TS, et al. Multidirectional myocardial systolic function in hemodialysis patients with preserved left ventricular ejection fraction and different left ventricular geometry. Nephrol Dial Transplant 2012; 27: 4422–4429.
- 17.
Devereux RB, Alonso DR, Lutas EM, Gottlieb GJ, Campo E, Sachs I, et al. Echocardiographic assessment of left ventricular hypertrophy: Comparison to necropsy findings. Am J Cardiol 1986; 57: 450–458.
- 18.
Farshid A, Pathak R, Shadbolt B, Arnolda L, Talaulikar G. Diastolic function is a strong predictor of mortality in patients with chronic kidney disease. BMC Nephrol 2013; 14: 280.
- 19.
Maher ER, Young G, Smyth-Walsh B, Pugh S, Curtis JR. Aortic and mitral valve calcification in patients with end-stage renal disease. Lancet 1987; 2: 875–877.
- 20.
Ribeiro S, Ramos A, Brandão A, Rebelo JR, Guerra A, Resina C, et al. Cardiac valve calcification in haemodialysis patients: Role of calcium-phosphate metabolism. Nephrol Dial Transplant 1998; 13: 2037–2040.
- 21.
Rattazzi M, Bertacco E, Del Vecchio A, Puato M, Faggin E, Pauletto P. Aortic valve calcification in chronic kidney disease. Nephrol Dial Transplant 2013; 28: 2968–2976.
- 22.
Cowell SJ, Newby DE, Burton J, White A, Northridge DB, Boon NA, et al. Aortic valve calcification on computed tomography predicts the severity of aortic stenosis. Clin Radiol 2003; 58: 712–716.
- 23.
Davies SW, Gershlick AH, Balcon R. Progression of valvar aortic stenosis: A long-term retrospective study. Eur Heart J 1991; 12: 10–14.
- 24.
Rosenhek R, Binder T, Porenta G, Lang I, Christ G, Schemper M, et al. Predictors of outcome in severe, asymptomatic aortic stenosis. N Engl J Med 2000; 343: 611–617.
- 25.
Dweck MR, Boon NA, Newby DE. Calcific aortic stenosis: A disease of the valve and the myocardium. J Am Coll Cardiol 2012; 60: 1854–1863.
- 26.
Minners J, Allgeier M, Gohlke-Baerwolf C, Kienzle RP, Neumann FJ, Jander N. Inconsistencies of echocardiographic criteria for the grading of aortic valve stenosis. Eur Heart J 2008; 29: 1043–1048.
- 27.
Iwata S, Hyodo E, Yanagi S, Hayashi Y, Nishiyama H, Kamimori K, et al. Parathyroid hormone and systolic blood pressure accelerate the progression of aortic valve stenosis in chronic hemodialysis patients. Int J Cardiol 2013; 163: 256–259.
- 28.
Salcedo EE, Korzick DH, Currie PJ, Stewart WJ, Lever HM, Goormastic M. Determinants of left ventricular hypertrophy in patients with aortic stenosis. Cleve Clin J Med 1989; 56: 590–596.
- 29.
Kupari M, Turto H, Lommi J. Left ventricular hypertrophy in aortic valve stenosis: Preventive or promotive of systolic dysfunction and heart failure? Eur Heart J 2005; 26: 1790–1796.
- 30.
Gunther S, Grossman W. Determinants of ventricular function in pressure-overload hypertrophy in man. Circulation 1979; 59: 679–688.
- 31.
Dweck MR, Joshi S, Murigu T, Gulati A, Alpendurada F, Jabbour A, et al. Left ventricular remodeling and hypertrophy in patients with aortic stenosis: Insights from cardiovascular magnetic resonance. J Cardiovasc Magn Reson 2012; 14: 50.
- 32.
Briand M, Dumesnil JG, Kadem L, Tongue AG, Rieu R, Garcia D, et al. Reduced systemic arterial compliance impacts significantly on left ventricular afterload and function in aortic stenosis: Implications for diagnosis and treatment. J Am Coll Cardiol 2005; 46: 291–298.
- 33.
Lindsay MM, Maxwell P, Dunn FG. TIMP-1: A marker of left ventricular diastolic dysfunction and fibrosis in hypertension. Hypertension 2002; 40: 136–141.
- 34.
Heymans S, Schroen B, Vermeersch P, Milting H, Gao F, Kassner A, et al. Increased cardiac expression of tissue inhibitor of metalloproteinase-1 and tissue inhibitor of metalloproteinase-2 is related to cardiac fibrosis and dysfunction in the chronic pressure-overloaded human heart. Circulation 2005; 112: 1136–1144.
- 35.
Codolosa JN, Koshkelashvili N, Alnabelsi T, Goykhman I, Romero-Corral A, Pressman GS. Effect of mitral annular calcium on left ventricular diastolic parameters. Am J Cardiol 2016; 117: 847–852.
- 36.
Dimitrow PP, Michałowska J, Sorysz D. The effect of hemodialysis on left ventricular outflow tract gradient. Echocardiography 2010; 27: 603–607.
- 37.
Murata T, Dohi K, Onishi K, Sugiura E, Fujimoto N, Ichikawa K, et al. Role of haemodialytic therapy on left ventricular mechanical dyssynchrony in patients with end-stage renal disease quantified by speckle-tracking strain imaging. Nephrol Dial Transplant 2011; 26: 1655–1661.
