Abstract
Background:
Cardiac recovery and prevention of end-organ damage are the cornerstones of establishing successful bridge to recovery (BTR) in patients with fulminant myocarditis (FM) supported with percutaneous venoarterial extracorporeal membrane oxygenation (VA-ECMO). However, the timing and method of successful BTR prediction still remain unclear. We aimed to develop a prediction model for successful BTR in patients with FM supported with percutaneous VA-ECMO.
Methods and Results:
This was a retrospective multicenter chart review enrolling 99 patients (52±16 years; female, 42%) with FM treated with percutaneous VA-ECMO. The S-group comprised patients who experienced percutaneous VA-ECMO decannulation and subsequent discharge (n=46), and the F-group comprised patients who either died in hospital or required conversion to other forms of mechanical circulatory support (n=53). At VA-ECMO initiation (0-h), the S-group had significantly higher left ventricular ejection fraction (LVEF) and lower aspartate aminotransferase (AST) concentration than the F-group. At 48 h, the LVEF, increase in the LVEF, and reduction of AST from 0-h were identified as independent predictors in the S-group. Finally, we developed an S-group prediction model comprising these 3 variables (area under the curve, 0.844; 95% confidence interval, 0.745–0.944).
Conclusions:
We developed a model for use 48 h after VA-ECMO initiation to predict successful BTR in patients with FM.
Fulminant myocarditis (FM) is characterized by rapidly progressive myocardial inflammation leading to circulatory collapse.1,2
A certain number of patients cannot be adequately supported by conventional inotropic therapy,3
and despite recent progress in both medical knowledge and technology, treatment of these patients depends on mechanical circulatory support (MCS), including venoarterial extracorporeal membrane oxygenation (VA-ECMO) and ventricular assist devices (VADs).2
Percutaneous VA-ECMO is often used as first-line MCS for patients with FM because it can be introduced more quickly and easily and is less invasive than a VAD, which requires a surgical operation.4,5
VA-ECMO is considered a short-term but effective and useful circulatory support technique in urgent clinical situations.6
Previous reports have shown that approximately 50–70% of FM patients experience spontaneous recovery during VA-ECMO support.4,7–11
However, VA-ECMO cannot reduce the left ventricular afterload and may cause pulmonary congestion, which is a disadvantage for cardiac recovery.5
Additionally, it has insufficient power for circulatory support compared with VADs, potentially resulting in end-organ damage and poor outcomes.12
Therefore, establishment of a successful bridge to recovery (BTR) using short-term support with VA-ECMO would be an ideal management strategy for patients with FM. However, conversion to other forms of MCS such as VADs should be considered when long-term management is required because VA-ECMO cannot reduce the left ventricular afterload.
Spontaneous cardiac recovery without end-organ damage during VA-ECMO management is considered a cornerstone of good outcomes. However, little is known about the time course of cardiac recovery and end-organ damage in patients with FM supported with VA-ECMO. We hypothesized that early changes in cardiac function and biomarkers would provide us with predictive information about cardiac recovery in patients undergoing VA-ECMO support. In the present study, we investigated the time course of cardiac function and biomarkers during percutaneous VA-ECMO support to develop an early prediction model for successful BTR by VA-ECMO.
Methods
We conducted a multicenter retrospective study of the time-series data obtained during VA-ECMO in patients with FM: the Chart Review of In-hospital Prognosis in Patients with Fulminant Myocarditis on Percutaneous Cardiopulmonary Support (CHANGE PUMP) study. The data from patients with FM who required percutaneous VA-ECMO from January 2000 to August 2016 were obtained from the medical records at 26 high-volume cardiovascular centers in the Tokai area of Japan. The study protocol was approved by the Ethics Review Board of Nagoya University (approval no. 2016-0002).
Diagnosis of FM
In this study, patients with a diagnosis of acute myocarditis who required percutaneous VA-ECMO because of circulatory collapse were considered to have FM. The diagnosis of acute myocarditis was based on the histological findings of endomyocardial biopsy or autopsy or on the patient’s clinical findings according to the Japanese Circulation Society guidelines for the diagnosis and treatment of myocarditis.13
We not only accepted left ventricular ejection fraction (LVEF) measured by modified Simpson or Teichholz method, but also by visual evaluation. Patients with comorbid critical complications within 24 h after the initiation of percutaneous VA-ECMO, such as irreversible leg ischemia, stroke, major bleeding, and massive systemic thromboembolism, were excluded from the study.
Patient Classification
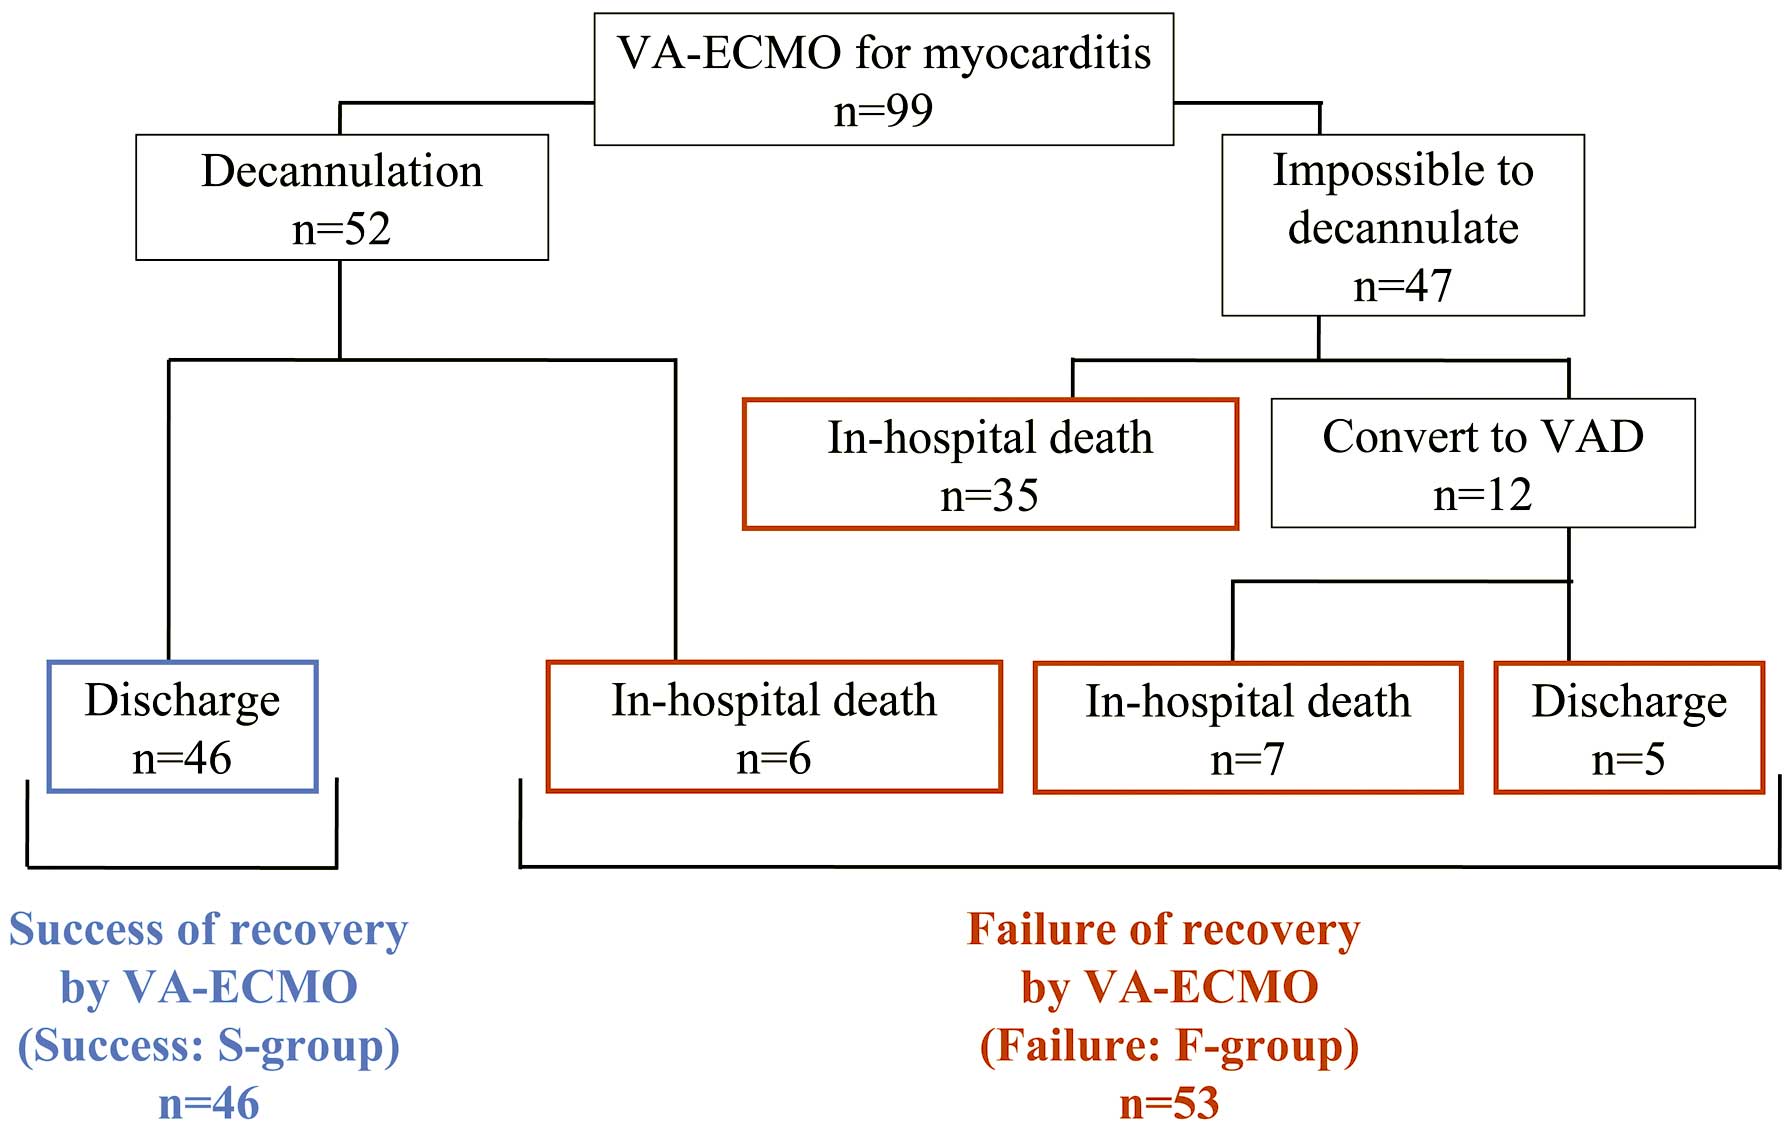
We screened 104 patients and of them 5 patients (1 irreversible leg ischemia, 3 stroke and 1 major bleeding within 24 h after VA-ECMO starting) were excluded. We therefore enrolled 99 patients with FM undergoing percutaneous VA-ECMO support (Figure 1). Patients who underwent percutaneous VA-ECMO decannulation and subsequent discharge were considered to have established a successful BTR. The 46 patients who achieved a successful BTR comprised the Success group (S-group). The other 53 patients, including those who died in hospital (n=48) or required conversion to other forms of MCS (n=5), comprised the Failure group (F-group).
Serial data, including the LVEF obtained by echocardiography and laboratory biomarkers up to 144 h after initiation of percutaneous VA-ECMO, were assessed.
Changes in Variables
We present the time course after VA-ECMO initiation as x-h; the time of VA-ECMO initiation is presented as 0-h. To investigate the significance of changes in biomarkers over time, we defined delta (∆) as the change from 0-h as in the following example: [∆aspartate aminotransferase (AST)48-h=(AST48-h−AST0-h)/AST0-h]. An exception to this is ∆LVEF48-h, which was defined as follows: [∆LVEF48-h=LVEF48-h−LVEF0-h] because LVEF0-h
in some patients was too low to measure and was therefore approximated as zero.
Statistical Analysis
Continuous variables are presented as mean±standard deviation (or median and interquartile range), and the distributions of these variables between the 2 groups were compared with the 2-sample t-test or Wilcoxon rank-sum test. Categorical variables are presented as number and percentage, and the distributions of these variables between the 2 groups were compared with the χ2
test. The changes in variables from VA-ECMO initiation (0-h) in each group were analyzed with the Wilcoxon signed-rank test.
We evaluated the prognostic effect of each variable, including the LVEF and concentrations of AST, alanine aminotransferase (ALT), lactate dehydrogenase, total bilirubin, blood urea nitrogen, serum creatinine, and creatine kinase, as well as the change (∆) in each of these variables. The patients who had no missing data with regard to these variables constructed the derivation cohorts. We performed univariable logistic analyses to evaluate the odds ratio (OR) and 95% confidence interval (95% CI) and thus assess the influence of each variable on the establishment of a successful BTR. The prediction models were developed by multivariate logistic analyses with stepwise variable selection (α=0.05). The prediction accuracy of the model was evaluated using the receiver-operating characteristic (ROC) curve and area under the curve (AUC). We performed these analyses for all data at 0-h, 24-h, 48-h, and 72-h to investigate the best time point for predicting a successful BTR.
All statistical analyses were performed with R version 3.3.0 (R Foundation for Statistical Computing, Vienna, Austria; https://www.r-project.org/). A value of P<0.05 was considered to indicate statistical significance.
Results
Baseline Data
The patients’ baseline characteristics are shown in
Table 1; 9 Patients (9%) had no data for LVEF at the time of admission. Histological diagnosis obtained by endomyocardial biopsy was performed in 60 (61%) patients. Of them, 51 (85%) and 8 (13%) were diagnosed with lymphocytic and eosinophilic myocarditis, respectively. No patients were diagnosed with giant cell myocarditis. A total of 37 (37%) patients underwent cardiopulmonary resuscitation (CPR) before initiation of percutaneous VA-ECMO, although there were no significant differences between the 2 groups. A total of 62 patients underwent renal replacement therapy (RRT) during the use of VA-ECMO, but there were no significant differences between the 2 groups (S-group, n=28; F-group, n=33; P=0.89). There were also no significant differences in the LVEF and biomarkers at admission between the 2 groups. All patients were managed by concomitant use of intra-aortic balloon pumping.
Table 1.
Study Patients’ Characteristics on Admission
| Variables |
S-group
(n=46) |
F-group
(n=53) |
P value |
| Age, years |
52.1±16.4 |
51.0±16.7 |
0.74 |
| Female, n (%) |
21 (46) |
21 (40) |
0.54 |
| BMI,a kg/m2 |
22.2±3.7 |
23.2±4.2 |
0.22 |
| Mean blood pressure,b mmHg |
71±14 |
65±16 |
0.07 |
| Heart rate,b beats/min |
106±27 |
98±31 |
0.21 |
| Reasons for VA-ECMO initiation, n (%) |
|
|
0.22 |
| Arrhythmia |
17 (32) |
8 (17) |
|
| Worsening heart failure |
19 (36) |
22 (48) |
|
| Hypotension |
17 (32) |
16 (35) |
|
| VA-ECMO run time, h |
141 (101–173) |
130 (58–262) |
0.88 |
| VA-ECMO related complications, n (%) |
6 (13) |
17 (32) |
0.03 |
| Leg ischemia |
2 (4) |
3 (6) |
0.77 |
| Stroke |
1 (2) |
4 (8) |
0.22 |
| Major bleeding |
0 (0) |
7 (13) |
0.01 |
| Thromboembolism |
1 (2) |
2 (4) |
0.64 |
| Respiratory failure |
1 (2) |
3 (6) |
0.38 |
| Concomitant therapy, n (%) |
| Steroids |
14 (26) |
10 (22) |
0.59 |
| Globulins |
22 (42) |
19 (41) |
0.98 |
| Laboratory data |
| White blood cells,c /μL |
11,604±6,081 |
10,292±4,596 |
0.23 |
| Red blood cells,c 104/μL |
459±71 |
446±62 |
0.37 |
| Hemoglobin,c g/dL |
14.1±2.1 |
13.7±1.8 |
0.36 |
| TB,b g/dL |
0.6 (0.5–0.8) |
0.7 (0.5–1.0) |
0.55 |
| AST,c U/L |
147 (77–605) |
225 (98–475) |
0.38 |
| ALT,c U/L |
76 (36–407) |
94 (45–247) |
0.72 |
| LDH,b U/L |
535 (395–1,320) |
689 (455–1,487) |
0.27 |
| CK,b U/L |
722 (496–1,084) |
798 (459–1,784) |
0.39 |
| BUN,c mg/dL |
34.1±22.3 |
30.5±17.5 |
0.36 |
| SCr,c mg/dL |
1.39±0.83 |
1.50±0.83 |
0.51 |
| C-reactive protein,b mg/dL |
3.57 (1.20–8.07) |
5.00 (1.42–12.47) |
0.31 |
| ECG |
| QRS width,d ms |
118 (82–150) |
132 (107–149) |
0.07 |
| Atrioventricular block, n (%) |
6 (13) |
8 (15) |
0.78 |
| Echocardiography |
| LVEF,b % |
32.2±15.2 |
31.6±17.3 |
0.85 |
| LVDD,d mm |
44.7±5.8 |
43.5±6.6 |
0.54 |
Missing values: a12%, b5–10%, c1–5%, d>25%. AST, aspartate aminotransferase; ALT, alanine aminotransferase; BMI, body mass index; BUN, blood urea nitrogen; CK, creatine kinase; LDH, lactate dehydrogenase; LVDD, left ventricular end-diastolic dimension; LVEF, left ventricular ejection fraction; NYHA, New York Heart Association; SCr, serum creatinine; TB, total bilirubin; VA-ECMO, venoarterial extracorporeal membrane oxygenation.
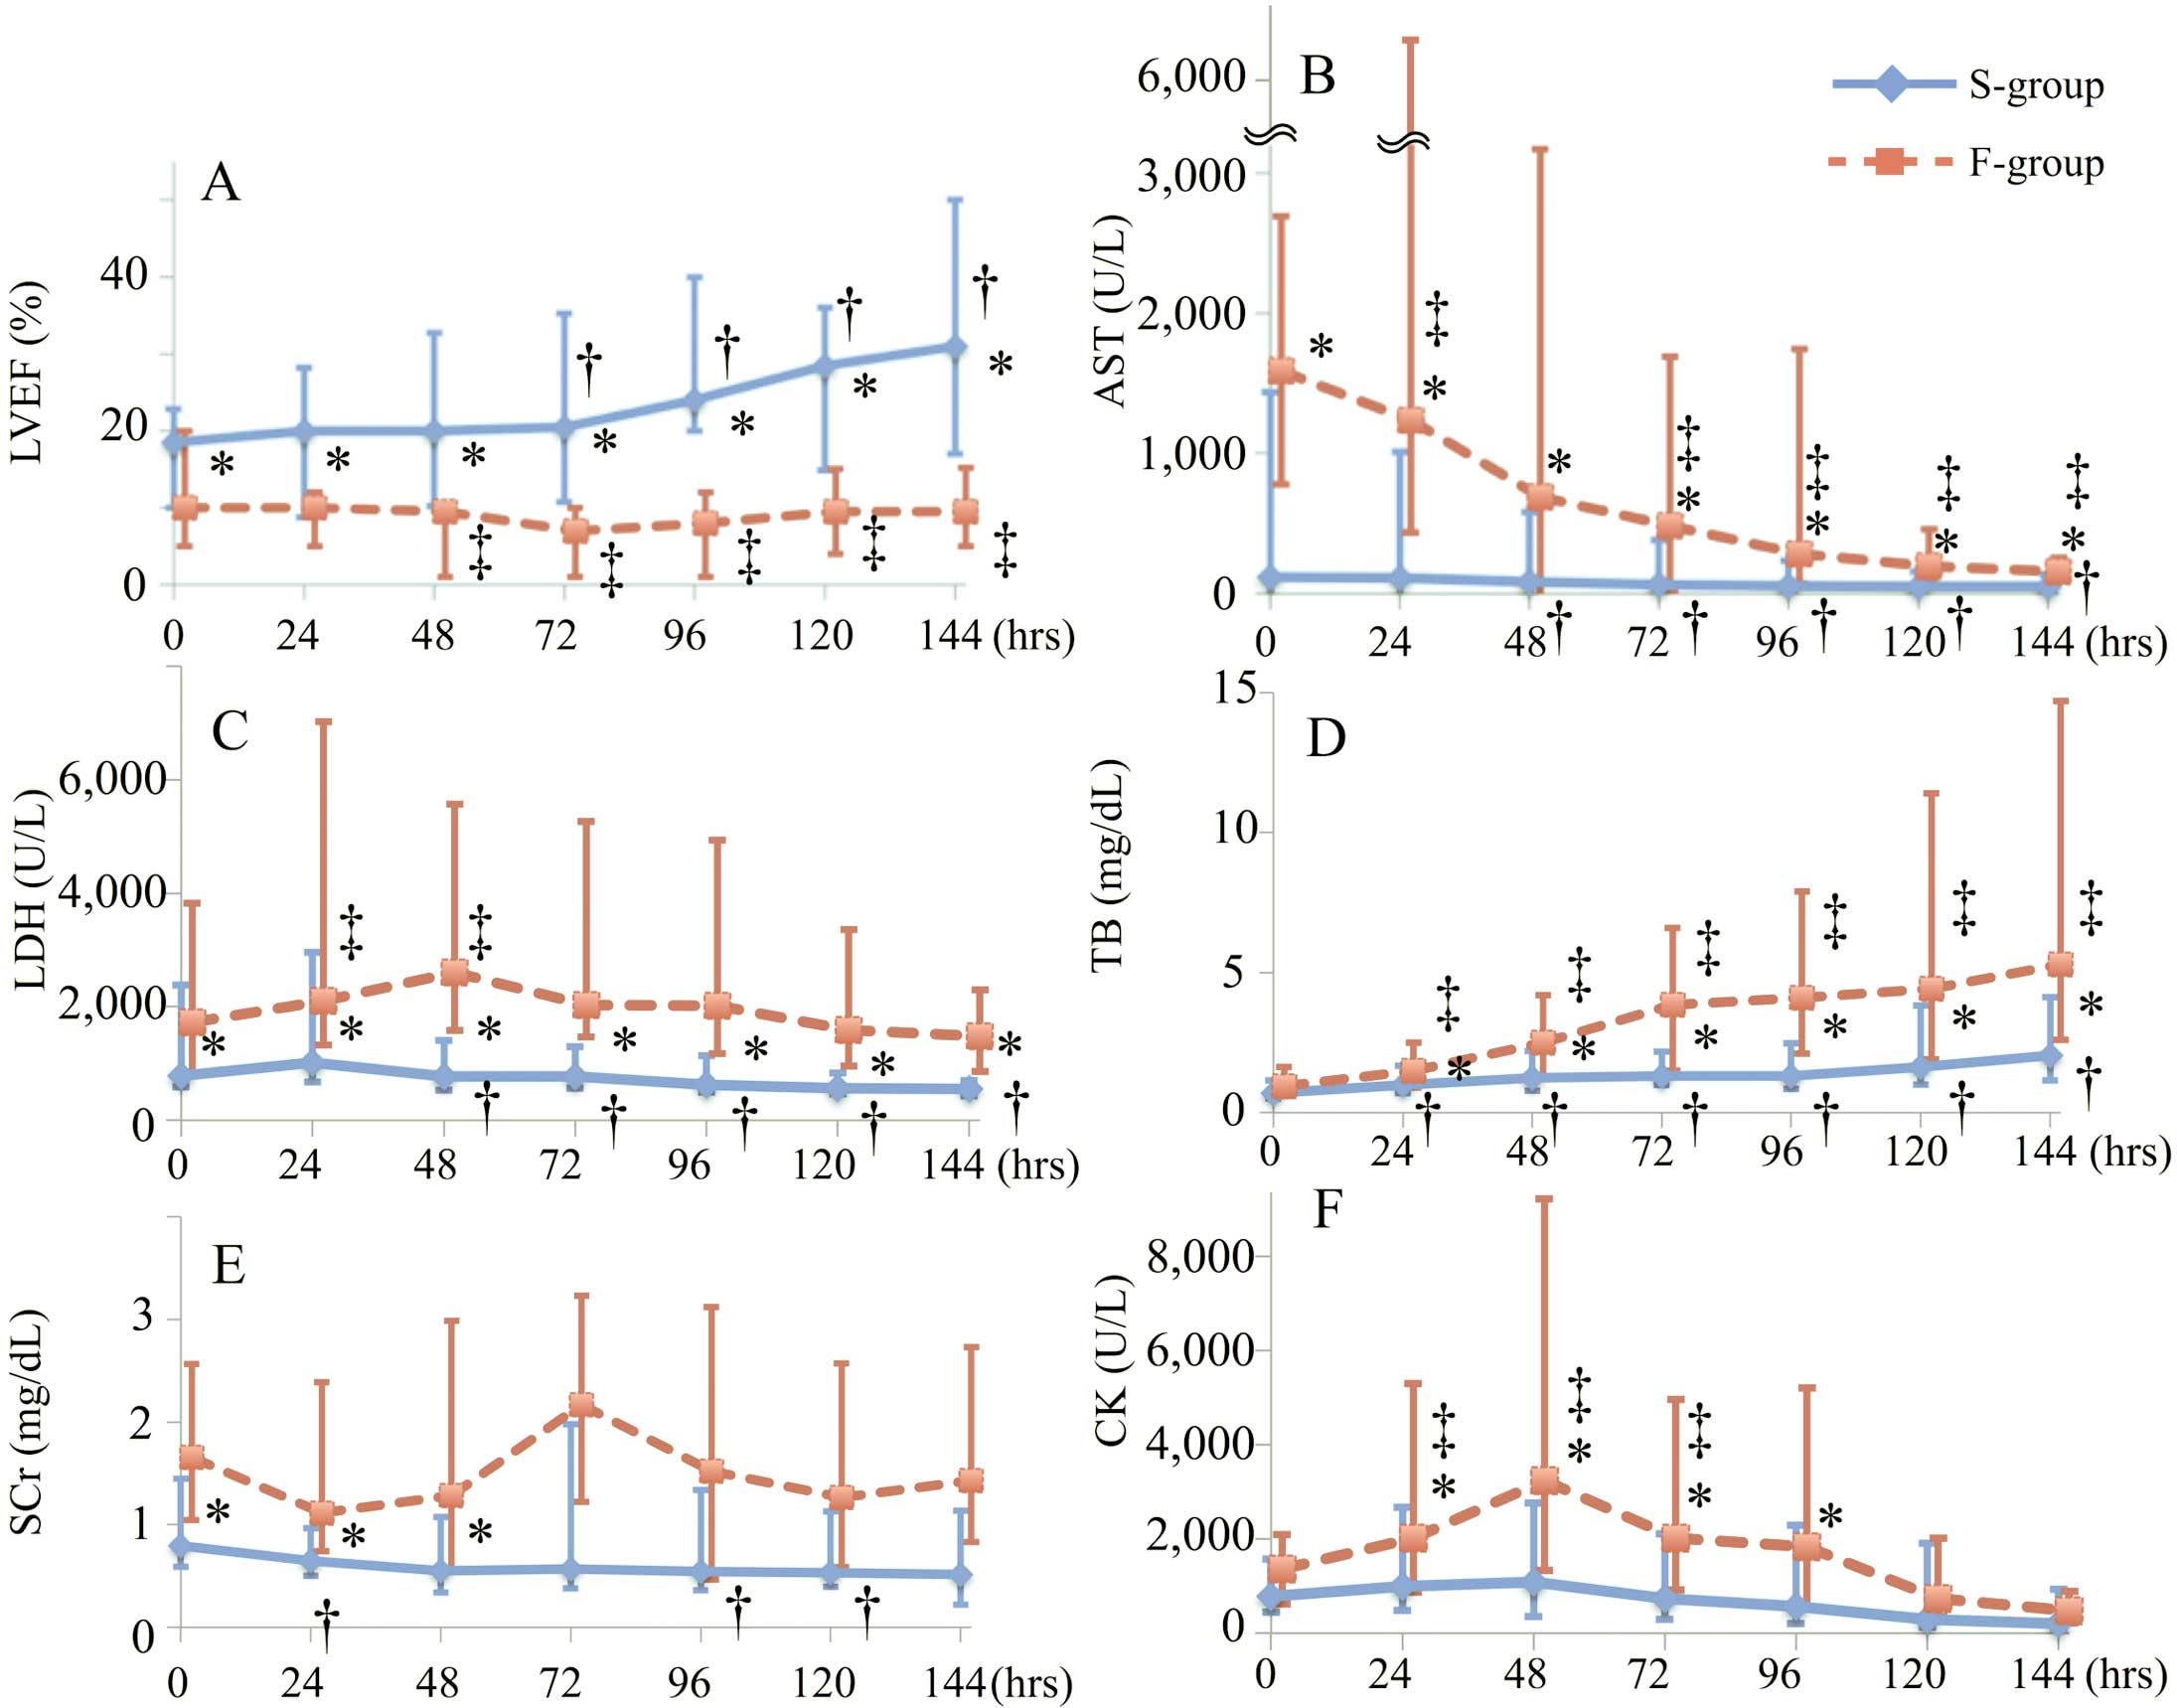
The mean changes in LVEF and biomarkers from 0-h to 144-h are shown in
Figure 2. ∆LVEF24-h
was larger in the S-group than in the F-group (2.0%±7.6% vs. −2.9%±4.8%, respectively; P=0.0005). The S-group showed a significant increase in LVEF after 72 h; conversely, the F-group showed a significant reduction after 48 h (Figure 2A).
The AST concentration began to decrease after 48 h in the S-group and 72 h in the F-group (Figure 2B). However, the total bilirubin concentration continued to increase in both groups (Figure 2D). No consistent trends in the serum creatinine concentration were observed in either group (Figure 2E). The creatine kinase concentration in the F-group peaked at 48 h, although there were no significant differences until 144 h in the S-group (Figure 2F).
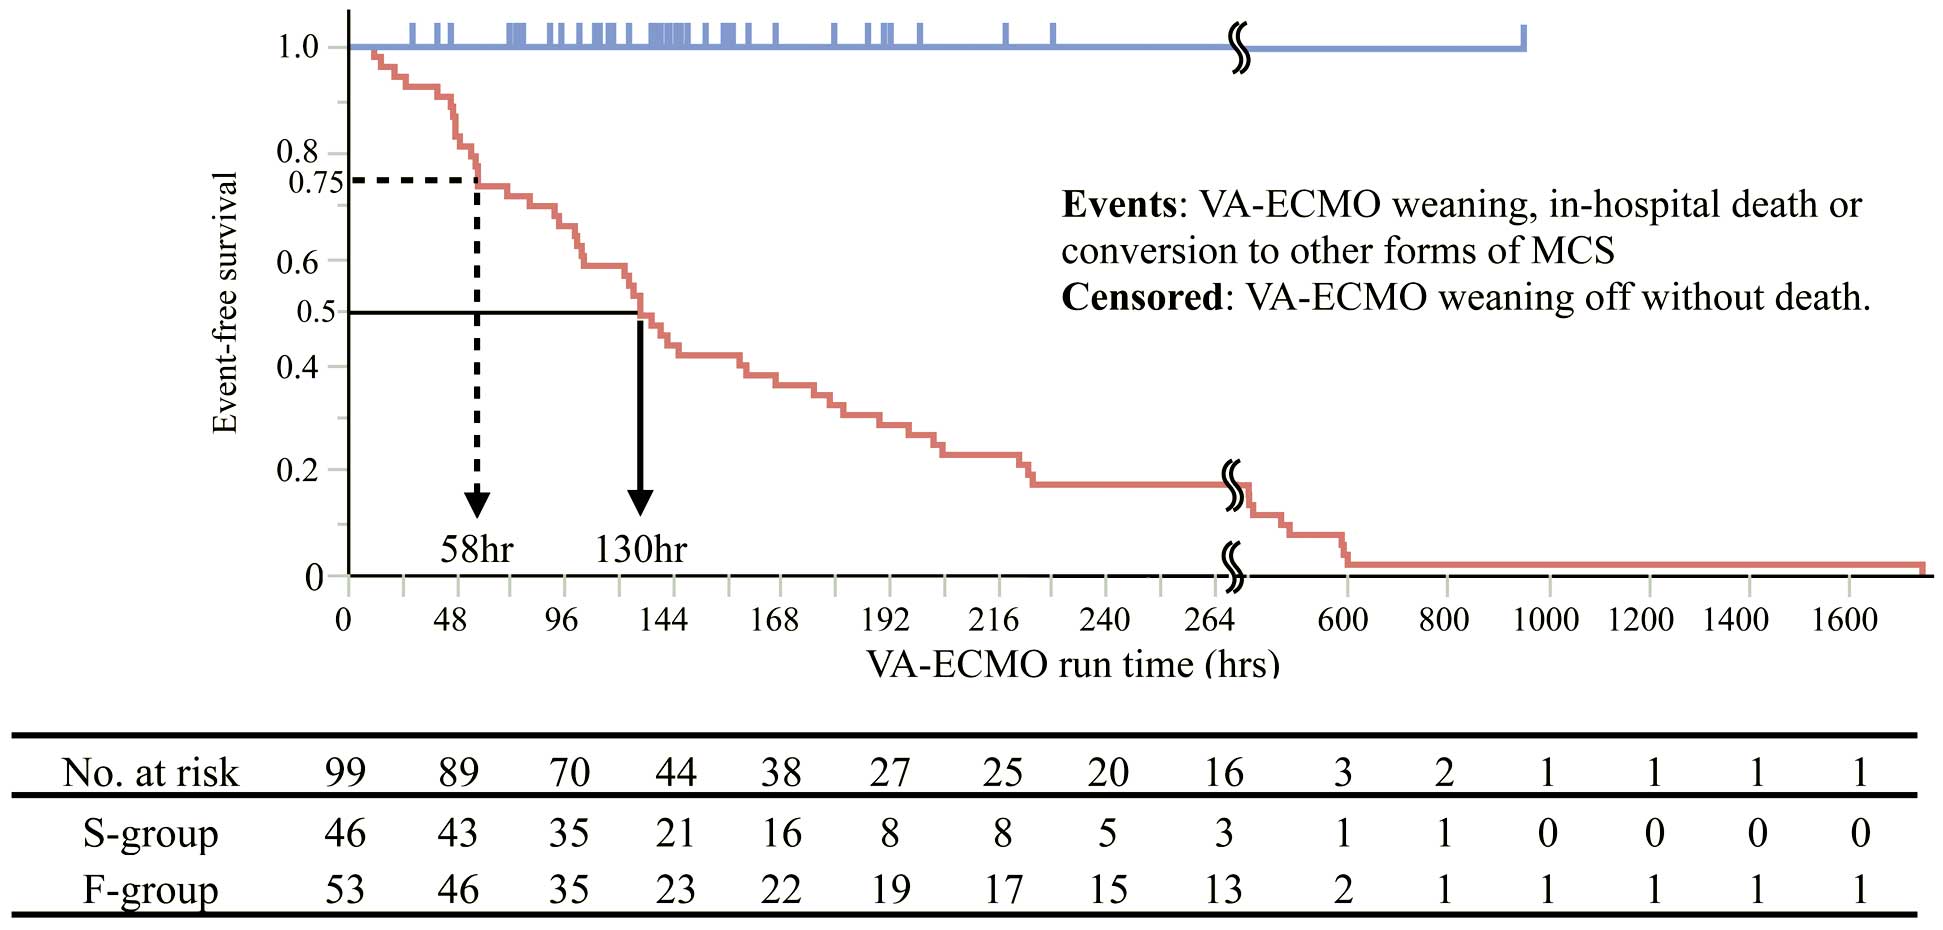
Prognosis
Among all patients, the median percutaneous VA-ECMO run time was 137 h. The three-quarter-life and half-life times in the F-group were 58 h (2.4 days) and 130 h (5.4 days), respectively. The 1-week survival rate in the F-group was 42% (Figure 3). A total of 12 patients were converted to other forms of MCS, including a bi-VAD (n=5), left-VAD with VA-ECMO (n=4), left-VAD alone (n=2), and add-on LV drainage to VA-ECMO (n=1). The median time from percutaneous VA-ECMO initiation to conversion to other forms of MCS was 65 h. Of all 99 patients, 52 were weaned off VA-ECMO support, but 6 of them died after the discontinuance. The causes of death among these patients were infection (n=3), ischemic stroke (n=1), worsening heart failure (n=1), and unknown (n=1).
BTR Prediction Model
The results of the logistic analyses of the 48-h variables are shown in
Table 2. (The 0-h, 24-h, and 72-h results are shown in
Table 3.) Multivariate analysis revealed that a higher LVEF48-h
and ∆LVEF48-h, and lower ∆AST48-h
were significant predictors.
From these results, we constructed a prediction model of a successful BTR at 48-h (Model48-h) as follows: predicted success of BTR by Model48-h (%)=1/[1+exp(0.688−0.104×LVEF48-h−0.143×∆LVEF48-h+1.171×∆AST48-h)]×100.
Table 2.
Logistic Analyses for Prediction of Successful Bridge to Recovery (n=49)
| Variables |
Univariate |
P value |
Multivariate |
P value |
AUC |
| OR (95% CI) |
OR (95% CI) |
| LVEF48-h |
1.12 (1.04–1.21) |
0.003 |
1.11 (1.01–1.22) |
0.03 |
0.92 |
| ΔLVEF48-h |
1.14 (1.04–1.24) |
0.004 |
1.15 (1.01–1.31) |
0.03 |
|
| AST48-h |
1.00 (1.00–1.00) |
0.06 |
|
|
|
| ΔAST48-h |
0.39 (0.19–0.80) |
0.01 |
0.31 (0.10–0.93) |
0.04 |
|
| ALT48-h |
1.00 (1.00–1.00) |
0.10 |
|
|
|
| ΔALT48-h |
0.67 (0.40–1.10) |
0.11 |
|
|
|
| LDH48-h |
1.00 (1.00–1.00) |
0.01 |
|
|
|
| ΔLDH48-h |
0.23 (0.08–0.70) |
0.01 |
|
|
|
| TB48-h |
0.71 (0.52–0.97) |
0.03 |
|
|
|
| ΔTB48-h |
0.63 (0.40–1.00) |
0.05 |
|
|
|
| BUN48-h |
0.97 (0.93–1.00) |
0.06 |
|
|
|
| ΔBUN48-h |
0.31 (0.07–1.36) |
0.12 |
|
|
|
| SCr48-h |
0.70 (0.46–1.08) |
0.10 |
|
|
|
| ΔSCr48-h |
0.39 (0.09–1.69) |
0.21 |
|
|
|
| CK48-h |
1.00 (1.00–1.00) |
0.14 |
|
|
|
| ΔCK48-h |
0.95 (0.88–1.02) |
0.15 |
|
|
|
AUC, area under the curve; CI, confidence interval; OR, odds ratio. Other abbreviations as in Table 1.
Table 3.
Logistic Analyses for Successful Bridge to Recovery Using 0-h, 24-h, and 72-h Data
| |
Univariate |
P value |
Multivariate |
P value |
AUC |
| OR (95% CI) |
OR (95% CI) |
| 0-h (n=66) |
| LVEF0-h |
0.98 (0.93–1.02) |
0.27 |
|
|
|
| TB0-h |
1.57 (0.89–3.37) |
0.17 |
|
|
|
| AST0-h |
1.00 (1.00–1.00) |
0.60 |
|
|
|
| ALT0-h |
1.00 (1.00–1.00) |
0.96 |
|
|
|
| LDH0-h |
1.00 (1.00–1.00) |
0.33 |
|
|
|
| CK0-h |
1.00 (1.00–1.00) |
0.33 |
|
|
|
| BUN0-h |
1.01 (0.98–1.03) |
0.53 |
|
|
|
| SCr0-h |
1.39 (0.86–2.35) |
0.20 |
|
|
|
| 24-h (n=59) |
| LVEF24-h |
1.08 (1.03–1.14) |
0.002 |
1.07 (1.01–1.13) |
0.02 |
0.81 |
| ΔLVEF24-h |
1.25 (1.09–1.44) |
0.002 |
1.26 (1.07–1.48) |
0.01 |
|
| AST24-h |
1.00 (1.00–1.00) |
0.17 |
|
|
|
| ΔAST24-h |
1.00 (0.90–1.10) |
0.92 |
|
|
|
| ALT24-h |
1.00 (1.00–1.00) |
0.77 |
|
|
|
| ΔALT24-h |
1.00 (0.75–1.32) |
0.97 |
|
|
|
| LDH24-h |
1.00 (1.00–1.00) |
0.29 |
|
|
|
| ΔLDH24-h |
0.90 (0.59–1.38) |
0.64 |
|
|
|
| TB24-h |
0.75 (0.49–1.15) |
0.19 |
|
|
|
| ΔTB24-h |
0.91 (0.51–1.62) |
0.75 |
|
|
|
| BUN24-h |
0.98 (0.95–1.01) |
0.27 |
|
|
|
| ΔBUN24-h |
0.36 (0.06–2.21) |
0.27 |
|
|
|
| SCr24-h |
0.77 (0.49–1.19) |
0.23 |
|
|
|
| ΔSCr24-h |
0.37 (0.08–1.80) |
0.22 |
|
|
|
| CK24-h |
1.00 (1.00–1.00) |
0.12 |
|
|
|
| ΔCK24-h |
1.01 (0.98–1.03) |
0.57 |
|
|
|
| 72-h (n=47) |
| LVEF72-h |
1.16 (1.06–1.27) |
0.001 |
1.16 (1.06–1.27) |
0.001 |
0.88 |
| ΔLVEF72-h |
1.11 (1.03–1.20) |
0.004 |
|
|
|
| AST72-h |
1.00 (1.00–1.00) |
0.07 |
|
|
|
| ΔAST72-h |
0.89 (0.71–1.12) |
0.32 |
|
|
|
| ALT72-h |
1.00 (1.00–1.00) |
0.42 |
|
|
|
| ΔALT72-h |
0.94 (0.81–1.08) |
0.36 |
|
|
|
| LDH72-h |
1.00 (1.00–1.00) |
0.03 |
|
|
|
| ΔLDH72-h |
0.70 (0.42–1.16) |
0.16 |
|
|
|
| TB72-h |
0.75 (0.60–0.95) |
0.02 |
|
|
|
| ΔTB72-h |
0.85 (0.69–1.04) |
0.11 |
|
|
|
| BUN72-h |
0.97 (0.94–1.00) |
0.07 |
|
|
|
| ΔBUN72-h |
0.63 (0.23–1.74) |
0.37 |
|
|
|
| SCr72-h |
0.80 (0.54–1.17) |
0.25 |
|
|
|
| ΔSCr72-h |
0.79 (0.29–2.15) |
0.65 |
|
|
|
| CK72-h |
1.00 (1.00–1.00) |
0.09 |
|
|
|
| ΔCK72-h |
0.96 (0.91–1.02) |
0.18 |
|
|
|
Abbreviations as in Tables 1,2.
In the same way, we constructed models using the 24-h and 72-h data (Model24-h
and Model72-h, respectively) as follows: predicted success of BTR by Model24-h (%)=1/[1+exp(0.726−0.068×LVEF24-h−0.227×∆LVEF24-h)]×100, and predicted success of BTR by Model72-h (%)=1/[1+exp(4.051−0.285×LVEF72-h)]×100. We performed ROC analyses of these models for internal validation. The AUCs of Model24-h, Model48-h, and Model72-h
are shown in
Figure 4. The successful BTR provability computed by Model48-h
and the actual successful BTR rate were well matched (Figure 5).
Discussion
The optimal management of MCS in patients with FM has not been established, but appropriate hemodynamic stabilization by optimal forms of MCS is vitally important in the management of FM.14
Although previous studies have revealed that peripheral VA-ECMO is effective for the treatment of FM,4,15,16
conversion to other forms of MCS should be considered when long-term management is required. However, when such decisions should be made and upon what they should be based are unclear. The main findings of this study were as follows. (1) It is possible to predict a future successful BTR 48 h after initiation of peripheral VA-ECMO, and (2) the LVEF48-h, ∆LVEF48-h, and ∆AST48-h
are important factors for predicting a successful BTR. This is the first report to provide landmark information on the appropriate timing for decision-making, as well as predictors for successful BTR in patients with FM supported by peripheral VA-ECMO.
Optimal Timing for Decisions
We developed a prediction model for a successful BTR using data obtained at 24, 48, and 72 h after the initiation of peripheral VA-ECMO. With respect to conversion to other forms of MCS, we believe that earlier conversion is better for cardiac recovery because VA-ECMO cannot reduce the left ventricular afterload, which would be a disadvantage for cardiac recovery. However, no significant predictive variables were identified in the S-group at 0 h (Table 3). Therefore, we could not develop a prediction model using the 0-h data. In Model24-h, multivariate logistic regression analyses revealed that LVEF24-h
and ∆LVEF24-h
were significant predictors for a successful BTR. Likewise, in Model72-h, only the LVEF72-h
was a significant predictor in the S-group (Table 3). Although we could not statistically compare the 3 models, we consider that Model48-h
is reasonably available and clinically useful for prognostic prediction; its AUC was the highest (Figure 4).
Acker demonstrated that FM survivors who were treated with ECMO support were usually weaned in less than 1 week.12
However, only 22 (42%) patients in the F-group survived for >1 week in the present study (Figure 3). Likewise, Hsu et al reported that survival of FM could be predicted at 48 h by assessing the reduction in troponin release.7
We need to establish a further treatment strategy, including conversion to other forms of MCS, as early as possible. It seems reasonable to make the initial decision at 48 h after starting VA-ECMO. However, more than half of patients with FM recover with percutaneous VA-ECMO support,4,7–9
so converting the MCS with a surgical procedure may be unnecessary for some patients. Taken together, these facts may confuse attending physicians and cause a delay in decision-making. We believe that Model48-h
will greatly contribute to avoiding a delay in decision-making.
We herein propose a novel strategy for the management of patients with FM supported with peripheral VA-ECMO: (1) the predicted BTR rate should be assessed using the prediction model at 48 h after starting VA-ECMO, and (2) according to the predicted BTR rate calculated by Model48-h, physicians should consider the benefits and risks and decide whether to convert to other forms of MCS or continue with percutaneous VA-ECMO support.
Importance of Cardiac Recovery
Cardiac recovery is necessary for a successful BTR. Lorusso et al17
reported that cardiac recovery was observed at a mean of 9.0 days in patients with FM. More importantly, however, the early signs of left ventricular functional recovery are recognized prior to this time point. In the present study, a significant difference in baseline LVEF was noted at the time of VA-ECMO initiation (Figure 2A). However, the LVEF in the S-group was increased at 72 h, whereas that in the F-group was decreased at 48 h (∆LVEF48-h
in S-group vs. F-group: 5.0±13.2% vs. −3.3±7.6%, P=0.001). The logistic regression analyses revealed that the best cutoff values of LVEF48-h
and ∆LVEF48-h
were 11% and 5%, respectively (data not shown). We thus elucidated the importance of detecting early signs of cardiac recovery for prediction of a successful BTR.
Significance of Liver Functional Tests
We demonstrated that a lower ∆AST48-h
was an important predictor of a successful BTR. This suggests that preventing end-organ damage caused by overuse of percutaneous VA-ECMO is important for a successful BTR. Previous reports showed that liver failure is risk factor of long-term outcome even after successful cardiac surgery.18
Additionally, Schmidt et al19
reported that liver failure at the start of VA-ECMO was a risk for in-hospital death. They defined liver failure as elevations of serum aminotransferases (ALT or AST) to >70 U/L or total bilirubin to >33 µmol/L. However, according to their diagnostic criteria, 93% of the patients in the present study had liver failure at 0 h. We consider that the high prevalence of liver failure in patients with FM is one reason why the aminotransferase concentration at 0 h was not a risk factor. On the other hand, we clarified that an increase in the AST concentration at 48 h (higher ∆AST48-h) predicted a poor future outcome. The half-life of AST is 10–15 h. Therefore, we presume that a sustained AST elevation might reflect not acute liver failure (so-called shock liver) but persistent end-organ damage from hemodynamic disturbance. This finding may also indicate the importance of continuing end-organ damage for accurate prediction of the prognosis. The elevation of AST can also be explained by the influence of hemolysis. Red blood cell destruction because of mismatched pump flow might cause a sustained elevation of AST. Actually, the number of packed red blood cells transfused during percutaneous VA-ECMO is reportedly a significant predictor of mortality.20
Diddle et al showed that high pump flow 4 h after initiation of percutaneous VA-ECMO is associated with increased in-hospital mortality.21
We may be able to predict future clinical outcomes by assessing the changes in AST in patients with FM undergoing VA-ECMO because such changes reflect the patient’s systemic condition.
Renal Function
There were no significant differences in the prevalence of RRT between the 2 groups in this study. In addition, the level of blood urea nitrogen or serum creatinine was not associated with successful BTR. Previously, Schmidt et al reported a negative effect of renal impairment on clinical outcomes in FM patients treated with VA-ECMO.19
Hemodynamic disturbance causes acute worsening of renal failure and temporary RRT is sometimes required. Actually, 61 patients (62%) in this study underwent RRT. We consider that prevention of sustained renal damage, rather than temporal damage, is important for the early prediction of prognosis. In this retrospective study, the blood urea nitrogen or serum creatinine level would not reflect sustained renal dysfunction because of the modification by RRT.
Other Potential Factors
Several previous studies have reported the predictive factors of a fulminant course in patients with acute myocarditis.21–24
Paradoxically, the improvement of these findings may be potential recovery markers.
As for the ECG findings, Kato et al reported that intraventricular conduction disturbance predicted a fulminant course.22
In our study, the QRS width in the F-group tended to be more prolonged than that in the S-group (Table 1). However, the improvement in QRS width had no effect on a successful BTR in the logistic analyses [∆QRS24-h: OR 1.71, 95% CI 0.19–17.06, P=0.63, ∆QRS48-h: OR 4.88, 95% CI 0.77–57.70, P=0.10]. We consider that the recovery of QRS width may occur later than 48 h. Actually, the ∆QRS48-h
and ∆QRS120-h
of the S-group were −7% and −16%, respectively. The improvement in QRS width would not suitable for early prediction of successful BTR.
As for biomarkers, previous studies reported that a higher concentration of creatine kinase predicts a fulminant course or poor outcome.9,22
However, we showed that it had no predictive value for outcome in the present study (Table 3). It may be ascribed as a consequence of the exclusion criteria. We excluded patients with critical complications, including irreversible leg ischemia or massive systemic thromboembolism within 24 h after VA-ECMO initiation. It is known that these are major complications of peripheral VA-ECMO and cause a remarkable elevation of creatine kinase. Therefore, creatine kinase may not be available for the early prediction of prognosis in FM patients without critical complications.
Study Limitations
First, although we evaluated a relatively large number of patients with FM undergoing percutaneous VA-ECMO compared with previous reports, our results are not statistically universal. In addition, we should take selection bias into consideration when interpreting the results, because there were some missing values in our data set. A larger prospective study is needed. Second, the variables that could be included in the model derivation were limited because this study was retrospective. Therefore, we could not consider the state of the aortic valve opening or the right heart catheterization findings, which seem to have a substantial influence on clinical judgment. Third, in the internal validation analyses of Model48-h, one-quarter of the patients who were predicted to have a ≤20% probability of successful BTR achieved such an outcome (Figure 5). In these exceptional cases, the AST concentration tended to be low at 0 h, and ∆AST48-h
tended to be high because of a mild increase in the AST concentration. It may be necessary to carefully assess the results of our prediction model in these cases. Fourth, although LVEF was a significant predictor in our model, the consistency of the measurement was not entirely robust, because we accepted visually evaluated bedside data under severe conditions. Finally, we could not perform an external validation in this study. We need to verify that our model can be applied to other populations.
Conclusions
We developed a prediction model for establishment of a successful BTR in patients with FM being supported with percutaneous VA-ECMO. The LVEF, ∆LVEF, and ∆AST at 48 h after VA-ECMO initiation were principal components of our model. This prediction model might contribute to deciding whether VA-ECMO support should be continued or whether the patient should be converted to another form of MCS.
Acknowledgments
We thank the collaborators and members of the CHANGE PUMP study group.
Steering Committee of the CHANGE PUMP Study
Nagoya University Graduate School of Medicine: T. Murohara, A. Sawamura, T. Okumura; Mie University Graduate School of Medicine: M. Ito; Fujita Health University: Y. Ozaki; Nagoya City University Graduate School of Medical Science: N. Ohte; Aichi Medical University: T. Amano.
List of Investigators at Participating Medical Institutions in the CHANGE PUMP Study
Aichi Medical University: T. Mizuno, K. Mukai, T. Amano; Anjo Kosei Hospital: M. Koyasu, Y. Ozaki; Chubu Rosai Hospital: K. Harada, H. Funakubo; Chutoen General Medical Center: S. Morikawa, R. Ota; Fujita Health University: Y. Kato, Y. Ozaki; Gifu Prefectural Tajimi Hospital: T. Shigeta; Hamamatsu Medical Center: M. Muto; Handa City Hospital: M. Sakakibara; Ise Red Cross Hospital: T. Seko, K. Unno; Japan Community Healthcare Organization Chukyo Hospital: K. Kada, M. Yoshida, H. Kato; Japanese Red Cross Nagoya Daiichi Hospital: S. Shimizu; Japanese Red Cross Nagoya Daini Hospital: Y. Aoyama; Kainan Hospital Aichi Prefectural Welfare Federation of Agricultural Cooperatives: M. Miura; Kariya Toyota General Hospital: M. Goto; Komaki Municipal Hospital: H. Imai; Mie University Graduate School of Medicine: K. Dohi, K. Moriwaki, E. Sugiura, N. Fujimoto, S. Fukuoka, N. Kumagai, T. Omori, M. Ito; Nagoya City University Graduate School of Medical Science: S. Kitada, N. Ohte; Nagoya Ekisaikai Hospital: D. Tanimura; Nagoya University Graduate School of Medicine: H. Kawase, S. Aoki, A. Sawamura, T. Okumura, T. Murohara; Ogaki Municipal Hospital: Y. Morita; Okazaki City Hospital: M. Niwa; Tose General Hospital: M. Ajioka, T. Kanbara; Toyohashi Municipal Hospital: S. Shimazu; Toyota Kosei Hospital: M. Shinoda, S. Kaneko, T. Kamihara, K. Yamaguchi; Toyota Memorial Hospital: K. Suga; Yokkaichi Municipal Hospital: W. Suzuki.
Authors’ Contributions
A.S., T.O., A.H. T.M. conceived and designed this study. A.H. performed the statistical analysis. A.S., T.O., T.M. analyzed and interpreted the results. A.S., T.O. drafted the manuscript. A.H., M.I., Y.O., N.O., T.A., T.M. critically revised the manuscript.
Conflicts of Interest / Source of Funding
None declared.
References
- 1.
Sagar S, Liu PP, Cooper LT. Myocarditis. Lancet 2012; 379: 738–747.
- 2.
Caforio AL, Pankuweit S, Arbustini E, Basso C, Gimeno-Blanes J, Felix SB, et al. Current state of knowledge on aetiology, diagnosis, management, and therapy of myocarditis: A position statement of the European Society of Cardiology Working Group on Myocardial and Pericardial Diseases. Eur Heart J 2013; 34: 2636–2648, 2648a–2648d.
- 3.
McCarthy RE 3rd, Boehmer JP, Hruban RH, Hutchins GM, Kasper EK, Hare JM, et al. Long-term outcome of fulminant myocarditis as compared with acute (nonfulminant) myocarditis. N Engl J Med 2000; 342: 690–695.
- 4.
Asaumi Y, Yasuda S, Morii I, Kakuchi H, Otsuka Y, Kawamura A, et al. Favourable clinical outcome in patients with cardiogenic shock due to fulminant myocarditis supported by percutaneous extracorporeal membrane oxygenation. Eur Heart J 2005; 26: 2185–2192.
- 5.
Pozzi M, Banfi C, Grinberg D, Koffel C, Bendjelid K, Robin J, et al. Veno-arterial extracorporeal membrane oxygenation for cardiogenic shock due to myocarditis in adult patients. J Thorac Dis 2016; 8: E495–E502.
- 6.
Feldman D, Pamboukian SV, Teuteberg JJ, Birks E, Lietz K, Moore SA, et al. The 2013 International Society for Heart and Lung Transplantation Guidelines for mechanical circulatory support: Executive summary. J Heart Lung Transplant 2013; 32: 157–187.
- 7.
Hsu KH, Chi NH, Yu HY, Wang CH, Huang SC, Wang SS, et al. Extracorporeal membranous oxygenation support for acute fulminant myocarditis: Analysis of a single center’s experience. Eur J Cardiothorac Surg 2011; 40: 682–688.
- 8.
Mirabel M, Luyt CE, Leprince P, Trouillet JL, Leger P, Pavie A, et al. Outcomes, long-term quality of life, and psychologic assessment of fulminant myocarditis patients rescued by mechanical circulatory support. Crit Care Med 2011; 39: 1029–1035.
- 9.
Aoyama N, Izumi T, Hiramori K, Isobe M, Kawana M, MHiroe M, et al. National survey of fulminant myocarditis in Japan: Therapeutic guidelines and long-term prognosis of using percutaneous cardiopulmonary support for fulminant myocarditis (Special Report from a scientific committee). Circ J 2002; 66: 133–144.
- 10.
Matsuura H, Ichida F, Saji T, Ogawa S, Waki K, Kaneko M, et al. Clinical features of acute and fulminant myocarditis in children: 2nd Nationwide Survey by Japanese Society of Pediatric Cardiology and Cardiac Surgery. Circ J 2016; 80: 2362–2368.
- 11.
Ueki Y, Mohri M, Matoba T, Tsujita Y, Yamasaki M, Tachibana E, et al. Characteristics and predictors of mortality in patients with cardiovascular shock in Japan: Results from the Japanese Circulation Society Cardiovascular Shock Registry. Circ J 2016; 80: 852–859.
- 12.
Acker MA. Mechanical circulatory support for patients with acute-fulminant myocarditis. Ann Thorac Surg 2001; 71: S73–S76.
- 13.
JCS Joint Working Group. Guidelines for diagnosis and treatment of myocarditis (JCS 2009): Digest version. Circ J 2011; 75: 734–743.
- 14.
Mody KP, Takayama H, Landes E, Yuzefpolskaya M, Colombo PC, Naka Y, et al. Acute mechanical circulatory support for fulminant myocarditis complicated by cardiogenic shock. J Cardiovasc Transl Res 2014; 7: 156–164.
- 15.
Nakamura T, Ishida K, Taniguchi Y, Nakagawa T, Seguchi M, Wada H, et al. Prognosis of patients with fulminant myocarditis managed by peripheral venoarterial extracorporeal membranous oxygenation support: A retrospective single-center study. J Intensive Care 2015; 3: 5.
- 16.
Pages ON, Aubert S, Combes A, Luyt CE, Pavie A, Leger P, et al. Paracorporeal pulsatile biventricular assist device versus extracorporal membrane oxygenation-extracorporal life support in adult fulminant myocarditis. J Thorac Cardiovasc Surg 2009; 137: 194–197.
- 17.
Lorusso R, Centofanti P, Gelsomino S, Barili F, Di Mauro M, Orlando P, et al. Venoarterial extracorporeal membrane oxygenation for acute fulminant myocarditis in adult patients: A 5-year multi-institutional experience. Ann Thorac Surg 2016; 101: 919–926.
- 18.
Chou AH, Chen TH, Chen CY, Chen SW, Lee CW, Liao CH, et al. Long-term outcome of cardiac surgery in 1,040 liver cirrhosis patients: Nationwide population-based cohort study. Circ J 2017; 81: 476–484.
- 19.
Schmidt M, Burrell A, Roberts L, Bailey M, Sheldrake J, Rycus PT, et al. Predicting survival after ECMO for refractory cardiogenic shock: The Survival After Veno-arterial-ECMO (SAVE) score. Eur Heart J 2015; 36: 2246–2256.
- 20.
Loforte A, Marinelli G, Musumeci F, Folesani G, Pilato E, Martin Suarez S, et al. Extracorporeal membrane oxygenation support in refractory cardiogenic shock: Treatment strategies and analysis of risk factors. Artif Organs 2014; 38: E129–E141.
- 21.
Diddle JW, Almodovar MC, Rajagopal SK, Rycus PT, Thiagarajan RR. Extracorporeal membrane oxygenation for the support of adults with acute myocarditis. Crit Care Med 2015; 43: 1016–1025.
- 22.
Kato S, Morimoto S, Hiramitsu S, Uemura A, Ohtsuki M, Kato Y, et al. Risk factors for patients developing a fulminant course with acute myocarditis. Circ J 2004; 68: 734–739.
- 23.
Ting M, Wang CH, Tsao CI, Huang SC, Chi NH, Chou NK, et al. Heart transplantation under mechanical circulatory support for acute fulminant myocarditis with cardiogenic shock: 10 Years’ experience of a single center. Transplant Proc 2016; 48: 951–955.
- 24.
Felker GM, Boehmer JP, Hruban RH, Hutchins GM, Kasper EK, Baughman KL, et al. Echocardiographic findings in fulminant and acute myocarditis. J Am Coll Cardiol 2000; 36: 227–232.