Abstract
Background:
Clinical profiles of acute heart failure (AHF) complicating severe aortic stenosis (AS) remain unclear.
Methods and Results:
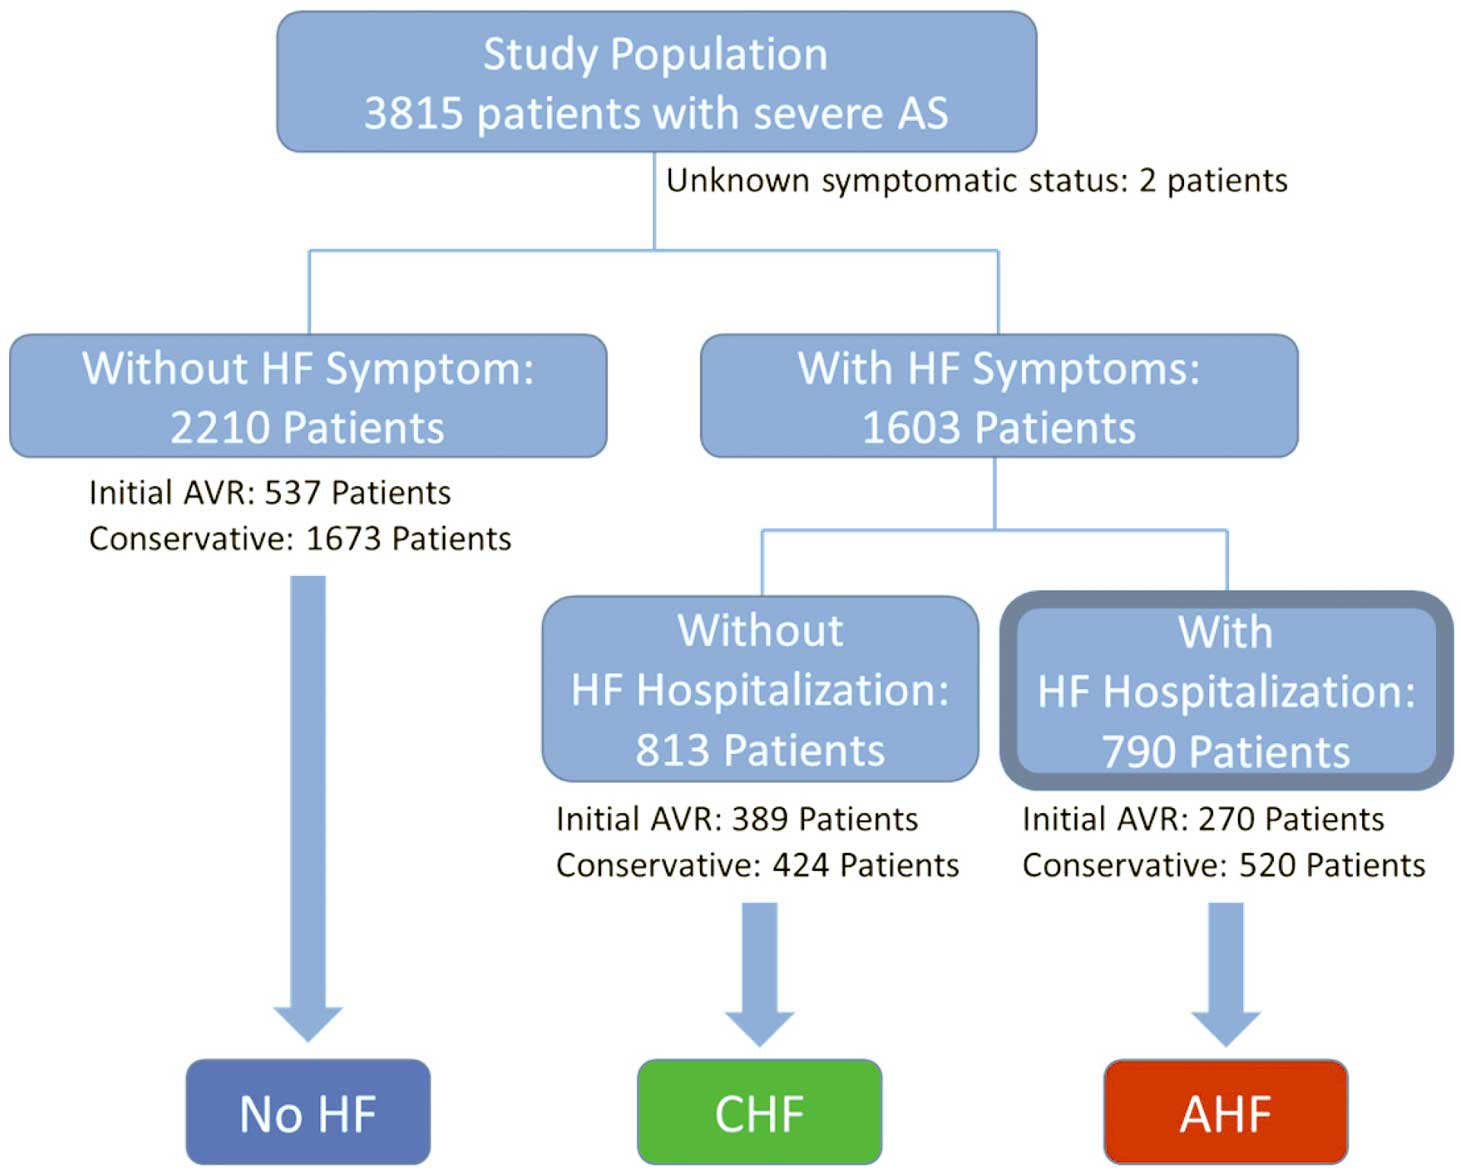
From a Japanese multicenter registry enrolling consecutive patients with severe AS, 3,813 patients were categorized into the 3 groups according to the symptom of heart failure (HF); No HF (n=2,210), chronic HF (CHF) (n=813) and AHF defined as hospitalized HF at enrolment (n=790). Median follow-up was 1,123 days with 93% follow-up rate at 2 years. Risk factors for developing AHF included age, female sex, lower body mass index, untreated coronary artery stenosis, anemia, history of HF, left ventricular ejection fraction <50%, presence of any combined valvular disease, peak aortic jet velocity ≥5 m/s and tricuspid regurgitation pressure gradient ≥40 mmHg, and negative risk factors included dyslipidemia, history of percutaneous coronary intervention and hemodialysis. Respective cumulative 5-year incidences of all-cause death and HF hospitalization in No HF, CHF and AHF groups were 37.1%, 41.8% and 61.8% (P<0.001) and 20.7%, 33.8% and 52.3% (P<0.001). Even in the initial aortic valve replacement (AVR) stratum, AHF was associated with excess 5-year mortality risk relative to No HF and CHF (adjusted hazard ratio [HR] 1.64; 95% confidence interval [CI]: 1.14–2.36, P=0.008; adjusted HR 1.47; 95% CI: 1.03–2.11, P=0.03, respectively).
Conclusions:
AHF complicating severe AS was associated with an extremely dismal prognosis, which could not be fully resolved by AVR. Careful management to avoid the development of AHF is crucial.
Aortic stenosis (AS) is one of the most common valvular heart diseases, especially in the elderly,1,2
so its prevalence is growing with aging of the general population.3
Patients with severe AS often develop heart failure (HF), which is an inflexion point in the natural history of AS.4
Some patients with severe AS initially present with symptoms of chronic HF (CHF), but others suffer from acute HF (AHF) as the initial manifestation of severe AS. A number of recent reports have comprehensively investigated the risk factors and prognosis of AHF in general,5–8
but there have been few studies specifically evaluating AHF complicating severe AS.9,10
Therefore, we sought to clarify the characteristics of severe AS patients who develop AHF, to evaluate the effect of AHF on short- and long-term clinical outcomes of severe AS patients according to the initial treatment strategies, and to identify the determinants of initial aortic valve replacement (AVR) strategy in patients with AHF in a large Japanese observational database of consecutive patients with severe AS.
Methods
Study Population
The study design and primary results of the CURRENT AS (Contemporary Outcomes After Surgery and Medical Treatment in Patients with Severe Aortic Stenosis) registry have been previously reported.11
Briefly, the CURRENT AS registry is a retrospective, multicenter registry that enrolled 3,815 consecutive patients with severe AS from among 27 centers in Japan between January 2003 and December 2011. We searched the hospital database of transthoracic echocardiography patients, and enrolled consecutive patients who met the definition of severe AS (peak aortic jet velocity [Vmax] >4.0 m/s, mean aortic pressure gradient [PG] >40 mmHg, or aortic valve area [AVA] <1.0 cm2) for the first time during the study period. Collection of clinical information, including symptoms (i.e., HF, angina and syncope), medical history, diagnostic imaging, laboratory markers and other patient characteristics, was conducted through hospital chart and database review. Presence of HF was confirmed at participating hospitals by reviewing the final diagnosis, HF-related signs or symptoms and clinical course. The protocol was approved by the institutional review board or ethics committee at all 27 participating centers (Appendix S1). Written informed consent was waived because of the retrospective nature of the study, and none of the patients refused to participate in the study when contacted for follow-up.
In the main analysis, 3,813 study patients were categorized into No HF (n=2,210) and HF group (n=1,603) based on the presence of HF symptoms at enrolment, excluding 2 patients whose symptomatic status was not available. There were a few patients who had had HF symptoms once before enrolment, but did not have any at enrolment. We categorized those patients into the No HF group according to the definition. Thereafter, the HF group was further divided into 2 groups: AHF and CHF. In this process, because AHF is a syndrome with a wide range of conditions and acuteness, we avoided subjective categorization by not defining AHF solely on the basis of the mode of presentation or symptom onset. Instead, to keep consistency throughout the data collection and analyses, we defined the AHF and CHF groups according to whether or not hospitalized management was required. As a result, 790 patients who developed symptoms of HF requiring hospitalized management at enrolment were categorized into the AHF group, and 813 patients who had HF symptoms but did not require hospitalization were categorized into the CHF group (Figure 1). The 3 groups were further stratified by the initial treatment strategies to either the initial AVR stratum or conservative stratum. Because of the distinct clinical course of the patients who had coronary artery disease (CAD), we performed a sensitivity analysis in which patients with CAD were excluded from the entire cohort. In this analysis, the remaining patients were divided into 2 groups: AHF and No AHF rather than 3 groups to counteract the potential ambiguity of categorization of No HF and CHF groups in the main analyses. Follow-up was commenced on the day of the index echocardiography, unless specified otherwise.
The primary outcome measures in the present analysis were all-cause death and HF hospitalization. Causes of death were classified according to VARC (Valve Academic Research Consortium) definitions, and adjudicated by a clinical event committee.12,13
HF hospitalization was defined as hospitalization for worsening HF requiring intravenous drug therapy. Other definitions of the clinical events have been described previously11, and clinical events were adjudicated by a clinical event committee (Appendix S1).
Statistical Analysis
Categorical variables are presented as numbers and percentages, and were compared with the chi-square test or Fisher’s exact test. Continuous variables are expressed as the mean and standard deviation or median and interquartile range (IQR). Continuous variables were compared using Student’s t test or Wilcoxon rank-sum test based on their distributions.
Independent risk factors for developing AHF and determinants of initial AVR strategy were identified among clinically relevant factors by means of univariate and multivariable logistic regression analyses, following the dichotomization of continuous variables by median values or clinically meaningful reference values. The risk factors for developing AHF in the entire cohort were analyzed by dividing the entire cohort into 2 groups: AHF (n=790) and No AHF (a combined group of CHF and No HF groups: n=3,023). The results are expressed as odds ratios (ORs) and their 95% confidence intervals (CIs).
Cumulative incidences of clinical events were estimated by the Kaplan-Meier method, and the differences among the groups were assessed with the log-rank test. The risks of AHF relative to No HF and CHF, respectively, for the clinical endpoints were estimated by Cox proportional hazard models and expressed as hazard ratios (HRs) and their 95% CIs. In consistent with our previous report,11
the 21 clinically relevant factors listed in
Table 1
were included as the risk-adjusting variable in the multivariable Cox proportional hazard models and the centers were incorporated as the stratification variable. All statistical analyses were performed with the statistical software program JMP 10.0.0 (SAS Institute Inc., Cary, NC, USA) or SAS 9.4 (SAS Institute). All reported P-values are 2-tailed; P<0.05 was considered statistically significant.
Table 1.
Baseline Characteristics According to HF Status in the Entire Cohort
| Variable |
No HF (n=2,210) |
CHF (n=813) |
AHF n=790) |
P value |
| Clinical characteristics |
| Age*, years |
76.7±9.5 |
76.7±9.9 |
81.8±9.1 |
<0.001 |
| ≥80 years |
897 (41) |
338 (42) |
494 (63) |
<0.001 |
| Male* |
896 (41) |
303 (37) |
244 (31) |
<0.001 |
| BMI, kg/m2 |
22.0±3.8 |
21.9±3.8 |
20.9±3.9 |
<0.001 |
| <22 kg/m2* |
1,281 (58) |
475 (58) |
570 (72) |
<0.001 |
| Hypertension* |
1,533 (69) |
569 (70) |
565 (72) |
0.51 |
| BSA, m2 |
1.47±0.18 |
1.46±0.19 |
1.40±0.19 |
<0.001 |
| Current smoking* |
125 (6) |
36 (4) |
35 (4) |
0.24 |
| History of smoking |
504 (23) |
172 (21) |
154 (19) |
0.14 |
| Dyslipidemia |
824 (37) |
288 (35) |
215 (27) |
<0.001 |
| On statin therapy* |
597 (27) |
212 (26) |
161 (20) |
0.001 |
| Diabetes mellitus |
537 (24) |
166 (20) |
194 (25) |
0.06 |
| On insulin therapy* |
119 (5) |
35 (4) |
34 (4) |
0.32 |
| CAD* |
656 (30) |
232 (29) |
246 (31) |
0.52 |
| Untreated significant coronary artery stenosis‡ |
343 (16) |
137 (17) |
153 (19) |
0.04 |
| Prior PCI |
340 (15) |
74 (9) |
88 (11) |
<0.001 |
| Prior CABG |
119 (5) |
51 (6) |
32 (4) |
0.13 |
| Prior MI* |
174 (8) |
60 (7) |
89 (11) |
0.006 |
| Prior open heart surgery |
190 (9) |
78 (10) |
51 (6) |
0.06 |
| Prior HF |
113 (5) |
297 (37) |
234 (30) |
<0.001 |
| Prior symptomatic stroke* |
304 (14) |
89 (11) |
109 (14) |
0.1 |
| History of atrial fibrillation or flutter* |
397 (18) |
212 (26) |
219 (28) |
<0.001 |
| Aortic/peripheral vascular disease* |
359 (16) |
107 (13) |
113 (14) |
0.08 |
| Serum creatinine, mg/dL* |
0.8 (0.7–1.2) |
0.9 (0.7–1.3) |
1 (0.8–1.5) |
<0.001 |
| >2 mg/dL without hemodialysis |
50 (2) |
38 (5) |
65 (8) |
<0.001 |
| Hemodialysis* |
262 (12) |
83 (10) |
60 (8) |
0.004 |
| Hemoglobin, g/dL |
12 (11–13) |
12 (10–13) |
11 (9–12) |
<0.001 |
| Anemia*,† |
1,088 (49) |
451 (55) |
578 (73) |
<0.001 |
| BNP, pg/mL§ |
135.6 (57.2–322.5) |
315.6 (132.1–787.8) |
839.2 (383.9–1,634.6) |
<0.001 |
| Liver cirrhosis (Child-Pugh B or C)* |
17 (1) |
12 (1) |
9 (1) |
0.2 |
| Malignancy |
333 (15) |
89 (11) |
94 (12) |
0.004 |
| Currently under treatment* |
105 (5) |
22 (3) |
22 (3) |
0.007 |
| Chronic lung disease |
199 (9) |
119 (15) |
82 (10) |
<0.001 |
| Moderate or severe* |
47 (2) |
35 (4) |
30 (4) |
0.002 |
| Logistic EuroSCORE, % |
8.2 (5.1–13.6) |
9.5 (5.5–15.6) |
16.7 (10.1–28.4) |
<0.001 |
| EuroSCORE II, % |
2.4 (1.4–3.5) |
3.0 (1.8–4.5) |
6.1 (3.8–10.2) |
<0.001 |
| STS score (PROM), % |
3.2 (2.0–5.1) |
3.5 (2.1–5.7) |
7.1 (4.3–11.7) |
<0.001 |
| Symptoms at index echocardiography |
| Asymptomatic |
1,808 (82) |
0 (0) |
0 (0) |
<0.001 |
| Chest pain |
299 (14) |
106 (13) |
93 (12) |
0.5 |
| Syncope |
136 (6) |
27 (3) |
35 (4) |
0.004 |
| Etiology of aortic stenosis |
|
|
|
<0.001 |
| Degenerative |
1,941 (88) |
704 (87) |
732 (93) |
|
| Congenital (Unicuspid, Bicupsid, or Quadricupsid) |
174 (8) |
57 (7) |
23 (3) |
|
| Rheumatic |
74 (3) |
46 (6) |
30 (4) |
|
| Infective endocarditis |
4 (0.2) |
0 (0) |
3 (0.4) |
|
| Other |
17 (0.8) |
6 (0.7) |
2 (0.3) |
|
| Echocardiographic variables |
| Vmax, m/s |
4.0±0.9 |
4.4±0.9 |
4.2±1.0 |
<0.001 |
| >5 m/s |
306 (14) |
217 (27) |
174 (22) |
<0.001 |
| >4 m/s* |
1,153 (52) |
563 (69) |
468 (59) |
<0.001 |
| Peak aortic PG, mmHg |
68±29 |
81±33 |
74±34 |
<0.001 |
| Mean aortic PG, mmHg |
38±18 |
47±21 |
42±21 |
<0.001 |
| AVA (equation of continuity), cm2 |
0.76±0.2 |
0.68±0.18 |
0.65±0.19 |
<0.001 |
| AVA index, cm2/m2 |
0.52±0.12 |
0.47±0.13 |
0.47±0.15 |
<0.001 |
| Low-gradient AS|| |
1,048 (47) |
246 (30) |
320 (41) |
<0.001 |
| LV end-diastolic diameter, mm |
45±6 |
47±7 |
48±8 |
<0.001 |
| LV end-systolic diameter, mm |
28±6 |
31±9 |
34±9 |
<0.001 |
| LVEF, %* |
66±11 |
61±14 |
55±16 |
<0.001 |
| <40% |
62 (3) |
78 (10) |
153 (19) |
<0.001 |
| <50% |
163 (7) |
151 (19) |
279 (35) |
<0.001 |
| <60% |
423 (19) |
283 (35) |
447 (57) |
<0.001 |
| IVST in diastole, mm |
11.2±2.2 |
11.6±2.3 |
11.5±2.4 |
<0.001 |
| PWT in diastole, mm |
10.8±2.0 |
11.2±2.0 |
11.1±2.2 |
<0.001 |
Any combined valvular disease
(moderate or severe)* |
680 (31) |
402 (49) |
475 (60) |
<0.001 |
| AR |
365 (17) |
209 (26) |
216 (27) |
<0.001 |
| MS |
56 (3) |
47 (6) |
30 (4) |
<0.001 |
| MR |
267 (12) |
196 (24) |
300 (38) |
<0.001 |
| TR |
249 (11) |
163 (20) |
216 (27) |
<0.001 |
| TRPG, mmHg |
30±10 |
34±14 |
38±14 |
<0.001 |
| ≥40 mmHg* |
205 (9) |
172 (21) |
229 (29) |
<0.001 |
| Clinical presentation at index UCG |
| NYHA class# |
|
|
|
<0.001 |
| I |
2,210 (100) |
|
|
|
| II |
|
711 (87) |
135 (17) |
|
| III |
|
91 (11) |
270 (34) |
|
| IV |
|
|
373 (47) |
|
| III or IV |
0 (0) |
91 (11) |
643 (81) |
<0.001 |
| Atrial fibrillation or flutter |
239 (11) |
133 (16) |
146 (18) |
<0.001 |
| Pace maker rhythm |
56 (3) |
22 (3) |
21 (3) |
0.96 |
| Non-invasive ventilation |
0 (0) |
2 (0.3) |
75 (9) |
<0.001 |
| Intubation |
0 (0) |
1 (0) |
38 (5) |
<0.001 |
| Inotrope use |
0 (0) |
2 (0.3) |
76 (10) |
<0.001 |
| IABP/PCPS |
0 (0) |
0 (0) |
17 (2) |
<0.001 |
| Cardiogenic shock |
0 (0) |
0 (0) |
32 (4) |
<0.001 |
| Resuscitation |
0 (0) |
0 (0) |
12 (2) |
<0.001 |
| Acute MI |
25 (1) |
4 (0.5) |
32 (4) |
<0.001 |
| Therapeutic strategy |
| Initial AVR |
537 (24) |
389 (48) |
270 (34) |
<0.001 |
| Conservative |
1,673 (76) |
424 (52) |
520 (66) |
<0.001 |
Values are mean±SD, median (interquartile range), or number (%). *Potential risk-adjusting variables selected for Cox proportional hazards models. †Anemia as defined by the World Health Organization criteria (hemoglobin <12.0 g/dL in women; <13.0 g/dL in men). ‡Coronary angiography was performed in 982 (44%) patients in the No HF group, 484 (60%) patients in the CHF group, and 378 (48%) patients in the AHF group. §B-type natriuretic peptide values obtained in 1,824 (47.8%) patients (No HF group: n=910 [41%], CHF group: n=455 [56%], AHF group: n=459 [58%]). ||Vmax <4.0 m/s and mean aortic PG <40 mmHg, but AVA <1.0 cm2. #Data not available in 23 (0.6%) patients. AHF, acute HF; AR, aortic regurgitation; AS, aortic stenosis; AVA, aortic valve area; AVR, aortic valve replacement; BMI, body mass index; BSA, body surface area; CABG, coronary artery bypass grafting; CAD, coronary artery disease; CHF, chronic HF; HF, heart failure; IABP, intra-aortic balloon pumping; IVST, interventricular septum thickness; LV, left ventricular; LVEF, LV ejection fraction; MI, myocardial infarction; MR, mitral regurgitation; MS, mitral stenosis; NYHA, New York Heart Association; PCI, percutaneous coronary intervention; PCPS, percutaneous cardiopulmonary support; PG, pressure gradient; PROM, predicted risk of mortality; PWT, posterior wall thickness; STS, Society of Thoracic Surgeons; TRPG, tricuspid regurgitation pressure gradient; Vmax, peak aortic jet velocity.
Results
Baseline Characteristics
According to the baseline characteristics of the 3 groups, patients in the AHF group were characterized by older age, smaller body mass index (BMI), and higher prevalence of women, untreated significant coronary artery stenosis, prior myocardial infarction, atrial fibrillation/flutter, renal dysfunction, and anemia (Table 1). The values for B-type natriuretic peptide (BNP) level obtained in 1,824 patients were significantly higher in the AHF group than in the CHF and No HF groups (Table 1). Proportion of patients with chest pain was not different among the 3 groups, although patients with syncope were more often found in the No HF group. Regarding the echocardiographic parameters, the prevalence of very severe AS, defined as Vmax
≥5 m/s, was higher in the CHF and AHF groups than in the No HF group. The AHF group had lower left ventricular ejection fraction (LVEF), higher prevalence of concomitant valvular diseases, and higher tricuspid regurgitation pressure gradient (TRPG) than the CHF and No HF groups (Table 1). In terms of clinical presentation, 81% of patients in the AHF group were in NYHA class III or IV, 14% required respiratory support and 10% required inotrope use.
In the entire study population, an initial AVR strategy was selected in 1,196 patients (31%), and the remaining 2,617 patients were managed conservatively. Patients in the AHF group were less often referred to an initial AVR strategy than patients in the CHF group. Surgical risk scores were significantly higher in the AHF group than in the CHF and No HF groups (Table 1).
Risk Factors for Developing AHF
The independent risk factors for developing AHF included advanced age, female sex, lower BMI, presence of untreated coronary artery stenosis, history of prior HF and anemia in addition to echocardiographic parameters of Vmax
≥5 m/s, LVEF <50%, coexistence of any combined valvular disease, and TRPG ≥40 mmHg; the negative predictors included dyslipidemia, prior history of percutaneous coronary intervention and hemodialysis (Table 2).
Table 2.
Risk Factors for Developing AHF
| Variables |
Univariate analysis |
Multivariable analysis |
| AHF |
OR |
P value |
OR |
95% CI |
P value |
| Yes [n=790] |
No [n=3,023] |
| Clinical characteristics |
| Age ≥80 years |
494 (63) |
1,233 (41) |
2.42 |
<0.001 |
1.69 |
1.39–2.05 |
<0.001 |
| Male |
244 (31) |
1,199 (40) |
0.68 |
<0.001 |
0.69 |
0.56–0.84 |
<0.001 |
| BMI <22 kg/m2 |
570 (72) |
1,755 (58) |
1.87 |
<0.001 |
1.29 |
1.05–1.57 |
0.01 |
| Hypertension |
565 (72) |
2,101 (69) |
1.10 |
0.27 |
1.20 |
0.98–1.47 |
0.08 |
| Current smoking |
35 (4) |
161 (5) |
0.82 |
0.3 |
1.30 |
0.84–1.96 |
0.24 |
| Dyslipidemia |
215 (27) |
1,112 (37) |
0.64 |
<0.001 |
0.73 |
0.60–0.90 |
0.003 |
| Diabetes on insulin therapy |
34 (4) |
154 (5) |
0.84 |
0.36 |
0.95 |
0.61–1.46 |
0.82 |
| Untreated coronary artery stenosis* |
153 (19) |
480 (16) |
1.27 |
0.02 |
1.55 |
1.21–1.98 |
<0.001 |
| Prior HF |
234 (30) |
410 (14) |
2.68 |
<0.001 |
1.46 |
1.17–1.81 |
<0.001 |
| Prior MI |
89 (11) |
234 (8) |
1.51 |
0.002 |
1.21 |
0.85–1.71 |
0.3 |
| Prior PCI |
88 (11) |
414 (14) |
0.79 |
0.06 |
0.69 |
0.49–0.95 |
0.02 |
| Prior CABG |
32 (4) |
170 (6) |
0.71 |
0.07 |
0.64 |
0.40–1.01 |
0.06 |
| Prior symptomatic stroke |
109 (14) |
394 (13) |
1.07 |
0.57 |
0.92 |
0.70–1.19 |
0.5 |
| History of atrial fibrillation or flutter |
219 (28) |
609 (20) |
1.52 |
<0.001 |
1.16 |
0.94–1.43 |
0.2 |
Creatinine level >2 mg/dL without
hemodialysis |
65 (8) |
88 (3) |
3.00 |
<0.001 |
1.43 |
0.97–2.09 |
0.07 |
| Hemodialysis |
60 (8) |
345 (11) |
0.64 |
0.001 |
0.50 |
0.35–0.69 |
<0.001 |
| Anemia† |
578 (73) |
1,538 (51) |
2.63 |
<0.001 |
2.07 |
1.70–2.52 |
<0.001 |
Chronic lung disease
(moderate or severe) |
30 (4) |
82 (3) |
1.42 |
0.12 |
1.27 |
0.78–2.00 |
0.33 |
| Echocardiographic variables |
| Vmax ≥5 m/s |
174 (22) |
523 (17) |
1.35 |
0.003 |
1.45 |
1.16–1.80 |
<0.001 |
| LVEF <50% |
279 (35) |
314 (10) |
4.71 |
<0.001 |
4.88 |
3.91–6.10 |
<0.001 |
Any combined valvular disease
(moderate or severe) |
475 (60) |
1,082 (36) |
2.70 |
<0.001 |
1.85 |
1.53–2.24 |
<0.001 |
| TRPG ≥40 mmHg |
229 (29) |
377 (12) |
2.90 |
<0.001 |
1.73 |
1.38–2.15 |
<0.001 |
Values are number (%). *Coronary angiography was performed in 378 (48%) patients in the AHF group and 1,466 (49%) patients in the No AHF group. †Anemia as defined by the World Health Organization criteria (hemoglobin <12.0 g/dL in women; <13.0 g/dL in men). CI, confidence interval; OR, odds ratio. Other abbreviations as in Table 1.
Among the 1,196 patients who were assigned to an initial AVR strategy, 1,173 (98.1%) actually underwent surgical AVR (n=1,162) or transcatheter aortic valve implantation (TAVI: n=11). The median interval between the index echocardiography and the AVR procedure was 36 days (IQR: 16–61). Among the 2,617 patients who were initially assigned to a conservative strategy, 569 (21.7%) eventually underwent surgical AVR (n=541) or TAVI (n=29) with a median interval of 838 days (IQR: 307–1,308) from the index echocardiography. Therefore, during a median follow-up duration of 1,123 days (IQR: 559–1,577), 1743 patients (45.7%) actually underwent surgical AVR (n=1703) or TAVI (n=40). The cumulative 5-year incidence of surgical AVR or TAVI was smaller in the AHF group than in the CHF group (Figure 2A,B). Notably, in the AHF group, surgical AVR was very rarely performed beyond 6 months after the index echocardiography. There were 17 patients for whom AVR or TAVI was performed as an emergency (no delay in providing operative intervention; n=3), urgently (surgery within 24 h of referral, n=12) or as a salvage (cardiopulmonary resuscitation en route to operating theatre or during anesthesia; n=2). Patients in the AHF group showed higher prevalence of emergency/urgent/salvage status as compared with the other groups (0.6% vs. 0.6% vs. 2.6% in the No HF, CHF and AHF groups, respectively, P=0.02).

The cumulative incidences of all-cause death and HF hospitalization were markedly higher in the AHF group than in the CHF and No HF groups (Figure 3, Table 3). After adjusting confounders, the excess risks of AHF relative to CHF and No HF, respectively, for all-cause death and HF hospitalization remained highly significant (Table 3). Similarly, the risks for other endpoints such as cardiovascular death, aortic valve-related death, and sudden death were significantly higher in the AHF group than in the CHF and No HF groups (Table 3).

Table 3.
Crude and Adjusted Effects of AHF Relative to No HF or CHF for Long-Term Clinical Outcomes
| |
No HF |
CHF |
AHF |
Log-rank
P value |
AHF vs. No HF |
AHF vs. CHF |
Total no. of patients
with at least 1 event
(cumulative 5-year
incidence) (%) |
Crude HR
(95% CI) |
P value |
Adjusted
HR
(95% CI) |
P value |
Crude
HR
(95% CI) |
P value |
Adjusted
HR
(95% CI) |
P value |
| Entire cohort: n=3,813 (No HF: 2,210, CHF: 813, AHF: 790) |
| All-cause death |
703
(37.1) |
304
(41.8) |
441
(61.8) |
<0.001 |
2.34
(2.08–
2.63) |
<0.001 |
1.83
(1.59–
2.10) |
<0.001 |
1.91
(1.65–
2.21) |
<0.001 |
1.43
(1.22–
1.67) |
<0.001 |
Cardiovascular
death |
426
(24.8) |
201
(29.9) |
325
(49.2) |
<0.001 |
2.83
(2.44–
3.26) |
<0.001 |
2.05
(1.73–
2.43) |
<0.001 |
2.11
(1.77–
2.52) |
<0.001 |
1.55
(1.29–
1.87) |
<0.001 |
Aortic valve-related
death |
253
(16.1) |
113
(17.4) |
243
(39.2) |
<0.001 |
3.53
(2.96–
4.21) |
<0.001 |
2.64
(2.14–
3.27) |
<0.001 |
2.79
(2.24–
3.50) |
<0.001 |
2.02
(1.59–
2.55) |
<0.001 |
| Sudden death* |
108
(6.7) |
35
(5.2) |
53
(11.4) |
<0.001 |
1.81
(1.29–
2.50) |
<0.001 |
NA |
NA |
1.97
(1.29–
3.05) |
0.002 |
NA |
NA |
Noncardiovascular
death* |
278
(16.4) |
103
(16.5) |
116
(24.7) |
<0.001 |
1.58
(1.27–
1.96) |
<0.001 |
NA |
NA |
1.51
(1.16–
1.97) |
0.002 |
NA |
NA |
| HF hospitalization |
344
(20.7) |
200
(33.8) |
268
(52.3) |
<0.001 |
3.30
(2.81–
3.86) |
<0.001 |
2.60
(2.15–
3.15) |
<0.001 |
1.87
(1.56–
2.25) |
<0.001 |
1.26
(1.04–
1.53) |
0.02 |
Aortic valve-related
death or HF
hospitalization |
465
(26.5) |
241
(37.6) |
366
(39.5) |
<0.001 |
3.22
(2.81–
3.70) |
<0.001 |
2.65
(2.25–
3.12) |
<0.001 |
2.07
(1.76–
2.44) |
<0.001 |
1.51
(1.27–
1.79) |
<0.001 |
| Conservative group: n=2,617 (No HF: 1,673, CHF: 424, AHF: 520) |
| All-cause death |
620
(43.4) |
228
(57.2) |
365
(75.3) |
<0.001 |
2.85
(2.50–
3.24) |
<0.001 |
1.84
(1.58–
2.15) |
<0.001 |
1.74
(1.47–
2.95) |
<0.001 |
1.36
(1.14–
1.63) |
<0.001 |
Cardiovascular
death |
373
(29.5) |
153
(43.8) |
275
(63.2) |
<0.001 |
3.55
(3.03–
4.15) |
<0.001 |
2.15
(1.78–
2.59) |
<0.001 |
1.95
(1.60–
2.38) |
<0.001 |
1.50
(1.22–
1.86) |
<0.001 |
Aortic valve-related
death |
228
(20.2) |
93
(29.5) |
220
(55.7) |
<0.001 |
4.66
(3.87–
5.61) |
<0.001 |
2.90
(2.31–
3.63) |
<0.001 |
2.58
(2.03–
3.30) |
<0.001 |
1.98
(1.54–
2.56) |
<0.001 |
| Sudden death* |
97
(7.9) |
25
(7.1) |
47
(16.5) |
<0.001 |
2.31
(1.62–
3.26) |
<0.001 |
NA |
NA |
2.03
(1.26–
3.34) |
0.003 |
NA |
NA |
Noncardiovascular
death* |
247
(19.6) |
75
(22.6) |
90
(32.9) |
<0.001 |
1.77
(1.39–
2.25) |
<0.001 |
NA |
NA |
1.31
(0.97–
1.79) |
0.08 |
NA |
NA |
| HF hospitalization |
320
(26.4) |
160
(54.4) |
230
(70.4) |
<0.001 |
4.35
(3.67–
5.16) |
<0.001 |
2.49
(2.03–
3.06) |
<0.001 |
1.68
(1.38–
2.06) |
<0.001 |
1.22
(0.98–
1.51) |
0.08 |
Aortic valve-related
death or HF
hospitalization |
417
(32.5) |
183
(57.7) |
307
(77.9) |
<0.001 |
4.31
(3.71–
5.00) |
<0.001 |
2.75
(2.30–
3.29) |
<0.001 |
1.92
(1.60–
2.31) |
<0.001 |
1.21
(1.47–
1.79) |
<0.001 |
| Initial AVR group: n=1,196 (No HF: 537, CHF: 389, AHF: 270) |
| All-cause death |
84
(17.3) |
76
(25.2) |
76
(33.0) |
<0.001 |
2.12
(1.55–
2.89) |
<0.001 |
1.64
(1.14–
2.36) |
0.008 |
1.63
(1.18–
2.24) |
0.003 |
1.47
(1.03–
2.11) |
0.03 |
Cardiovascular
death |
53
(11.1) |
48
(16.3) |
50
(22.8) |
<0.001 |
2.16
(1.47–
3.18) |
<0.001 |
1.49
(0.95–
2.35) |
0.08 |
1.66
(1.12–
2.47) |
0.01 |
1.44
(0.92–
2.27) |
0.1 |
Aortic valve-related
death |
25
(5.0) |
20
(5.5) |
23
(9.0) |
0.04 |
1.96
(1.11–
3.46) |
0.02 |
1.15
(0.58–
2.27) |
0.7 |
1.74
(0.95–
3.19) |
0.07 |
1.30
(0.65–
2.60) |
0.5 |
| Sudden death* |
11
(3.0) |
10
(3.5) |
6
(4.3) |
0.8 |
1.25
(0.43–
3.28) |
0.67 |
NA |
NA |
0.95
(0.32–
2.57) |
0.9 |
NA |
NA |
Aortic valve
procedure-related
death* |
18
(3.3) |
15
(4.0) |
17
(6.8) |
0.1 |
2.00
(1.02–
3.90) |
0.04 |
NA |
NA |
1.70
(0.85–
3.45) |
0.1 |
NA |
NA |
Noncardiovascular
death* |
31
(7.0) |
28
(10.7) |
26
(13.1) |
0.02 |
2.04
(1.20–
3.43) |
0.009 |
NA |
NA |
1.58
(0.92–
2.70) |
0.1 |
NA |
NA |
| HF hospitalization |
24
(4.8) |
40
(13.9) |
38
(23.2) |
<0.001 |
3.89
(2.33–
6.49) |
<0.001 |
3.20
(1.75–
5.83) |
<0.001 |
1.58
(1.01–
2.47) |
0.04 |
1.35
(0.81–
2.27) |
0.3 |
Aortic valve-related
death and HF
hospitalization |
48
(10.1) |
58
(18.0) |
59
(27.5) |
<0.001 |
2.86
(2.00–
4.19) |
<0.001 |
2.00
(1.29–
3.11) |
0.002 |
1.63
(1.13–
2.34) |
0.009 |
1.36
(0.90–
2.05) |
0.1 |
*Multivariable analysis was not performed because of insufficient number of patients with event. HR, hazard ratio; NA, not assessed. Other abbreviations as in Table 1.
Regardless of the initial treatment strategy (initial AVR or conservative), the cumulative incidences of all-cause death and HF hospitalization were markedly higher in the AHF group than in the CHF and No HF groups, although the outcomes of AHF patients were remarkably better in the AVR stratum than those in the conservative stratum (Figure 4, Table 3). Even after adjusting for confounders, the excess risks of AHF relative to No HF for all-cause death and HF hospitalization remained highly significant in both the initial AVR and conservative strata (Table 3). The excess adjusted risk of AHF relative to CHF remained significant for all-cause death, but was no more significant for HF hospitalization in both the initial AVR and conservative strata (Table 3).
Determinants of the Choice for Initial AVR Strategy in the AHF Group
Initial AVR strategy, as opposed to a conservative strategy, was more likely to be chosen for AHF patients with low surgical risk scores (logistic EuroSCORE: 13.7 [IQR: 8.4–23.4]% vs. 18.3 [IQR: 11.4–30.5]%, P<0.001; EuroSCORE II: 5.3 [IQR: 2.9–8.8]% vs. 6.7 [IQR: 4.3–11.6]%, P<0.001; STS score: 6.3 [IQR: 3.7–10.4]% vs. 8.1 [IQR: 4.9–12.5]%, P<0.001). The independent predisposing factors for the choice of initial AVR strategy included very severe AS with Vmax
≥5 m/s, while the independent predisposing factors for the choice of conservative strategy included advanced age, low BMI, hypertension, prior history of HF, prior history of coronary artery bypass grafting (CABG), liver cirrhosis, moderate to severe lung disease, and TRPG ≥40 mmHg (Table 4).
Table 4.
Determinants of Initial AVR Strategy in AHF Group
| Variables |
Univariate analysis |
Multivariate analysis |
Initial AVR
(n=270) |
Conservative
(n=520) |
OR [Initial
AVR vs.
conservative] |
P value |
OR [Initial
AVR vs.
conservative] |
95% CI |
P value |
| Clinical characteristics |
| Age ≥80 years |
93 (34) |
401 (77) |
0.16 |
<0.001 |
0.14 |
0.09–0.21 |
<0.001 |
| Male |
110 (41) |
134 (26) |
1.98 |
<0.001 |
1.41 |
0.94–2.11 |
0.1 |
| BMI <22 kg/m2 |
171 (63) |
399 (77) |
0.52 |
<0.001 |
0.63 |
0.42–0.96 |
0.03 |
| Hypertension |
174 (64) |
391 (75) |
0.6 |
0.002 |
0.57 |
0.38–0.86 |
0.007 |
| Current smoking |
19 (7) |
16 (3) |
2.38 |
0.01 |
0.85 |
0.35–2.05 |
0.71 |
| Dyslipidemia |
85 (31) |
130 (25) |
1.38 |
0.05 |
1.5 |
0.99–2.27 |
0.06 |
| Diabetes on insulin therapy |
13 (5) |
21 (4) |
1.2 |
0.61 |
1.29 |
0.52–3.07 |
0.57 |
| Prior HF |
42 (16) |
192 (37) |
0.31 |
<0.001 |
0.31 |
0.20–0.48 |
<0.001 |
| Prior MI |
20 (7) |
69 (13) |
0.52 |
0.01 |
0.73 |
0.36–1.45 |
0.37 |
| Prior PCI |
21 (8) |
67 (13) |
0.57 |
0.03 |
0.67 |
0.32–1.35 |
0.26 |
| Prior CABG |
5 (2) |
27 (5) |
0.34 |
0.02 |
0.29 |
0.08–0.87 |
0.03 |
| Prior symptomatic stroke |
24 (9) |
85 (16) |
0.5 |
0.003 |
0.87 |
0.48–1.53 |
0.63 |
| History of atrial fibrillation or flutter |
55 (20) |
164 (32) |
0.56 |
<0.001 |
0.65 |
0.42–1.0 |
0.052 |
| Aortic/peripheral vascular disease |
44 (16) |
69 (13) |
1.27 |
0.25 |
1.33 |
0.77–2.27 |
0.31 |
Creatinine level >2 mg/dL without
hemodialysis |
5 (2) |
60 (12) |
0.14 |
<0.001 |
0.58 |
0.27–1.20 |
0.15 |
| Hemodialysis |
28 (10) |
32 (6) |
1.76 |
0.04 |
0.81 |
0.41–1.58 |
0.54 |
| Anemia* |
165 (61) |
413 (79) |
0.41 |
<0.001 |
0.83 |
0.56–1.25 |
0.38 |
| Liver cirrhosis |
1 (0.4) |
8 (2) |
0.23 |
0.11 |
0.05 |
0.002–0.37 |
0.002 |
| Malignancy currently under treatment |
8 (3) |
14 (3) |
1.1 |
0.83 |
0.87 |
0.28–2.52 |
0.8 |
Chronic lung disease
(moderate or severe) |
6 (2) |
24 (5) |
0.47 |
0.08 |
0.32 |
0.1–0.9 |
0.03 |
| Echocardiographic variables |
| Vmax ≥5 m/s |
89 (33) |
85 (16) |
2.52 |
<0.001 |
2.65 |
1.72–4.12 |
<0.001 |
| LVEF <50% |
109 (40) |
170 (33) |
1.39 |
0.03 |
1.42 |
0.96–2.10 |
0.08 |
Any combined valvular disease
(moderate or severe) |
148 (55) |
327 (63) |
0.72 |
0.03 |
1.01 |
0.69–1.49 |
0.95 |
| TRPG ≥40 m/s |
64 (24) |
165 (32) |
0.67 |
0.02 |
0.63 |
0.41–0.96 |
0.03 |
Values are number (%). *Anemia as defined by the World Health Organization criteria (hemoglobin <12.0 g/dL in women; <13.0 g/dL in men). Abbreviations as in Tables 1,2.
When patients who had CAD were excluded from the entire cohort and the remaining patients were divided into 2 groups [viz. AHF group (n=544) and No AHF group (n=2,137)], cumulative 5-year incidences of all-cause death and HF hospitalization were markedly higher in the AHF group as compared with the No AHF group, confirming the dismal prognosis of AHF associated with severe AS observed in the main analysis (all-cause death: 59.1% vs. 36.0%, P<0.001, HF hospitalization: 48.8% vs. 21.2% in the AHF group and No AHF group, respectively) (Figure S1A,B).
Discussion
The main findings in the present study were as follows: (1) the prognosis of patients with severe AS complicated by AHF was poor, with extremely high rates of all-cause death and HF hospitalization; (2) AHF patients as compared with CHF patients less frequently underwent AVR, and had higher long-term mortality rates even after AVR; (3) several clinical and echocardiographic factors were found to predispose to the development of AHF, which might help identify appropriate candidates for early AVR before the emergence of AHF.
Large-scale cohort studies in this decade have demonstrated that AHF in general is disruptive with high mortality and morbidity.5–8
Management of AHF complicating severe AS is particularly challenging because patients easily develop severe congestion or acute decline in cardiac output because of high afterload and an obstructive valve. Serious clinical conditions from multiple comorbidities may also contribute to the worse prognosis of AHF complicating severe AS. Furthermore, AHF may be evoked as a result of long-standing high afterload in the left ventricle in patients with severe AS. For those patients, irreversible pathological changes caused by high mechanical stress may lead to a sustained high risk of adverse events even after AVR. Indeed, using cardiac magnetic resonance imaging, Barone et al reported that approximately 30% of patients with AS showed focal replacement myocardial fibrosis before AVR, which had postoperative and long-term prognostic value.14
Therefore, once AHF develops in patients with severe AS, it often leads to a dismal outcome regardless of the chosen therapeutic strategies. To improve the clinical outcomes of patients with severe AS, an early AVR strategy before emergence of AHF is warranted.
Factors Associated With Development of AHF Complicating Severe AS
Regarding clinical symptoms, we found that patients with syncope were less often found in the AHF group as compared with the No HF group. This reflects the complex pathophysiology of severe AS in which a narrowed aortic valve causes distinct clinical manifestations such as elevated global LV afterload, decreased tissue perfusion, inappropriate reflex vasodilation and primary cardiac arrhythmia.15
Very severe AS with Vmax
≥5 m/s and low LVEF were among the echocardiographic parameters related to development of AHF. This result is consistent with previous reports showing that asymptomatic patients with very severe AS and/or low LVEF showed a poor prognosis and supports the current recommendation of AVR in asymptomatic patients with very severe AS and/or low LVEF.16–18
Prevalence of anemia in the AHF group was 73%, which was much higher than in the CHF group (55%) or in a previous report on patients with severe AS (57%).19
The link between anemia and poor outcome in HF is well established.20,21
Several underlying mechanisms, such as iron deficiency, chronic kidney disease (CKD) and bone marrow dysfunction, have been postulated as the background for anemia in patients with congestive HF.22–24
Heyde’s syndrome could also be an important mechanism for anemia in patients with severe AS.25
Correction of anemia might be a therapeutic option in the medical management of severe AS.
Our study also identified lower BMI as a risk factor for developing AHF. One possible explanation for this is that lower BMI in our study represented ‘cardiac cachexia’ in which metabolic, neurohormonal and immune abnormalities evoked by hemodynamic alteration lead to negative energy balance and poor prognosis.26,27
Alternatively, the result may be related to the protective effect of adiposity known as the ‘obesity paradox’, although its validity is still under debate.28–30
CKD is a well-established risk factor of HF.31,32
In the present study, although an elevated creatinine level showed a trend towards being related to the development of AHF, hemodialysis was a negative predictor for developing AHF. Strict body fluid control under hemodialysis may cancel the potential risk of acute congestion with CKD. Nonetheless, advanced CKD is known to be associated with a rapid progression of AS and poor outcome after surgical AVR or TAVI.33–36
Further studies of better risk stratification and treatment strategy in this high-risk category are needed.
Decision-Making for Patients With AHF Complicating Severe AS
Advanced age, low BMI, hypertension, prior history of HF, prior history of CABG, liver cirrhosis, moderate to severe lung disease, and TRPG ≥40 mmHg were identified as independent predisposing factors to the choice of a conservative strategy. Some patients with these factors might have been deemed to be inoperable. However, considering the present results of a dismal prognosis in conservatively managed patients, careful assessment of the operative risks and clinical benefits of AVR among these high-risk patients is required. It should be acknowledged that most of the data in the present study were from the period before the introduction of TAVI. Further studies are needed to evaluate whether this less-invasive strategy could improve the prognosis of patients with severe AS complicated by AHF.
Study Limitations
In this study, a significant proportion of patients were enrolled as severe AS based solely on AVA <1.0 cm2. Those patients with low-gradient AS might well represent a heterogeneous population in whom the indication of AVR is still controversial. However, excluding patients with low-gradient AS would be inappropriate in evaluating severe AS patients with AHF, because transaortic PG tends to decrease with worsening LV pump function.37
Second, because of the retrospective study design, not all the information regarding biomarkers, hemodynamic parameters and medications possibly related to AHF were available.38–40
Third, retrospectively confirming the diagnosis of CHF and AHF based on the types of symptoms could potentially lead to incomplete or inaccurate categorization. Therefore, we categorized AHF and CHF according to whether or not hospitalized management was required to avoid the ambiguity of symptom-based categorization. Our results for NYHA and BNP, which were closely related with the time course and severity of HF, were consistent with the previous large cohorts of AHF.38,41
Furthermore, we consistently found a dismal prognosis of AHF associated with severe AS in the sensitivity analysis. Therefore, we believe that the patients in each group would appropriately represent the clinical profiles of AHF, CHF, and No HF associated with severe AS. Fourth, the low prevalence of an initial AVR strategy in AHF patients would indicate suboptimal practice non-compliant with current guidelines, although it may well represent real clinical practice.18
Finally, it should also be acknowledged that the risk factors identified as predisposing to AHF did not disclose causality.
Conclusions
In this observational registry of patients with severe AS, AHF was associated with a dismal prognosis with extremely high mortality rate, which could not be fully resolved by AVR after AHF. Careful management to avoid development of AHF is crucial for patients with severe AS.
Sources of Funding
This work was supported by an educational grant from the Research Institute for Production Development (Kyoto, Japan).
Supplementary Files
Supplementary File 1
Supplementary Methods
Appendix S1. List of Investigators
Figure S1.
Sensitivity analysis.
Please find supplementary file(s);
http://dx.doi.org/10.1253/circj.CJ-17-0610
References
- 1.
Dunning J, Gao H, Chambers J, Moat N, Murphy G, Pagano D, et al. Aortic valve surgery: Marked increases in volume and significant decreases in mechanical valve use: An analysis of 41,227 patients over 5 years from the Society for Cardiothoracic Surgery in Great Britain and Ireland National database. J Thorac Cardiovasc Surg 2011; 142: 776–782.e773.
- 2.
Iung B, Baron G, Butchart EG, Delahaye F, Gohlke-Barwolf C, Levang OW, et al. A prospective survey of patients with valvular heart disease in Europe: The Euro Heart Survey on Valvular Heart Disease. Eur Heart J 2003; 24: 1231–1243.
- 3.
Osnabrugge RL, Mylotte D, Head SJ, Van Mieghem NM, Nkomo VT, LeReun CM, et al. Aortic stenosis in the elderly: Disease prevalence and number of candidates for transcatheter aortic valve replacement: A meta-analysis and modeling study. J Am Coll Cardiol 2013; 62: 1002–1012.
- 4.
Ross J Jr, Braunwald E. Aortic stenosis. Circulation 1968; 38: 61–67.
- 5.
Curtis LH, Greiner MA, Hammill BG, DiMartino LD, Shea AM, Hernandez AF, et al. Representativeness of a national heart failure quality-of-care registry: Comparison of OPTIMIZE-HF and non-OPTIMIZE-HF Medicare patients. Circ Cardiovasc Qual Outcomes 2009; 2: 377–384.
- 6.
Fonarow GC, Adams KF Jr, Abraham WT, Yancy CW, Boscardin WJ; ADHERE Scientific Advisory Committee, Study Group, and Investigators. Risk stratification for in-hospital mortality in acutely decompensated heart failure: Classification and regression tree analysis. JAMA 2005; 293: 572–580.
- 7.
Mebazaa A, Gayat E, Lassus J, Meas T, Mueller C, Maggioni A, et al. Association between elevated blood glucose and outcome in acute heart failure: Results from an international observational cohort. J Am Coll Cardiol 2013; 61: 820–829.
- 8.
Sato N, Kajimoto K, Asai K, Mizuno M, Minami Y, Nagashima M, et al. Acute decompensated heart failure syndromes (ATTEND) registry. A prospective observational multicenter cohort study: Rationale, design, and preliminary data. Am Heart J 2010; 159: 949–955.e941.
- 9.
Pierard S, de Meester C, Seldrum S, Pasquet A, Gerber B, Vancraeynest D, et al. Impact of preoperative symptoms on postoperative survival in severe aortic stenosis: Implications for the timing of surgery. Ann Thorac Surg 2014; 97: 803–809.
- 10.
Kawase Y, Kadota K, Nakamura M, Tada T, Hata R, Miyawaki H, et al. Low systolic blood pressure on admission predicts mortality in patients with acute decompensated heart failure due to moderate to severe aortic stenosis. Circ J 2014; 78: 2455–2459.
- 11.
Taniguchi T, Morimoto T, Shiomi H, Ando K, Kanamori N, Murata K, et al. Initial surgical versus conservative strategies in patients with asymptomatic severe aortic stenosis. J Am Coll Cardiol 2015; 66: 2827–2838.
- 12.
Leon MB, Piazza N, Nikolsky E, Blackstone EH, Cutlip DE, Kappetein AP, et al. Standardized endpoint definitions for Transcatheter Aortic Valve Implantation clinical trials: A consensus report from the Valve Academic Research Consortium. J Am Coll Cardiol 2011; 57: 253–269.
- 13.
Kappetein AP, Head SJ, Genereux P, Piazza N, van Mieghem NM, Blackstone EH, et al. Updated standardized endpoint definitions for transcatheter aortic valve implantation: The Valve Academic Research Consortium-2 consensus document. J Am Coll Cardiol 2012; 60: 1438–1454.
- 14.
Barone-Rochette G, Pierard S, De Meester de Ravenstein C, Seldrum S, Melchior J, Maes F, et al. Prognostic significance of LGE by CMR in aortic stenosis patients undergoing valve replacement. J Am Coll Cardiol 2014; 64: 144–154.
- 15.
Harada K, Saitoh T, Tanaka J, Shibayama K, Berdejo J, Shiota T. Valvuloarterial impedance, but not aortic stenosis severity, predicts syncope in patients with aortic stenosis. Circ Cardiovasc Imaging 2013; 6: 1024–1031.
- 16.
Kang DH, Park SJ, Rim JH, Yun SC, Kim DH, Song JM, et al. Early surgery versus conventional treatment in asymptomatic very severe aortic stenosis. Circulation 2010; 121: 1502–1509.
- 17.
Rosenhek R, Zilberszac R, Schemper M, Czerny M, Mundigler G, Graf S, et al. Natural history of very severe aortic stenosis. Circulation 2010; 121: 151–156.
- 18.
Nishimura RA, Otto CM, Bonow RO, Carabello BA, Erwin JP 3rd, Guyton RA, et al. 2014 AHA/ACC Guideline for the management of patients with valvular heart disease: A report of the American College of Cardiology/American Heart Association Task Force on Practice Guidelines. Circulation 2014; 129: e521–e643.
- 19.
Nuis RJ, Sinning JM, Rodes-Cabau J, Gotzmann M, van Garsse L, Kefer J, et al. Prevalence, factors associated with, and prognostic effects of preoperative anemia on short- and long-term mortality in patients undergoing transcatheter aortic valve implantation. Circ Cardiovasc Interv 2013; 6: 625–634.
- 20.
Anand IS. Anemia and chronic heart failure: Implications and treatment options. J Am Coll Cardiol 2008; 52: 501–511.
- 21.
Tang YD, Katz SD. Anemia in chronic heart failure: Prevalence, etiology, clinical correlates, and treatment options. Circulation 2006; 113: 2454–2461.
- 22.
von Haehling S, Jankowska EA, van Veldhuisen DJ, Ponikowski P, Anker SD. Iron deficiency and cardiovascular disease. Nat Rev Cardiol 2015; 12: 659–669.
- 23.
McClellan WM, Flanders WD, Langston RD, Jurkovitz C, Presley R. Anemia and renal insufficiency are independent risk factors for death among patients with congestive heart failure admitted to community hospitals: A population-based study. J Am Soc Nephrol 2002; 13: 1928–1936.
- 24.
Westenbrink BD, Voors AA, de Boer RA, Schuringa JJ, Klinkenberg T, van der Harst P, et al. Bone marrow dysfunction in chronic heart failure patients. Eur J Heart Fail 2010; 12: 676–684.
- 25.
Vincentelli A, Susen S, Le Tourneau T, Six I, Fabre O, Juthier F, et al. Acquired von Willebrand syndrome in aortic stenosis. N Engl J Med 2003; 34
9 : 343–349.
- 26.
Anker SD, Steinborn W, Strassburg S. Cardiac cachexia. Ann Med 2004; 36: 518–529.
- 27.
Valentova M, von Haehling S, Bauditz J, Doehner W, Ebner N, Bekfani T, et al. Intestinal congestion and right ventricular dysfunction: A link with appetite loss, inflammation, and cachexia in chronic heart failure. Eur Heart J 2016; 37: 1684–1691.
- 28.
Hastie CE, Padmanabhan S, Slack R, Pell AC, Oldroyd KG, Flapan AD, et al. Obesity paradox in a cohort of 4880 consecutive patients undergoing percutaneous coronary intervention. Eur Heart J 2010; 31: 222–226.
- 29.
Roberts WC, Roberts CC, Vowels TJ, Ko JM, Filardo G, Hamman BL, et al. Effect of body mass index on survival in patients having aortic valve replacement for aortic stenosis with or without concomitant coronary artery bypass grafting. Am J Cardiol 2011; 108: 1767–1771.
- 30.
Shah R, Gayat E, Januzzi JL Jr, Sato N, Cohen-Solal A, diSomma S, et al. Body mass index and mortality in acutely decompensated heart failure across the world: A global obesity paradox. J Am Coll Cardiol 2014; 63: 778–785.
- 31.
Hillege HL, Girbes AR, de Kam PJ, Boomsma F, de Zeeuw D, Charlesworth A, et al. Renal function, neurohormonal activation, and survival in patients with chronic heart failure. Circulation 2000; 102: 203–210.
- 32.
Metra M, Cotter G, Gheorghiade M, Dei Cas L, Voors AA. The role of the kidney in heart failure. Eur Heart J 2012; 33: 2135–2142.
- 33.
Ohara T, Hashimoto Y, Matsumura A, Suzuki M, Isobe M. Accelerated progression and morbidity in patients with aortic stenosis on chronic dialysis. Circ J 2005; 69: 1535–1539.
- 34.
Thourani VH, Sarin EL, Kilgo PD, Lattouf OM, Puskas JD, Chen EP, et al. Short- and long-term outcomes in patients undergoing valve surgery with end-stage renal failure receiving chronic hemodialysis. J Thorac Cardiovasc Surg 2012; 144: 117–123.
- 35.
Thourani VH, Chowdhury R, Gunter RL, Kilgo PD, Chen EP, Puskas JD, et al. The impact of specific preoperative organ dysfunction in patients undergoing aortic valve replacement. Ann Thorac Surg 2013; 95: 838–845.
- 36.
Allende R, Webb JG, Munoz-Garcia AJ, de Jaegere P, Tamburino C, Dager AE, et al. Advanced chronic kidney disease in patients undergoing transcatheter aortic valve implantation: Insights on clinical outcomes and prognostic markers from a large cohort of patients. Eur Heart J 2014; 35: 2685–2696.
- 37.
Pibarot P, Dumesnil JG. Low-flow, low-gradient aortic stenosis with normal and depressed left ventricular ejection fraction. J Am Coll Cardiol 2012; 60: 1845–1853.
- 38.
Gheorghiade M, Abraham WT, Albert NM, Greenberg BH, O’Connor CM, She L, et al. Systolic blood pressure at admission, clinical characteristics, and outcomes in patients hospitalized with acute heart failure. JAMA 2006; 296: 2217–2226.
- 39.
Kociol RD, Horton JR, Fonarow GC, Reyes EM, Shaw LK, O’Connor CM, et al. Admission, discharge, or change in B-type natriuretic peptide and long-term outcomes: Data from Organized Program to Initiate Lifesaving Treatment in Hospitalized Patients with Heart Failure (OPTIMIZE-HF) linked to Medicare claims. Circ Heart Fail 2011; 4: 628–636.
- 40.
Gheorghiade M, Abraham WT, Albert NM, Gattis Stough W, Greenberg BH, O’Connor CM, et al. Relationship between admission serum sodium concentration and clinical outcomes in patients hospitalized for heart failure: An analysis from the OPTIMIZE-HF registry. Eur Heart J 2007; 28: 980–988.
- 41.
Fonarow GC, Peacock WF, Phillips CO, Givertz MM, Lopatin M. Admission B-type natriuretic peptide levels and in-hospital mortality in acute decompensated heart failure. J Am Coll Cardiol 2007; 49: 1943–1950.

