Abstract
Background:
The CRUSADE, ACTION and ACUITY-HORIZONS bleeding scores have been derived using Caucasian patients, and little is known about which has the better predictive ability in Chinese patients, especially for patients with STEMI.
Methods and Results:
We retrospectively analyzed 2,208 consecutive STEMI patients undergoing primary PCI (PPCI). Major bleeding events were defined according to Bleeding Academic Research Consortium criteria (type 3 or 5). Predictive ability of the 3 scores was assessed using logistic regression and AUC. Unadjusted HR for 1-year death were determined on Cox proportional hazard modeling. The major bleeding rate was 2.4%. The AUC of the CRUSADE, ACTION and ACUTIY-HORIZONS models was 0.88 (95% CI: 0.84–0.92), 0.90 (95% CI: 0.87–0.94), and 0.78 (95% CI: 0.87–0.94). The calibration of the ACUTIY-HORIZONS model was not acceptable overall, or in the subgroup of access site (P<0.05). In the high-risk category, 1-year mortality was approximately 4–7-fold greater than in the low-risk category (CRUSADE: HR, 7.27; 95% CI: 3.30–16.02, P<0.001; ACTION: HR, 7.13; 95% CI: 2.19–15.41, P<0.001; ACUITY-HORIZONS: HR, 4.06; 95% CI: 1.62–10.16; P=0.003).
Conclusions:
The CRUSADE and ACTION scores have greater predictive ability for in-hospital major bleeding than the ACUITY-HORIZONS risk score in Chinese STEMI patients undergoing PPCI. Mortality would increase with the transition from low- to high-risk category in 1 year.
The treatment of ST-segment elevation myocardial infarction (STEMI) traditionally was focused on potent anti-thrombotic agents and primary percutaneous coronary intervention (PCI).1
These strategies reduce recurrent ischemic events, at the expense of an increase in major bleeding, which is associated with worse outcomes.2–4
Given the lower body weight of Asian patients and the different genetic background, increased bleeding is viewed as a potential threat and has received more attention,5–7
thus predictive risk modeling is an important measure for management of acute coronary syndrome (ACS) in East Asia.
There are 3 main bleeding risk scores: the Can Rapid Risk Stratification of Unstable Angina Patients Suppress Adverse Outcome with Early Implementation of the American College of Cardiology/American Heart Association Guidelines (CRUSADE) risk score,8
the Acute Coronary Treatment and Intervention Outcomes Network Registry-Get With the Guidelines (ACTION Registry-GWTG) risk score,9
and the Acute catheterization and urgent intervention triage strategy and The Harmonizing Outcomes with Revascularization and Stents in Acute Myocardial Infarction (ACUITY-HORIZONS) bleeding risk score.10
Despite these scores offering quantitative methods for assessing bleeding risk in a broader spectrum of ACS, none of them was developed specially for STEMI patients. Moreover, they were not homogeneous with regard to clinical subjects and variables, and used different post-admission treatments to predict major bleeding according to their own definition. It is noteworthy that almost all of the participants were Caucasian, and few studies exist on the scores’ application in East Asian patients with STEMI.
We therefore validated the performance of the 3 scores in Chinese STEMI patients (representative of an East Asian population) undergoing primary PCI, with the aim to (1) obtain evidence for which score is accurate and simple for predicting in-hospital major bleeding in STEMI patients, and assess them with regard to vascular access site and glycoprotein IIb/IIIa inhibitors (GPI) use; and (2) explore the association between bleeding risk model and 1-year mortality.
Methods
Study Design and Subjects
We consecutively selected patients with STEMI who underwent successful primary PCI between October 2013 and January 2016 from the database of Beijing Anzhen Hospital, Capital Medical University, China. Patients who underwent coronary artery bypass graft (CABG), conservative therapy, fibrinolytic therapy, and non-primary PCI were excluded.
A loading dose of 300 mg aspirin followed by 100 mg once daily, and 300–600 mg clopidogrel followed by 75 mg once daily, or 180 mg ticagrelor followed by 90 mg twice daily were given. The use of unfractionated heparin and low-molecular-weight heparin was weight-adjusted as per standard recommendations. GPI (tirofiban) use, access site, choice of stents and other devices were left to the operator’s discretion. Concomitant treatment was according to the relevant practice guidelines.1
Data Collection
Data on clinical characteristics, anti-thrombotic therapy, biochemistry and electrocardiography, bleeding risk score and in-hospital complications were collected and recorded by physicians using a standardized case report form. One-year mortality was followed up via telephone interview.
Clinical Endpoint and Definitions
The primary endpoint was major bleeding events defined according to Bleeding Academic Research Consortium (BARC) criteria (type 3 or 5) during hospitalization: type 3a, overt bleeding plus hemoglobin drop 3–5 g/dL, or any transfusion with overt bleeding; type 3b, overt bleeding plus hemoglobin drop >5 g/dL; cardiac tamponade, bleeding requiring surgical intervention or i.v. vasoactive drugs; type 3c, intracranial hemorrhage (does not include microbleeds or hemorrhagic transformation; does include intraspinal), subcategories confirmed by autopsy, imaging, or lumbar puncture; intraocular bleed compromising vision type 5a, probable fatal bleeding (no autopsy or imaging evidence but clinical suspicion); type 5b, definite fatal bleeding (overt bleeding or autopsy or imaging confirmation).11
Statistical Analysis
Continuous data are described as median (interquartile range, IQR) and were compared using Student’s t-test or Wilcoxon rank-sum test. Categorical data are described as n (%) and were compared using the chi-squared test. Risk scores were calculated for each patient from the corresponding prognostic variable scores (Tables S1–S3). Both CRUSADE and ACTION models were constructed to assign patients into 5 risk strata (very low; low; moderate; high; and very high). In the ACUITY-HORIZONS, patients were stratified into 4 risk categories for bleeding (low; moderate; high; and very high). In the present study, patients were categorized into 3 bleeding risk strata for all scores by combining the very high- and high-risk categories into a high-risk category, and the very low- and low-risk categories into a low-risk category.
Both calibration and discrimination of the models were assessed with respect to the total patient group. Risk model calibration was assessed using the Hosmer-Lemeshow goodness-of-fit test.12
Discrimination was evaluated on receiver operating characteristic (ROC) curves and expressed as c-statistics (>0.70 has acceptable discriminatory capacity),13
and the area under the curve (AUC) was calculated to assess the predictive accuracy of these models. The non-parametric method described by DeLong et al14
was used to compare the predictive ability of the 3 risk models.
Unadjusted HR for 1-year death were determined on Cox proportional hazard modeling. Adjusted HR were estimated from multivariable Cox models selected in a stepwise process with backward and exit thresholds set to 0.10. Two-sided P<0.05 was considered to indicate a statistically significant difference. All statistical analyses were performed using SPSS version 23 (IBM, USA).
Results
Baseline Characteristics
Initially, this cohort study involved 2,484 patients. Patients who underwent CABG (n=92), conservative therapy (n=58), fibrinolytic therapy (n=73) and non-primary PCI (n=53) were excluded from this study (n=276). Thus, 2,208 patients constituted the final study group, and follow up was carried out successfully in all of these patients.
Of the 2,208 patients with STEMI who underwent PCI, 53 (2.4%) developed BARC type 3/5 bleeding complication during hospitalization. Patients with major bleeding were mostly elderly and female with low body weight and a frequent history of peptic ulcer, diabetes mellitus and cancer, as well as worse renal function, higher bleeding risk scores, and unstable hemodynamic status during hospitalization (Table 1). The most prevalent cause of major bleeding complications was gastrointestinal bleeding (47/53, 90.6%), followed by intracranial hemorrhage (5/53, 9.4%) and angiography site-related bleeding due to the femoral approach (1/53, 1.9%).
Table 1.
Subject Clinical Characteristics and In-Hospital Management
| |
Overall
(n=2,208) |
Major bleeding
(n=53) |
No major bleeding
(n=2,155) |
P-value |
| Clinical characteristics |
| Age (years) |
56.0 (10.7) |
64.2 (7.9) |
55.8 (10.6) |
0.019 |
| Female |
332 (15.0) |
14 (26.4) |
318 (14.8) |
0.030 |
| Weight (kg) |
75.3 (11.5) |
70.1 (8.1) |
75.4 (11.6) |
0.001 |
| Hypertension |
1,056 (47.8) |
27 (50.9) |
1,029 (47.7) |
0.678 |
| Diabetes mellitus |
643 (29.1) |
28 (52.8) |
615 (28.5) |
<0.001 |
| Dyslipidemia |
786 (35.6) |
4 (7.5) |
782 (36.3) |
<0.001 |
| CKD |
65 (2.9) |
14 (26.4) |
51 (2.4) |
<0.001 |
| Previous PCI |
150 (6.8) |
8 (15.1) |
142 (6.6) |
0.031 |
| Previous CABG |
9 (0.4) |
0 (0) |
9 (0.4) |
1.000 |
| Previous MI |
40 (1.8) |
0 (0) |
40 (1.9) |
0.624 |
| Previous ischemic stroke |
101 (4.6) |
8 (15.1) |
93 (4.3) |
0.001 |
| PAD |
32 (1.4) |
0 (0) |
32 (1.5) |
0.755 |
| Cancer |
34 (1.5) |
6 (11.3) |
28 (1.3) |
<0.001 |
| Previous GI ulcer |
130 (5.9) |
8 (15.1) |
122 (5.7) |
0.010 |
| On-admission data |
| Killip class |
| I |
1,781 (80.7) |
14 (26.4) |
1,767 (82.0) |
<0.001 |
| II |
293 (13.3) |
9 (17.0) |
284 (13.2) |
|
| III |
74 (3.4) |
14 (26.4) |
60 (2.8) |
|
| IV |
60 (2.7) |
16 (30.2) |
44 (2.0) |
|
| SBP (mmHg) |
121.5 (14.8) |
112.3 (19.1) |
121.8 (14.6) |
0.010 |
| Heart rate (beats/min) |
72.3 (11.5) |
85.2 (17.5) |
72.0 (11.2) |
<0.001 |
| Hemoglobin (g/dL) |
142.4 (15.5) |
133.0 (21.8) |
142.6 (15.3) |
0.002 |
| Hematocrit (%) |
41.4 (4.1) |
39.0 (6.1) |
41.1 (4.0) |
0.005 |
| Anemia† |
334 (15.1) |
16 (30.2) |
318 (14.8) |
0.002 |
| Serum creatinine (mg/dL) |
0.9 (0.4) |
1.1 (0.6) |
0.9 (0.4) |
0.042 |
| Creatinine clearance (ml/min)‡ |
98.5 (32.1) |
73.2 (21.6) |
99.1 (32.0) |
<0.001 |
| Leukocytes (g/L) |
7.1 (3.9) |
8.2 (4.4) |
6.9 (3.7) |
0.003 |
| Mean CRUSADE score |
19.5 (12.0) |
37.7 (10.6) |
19.0 (11.6) |
<0.001 |
| Mean ACTION score |
27.4 (5.5) |
39.3 (8.5) |
27.1 (5.1) |
<0.001 |
| Mean ACUITY-HORIZONS score |
12.6 (5.3) |
17.3 (4.3) |
12.4 (5.2) |
<0.001 |
| In-hospital management |
| Aspirin |
2,206 (99.9) |
53 (100) |
2,153 (99.9) |
1.000 |
| P2Y12 inhibitors |
| Clopidogrel |
1,201 (54.4) |
28 (52.8) |
1,154 (53.4) |
0.722 |
| Ticagrelor |
1,007 (45.6) |
25 (47.2) |
1,001 (46.5) |
|
| UFH |
2,186 (99.0) |
53 (100) |
2,133 (99.0) |
1.000 |
| LMFH |
1,515 (68.6) |
42 (79.2) |
1,473 (68.4) |
<0.001 |
| Bivalirudin |
22 (1.0) |
0 (0) |
22 (1.0) |
1.000 |
| Tirofiban |
722 (32.7) |
18 (34.0) |
704 (32.7) |
0.843 |
| IABP |
52 (2.4) |
20 (37.7) |
32 (1.5) |
<0.001 |
| Vascular access site |
| Radial |
2,032 (92.0) |
32 (60.4) |
2,000 (92.8) |
<0.001 |
| Femoral |
176 (8.0) |
21 (39.6) |
155 (7.2) |
<0.001 |
| In-hospital clinical course |
| VF |
67 (3.0) |
19 (35.8) |
48 (2.2) |
<0.001 |
| Cardiac shock |
62 (2.8) |
22 (41.5) |
40 (1.9) |
<0.001 |
| AV block |
10 (0.5) |
0 (0) |
10 (0.5) |
1.000 |
| In-hospital mortality |
25 (1.1) |
8 (15.1) |
17 (0.8) |
<0.001 |
Data given as n (%) or median (IQR). †Men, hemoglobin <13 g/dL; women, hemoglobin <12 g/dL. ‡Estimated using the Cockcroft-Gault formula. AV, atrioventricular; CABG, coronary artery bypass graft; CKD, chronic kidney disease; ACTION, Acute Coronary Treatment and Intervention Outcomes Network; ACUITY-HORIZONS, Acute catheterization and urgent intervention triage strategy and The Harmonizing Outcomes with Revascularization and Stents in Acute Myocardial Infarction; CRUSADE, Can Rapid Risk Stratification of Unstable Angina Patients Suppress Adverse Outcome with Early Implementation of the American College of Cardiology/American Heart Association Guidelines; GI, gastrointestinal; GPI, glycoprotein IIb/IIIa inhibitor; IABP, intra-aortic balloon pump; LMFH, low molecular weight heparin; MI, myocardial infarction; PAD, peripheral artery disease; PCI, percutaneous coronary intervention; SBP, systolic blood pressure; STEMI, ST-segment elevation myocardial infarction; UFH, unfractionated heparin; VF, ventricular fibrillation.
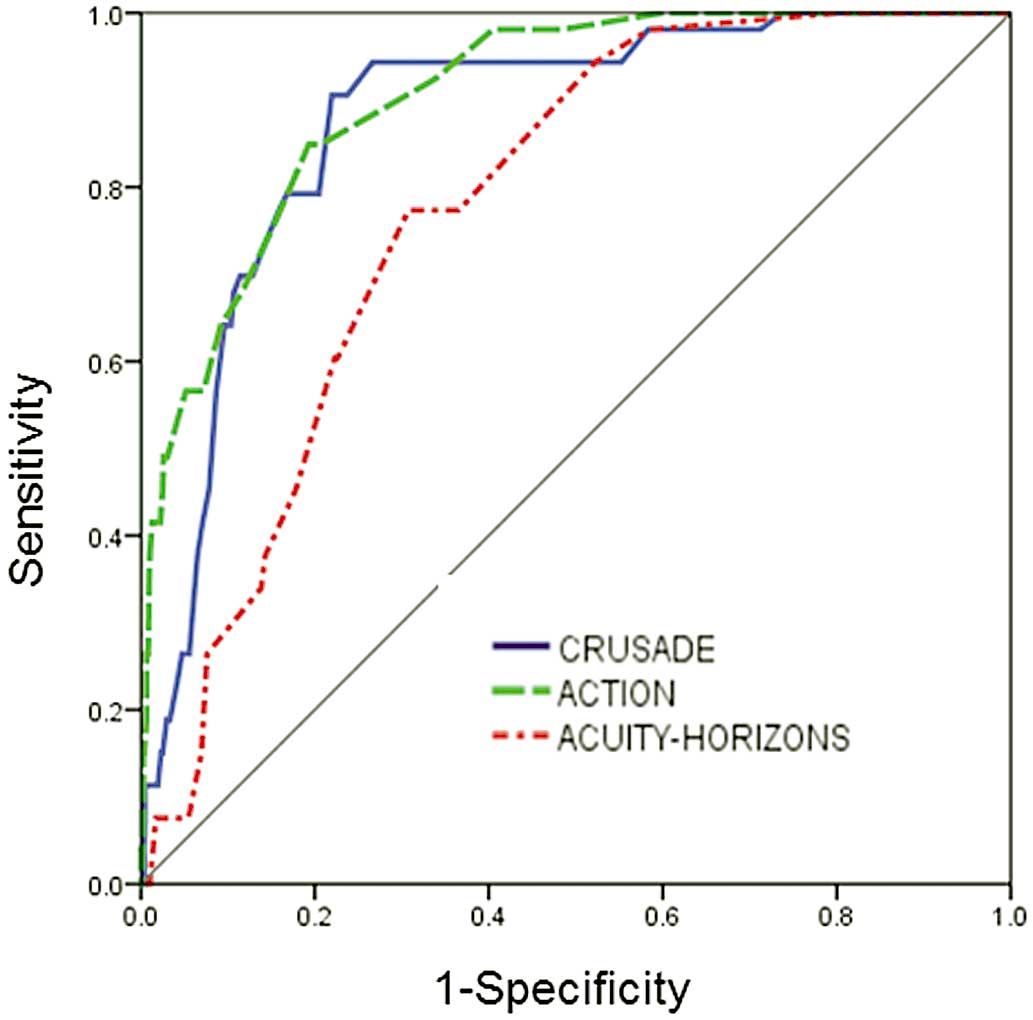
The major bleeding rates across the quintiles of the 3 score categories were as follows: CRUSADE score low risk, 0.7%; moderate risk, 9.4%; high risk, 12.5%; ACTION score low risk, 0.5%; moderate risk, 6%; high risk, 31.4%; ACUITY-HORIZONS score low risk, 0.1%; moderate risk, 1.9%; and high risk, 5.7% (Figure 1). Major bleeding rate had a consistent gradient for each risk stratification (P<0.001). The AUC of the CRUSADE, ACTION and ACUTIY-HORIZONS models were 0.88 (95% CI: 0.84–0.92), 0.90 (95% CI: 0.87–0.94), and 0.78 (95% CI: 0.87–0.94), respectively, but the calibration of the ACUTIY-HORIZONS models was not acceptable in the STEMI cohort (P<0.05;
Table 2;
Figure 2).
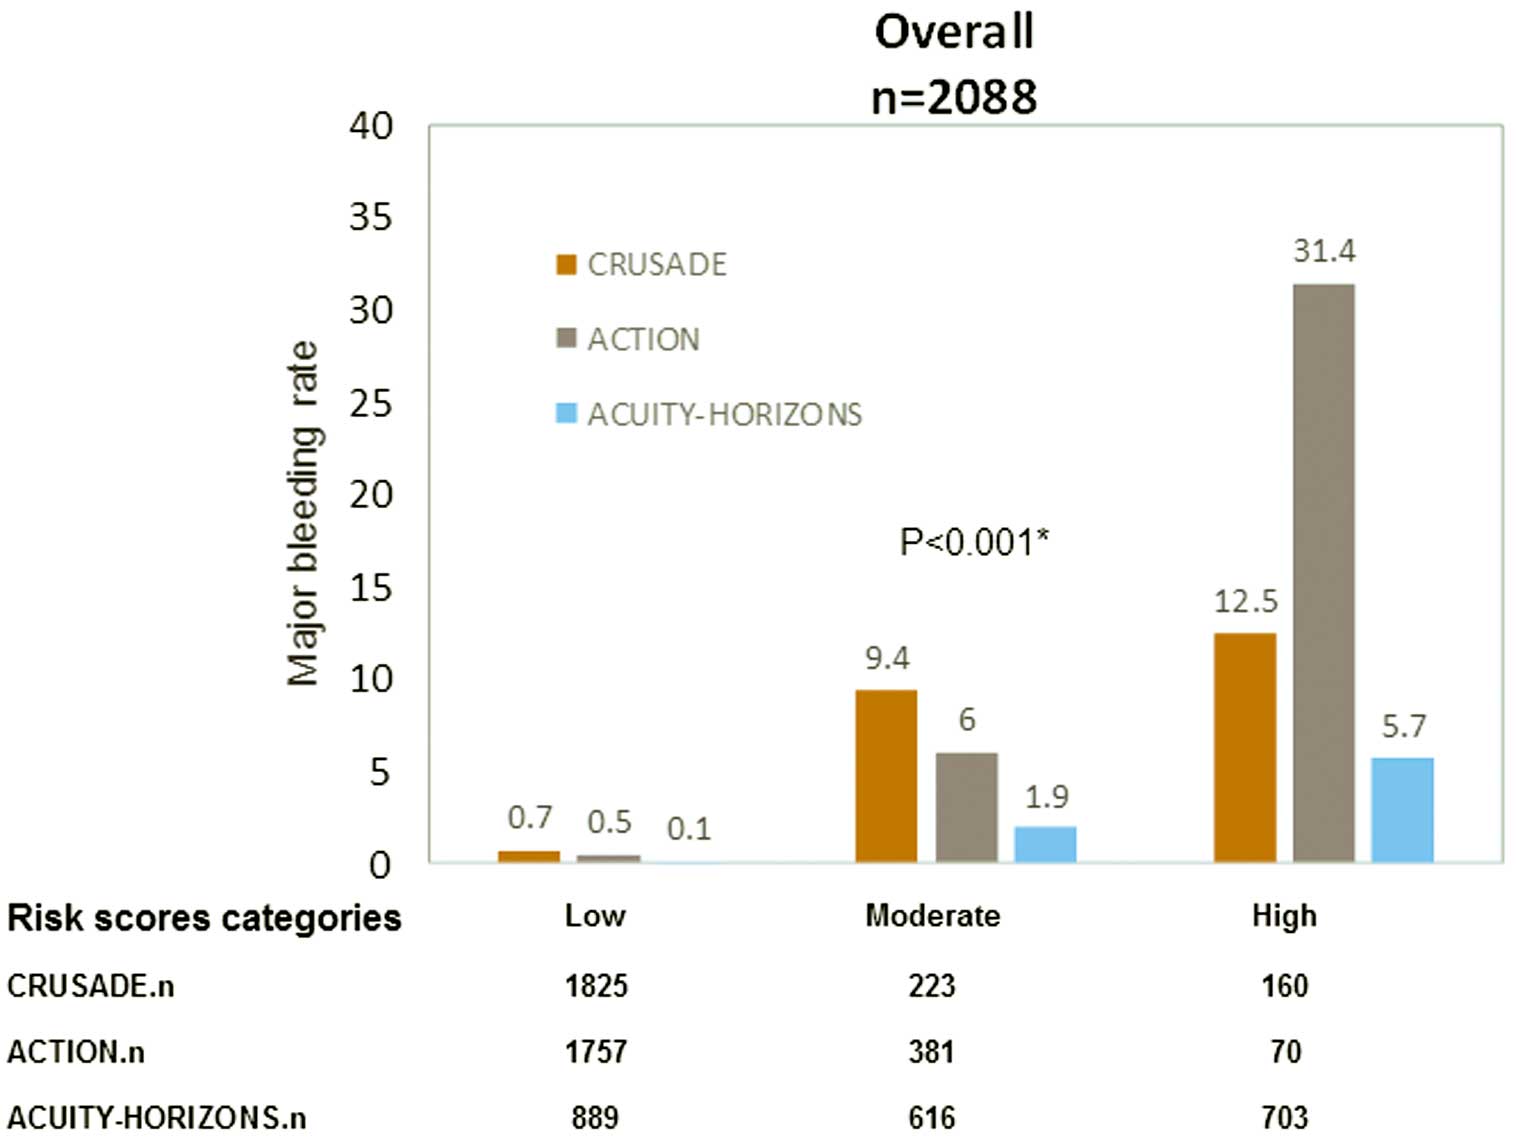
Table 2.
In-Hospital Major Bleeding Events in STEMI Patients: Risk Score Calibration and Discrimination
| Risk group |
Risk score |
Hosmer-Lemeshow test |
c-statistic
(95% CI) |
| χ2 |
P-value |
| Overall (n=2,088) |
CRUSADE |
12.9 |
0.116 |
0.88 (0.84–0.92) |
| |
ACTION |
11.3 |
0.186 |
0.90 (0.87–0.94) |
| |
ACUITY-HORIZONS |
16.7 |
0.010 |
0.78 (0.73–0.82) |
| Vascular access site |
| Radial (n=2,032) |
CRUSADE |
7.2 |
0.513 |
0.88 (0.83–0.92) |
| |
ACTION |
10.3 |
0.244 |
0.90 (0.86–0.94) |
| |
ACUITY-HORIZONS |
21.2 |
0.003 |
0.82 (0.77–0.87) |
| Femoral (n=176) |
CRUSADE |
13.8 |
0.055 |
0.85 (0.77–0.93) |
| |
ACTION |
6.9 |
0.344 |
0.89 (0.83–0.95) |
| |
ACUITY-HORIZONS |
17.5 |
0.015 |
0.71 (0.63–0.80) |
| GPI use |
| Yes (n=722) |
CRUSADE |
6.1 |
0.633 |
0.90 (0.87–0.94) |
| |
ACTION |
11.1 |
0.133 |
0.91 (0.86–0.97) |
| |
ACUITY-HORIZONS |
14.3 |
0.075 |
0.74 (0.65–0.83) |
| No (n=1,486) |
CRUSADE |
6.6 |
0.468 |
0.86 (0.81–092) |
| |
ACTION |
17.3 |
0.068 |
0.90 (0.86–0.94) |
| |
ACUITY-HORIZONS |
8.0 |
0.438 |
0.80 (0.75–0.85) |
Abbreviations as in Table 1.
The performance of the CRUSADE, ACTION and ACUTIY-HORIZONS bleeding risk scores across treatment subgroups was confirmed (Table 2). For patients receiving GPI (n=722), the AUC were 0.90 (95% CI: 0.87–0.94), 0.91 (95% CI: 0.86–0.97), and 0.74 (95% CI: 0.65–0.83), respectively. Major bleeding rate was higher in each model’s high-risk group for patients receiving GPI compared with those who did not receive GPI: CRUSADE, 16% vs. 10.9%; ACTION, 40% vs. 25%; and ACUITY-HORIZONS, 7.0% vs. 5.1% (P<0.001).
Good performance was noted both in patients undergoing radial angiography (n=2032, 92%) and femoral angiography (n=176, 8%). AUC for the CRUSADE, ACTION and ACUTIY-HORIZONS bleeding risk models for radial angiography were 0.88 (95% CI: 0.83–0.92), 0.90 (95% CI: 0.86–0.94), and 0.82 (95% CI: 0.77–0.87), respectively. For femoral angiography the AUC were 0.85 (95% CI: 0.77–0.93), 0.89 (95% CI: 0.83–0.95), and 0.71 (95% CI: 0.63–0.80), respectively. The bleeding rate in risk groups for the radial approach were all lower than for femoral approach: low risk, CRUSADE 0.3% vs. 5%; ACTION 0.3% vs. 2.5%; ACUITY-HORIZONS 0.1% vs. 0%; moderate risk, CRUSADE 8.8% vs. 25%; ACTION 5.4% vs. 14.3%; ACUITY-HORIZONS 0.5% vs. 18.4%; high risk, CRUSADE 6.1% vs. 42.9%; ACTION 18.2% vs. 53.8%; ACUITY-HORIZONS 4.4% vs. 19.7% (P<0.001). The calibration of the ACUTIY-HORIZONS models was not acceptable in either the radial group or the femoral group (P<0.05;
Table 2).
The C-statistic for the ACUITY-HORIZONS model was significantly lower than that of the CRUSADE and ACTION scores for the prediction of in-hospital major bleeding in STEMI patients (compared with CRUSADE, z=4.21, P=0.04; compared with ACTION, z=5.43, P=0.02). No differences were observed when the CRUSADE and ACTION models were compared with each other (z=0.33, P=0.71;
Table 3).
Table 3.
Discriminative Power for Predicting Major Bleeding
| Comparison |
z† |
P-value |
| CRUSADE vs. ACTION |
0.33 |
0.71 |
| CRUSADE vs. ACUITY-HORIZONS |
4.21 |
0.04 |
| ACTION vs. ACUITY-HORIZONS |
5.43 |
0.02 |
†Null-hypothesis result. Abbreviations as in Table 1.
In each model, the transition from the low- to high-risk category carried a significantly increased risk of 1-year mortality. The magnitude of the effect of moderate risk category in the CRUSADE and ACTION models on 1-year mortality was approximately 2.6-fold greater than that of the low risk category (CRUSADE: HR, 2.59; 95% CI: 1.41–7.10; P=0.044; ACTION: HR, 2.71; 95% CI: 1.07–6.89; P=0.036; ACUITY-HORIZONS: HR, 1.45; 95% CI: 0.47–4.49; P=0.521, respectively). In the high-risk category, 1-year mortality was approximately 4–7-fold greater than in the low-risk category (CRUSADE: HR, 7.27; 95% CI: 3.30–16.02; P<0.001; ACTION: HR, 7.13; 95% CI: 2.19–15.41; P<0.001; ACUITY-HORIZONS: HR, 4.06; 95% CI: 1.62–10.16; P=0.003, respectively;
Table 4).
Table 4.
HR of Bleeding Risk Score and 1-Year Mortality
| Risk score |
Low risk |
Moderate risk |
High risk |
| HR (95% CI) |
P-value |
HR (95% CI) |
P-value |
| CRUSADE |
Ref. |
2.59 (1.41–7.10) |
0.044 |
7.27 (3.30–16.02) |
<0.001 |
| ACTION |
Ref. |
2.71 (1.07–6.89) |
0.036 |
7.13 (2.19–15.41) |
<0.001 |
| ACUITY-HORIZONS |
Ref. |
1.45 (0.47–4.49) |
0.521 |
4.06 (1.62–10.16) |
0.003 |
CI, confidence interval; HR, hazard ratio. Other abbreviations as in Table 1.
Discussion
The main results of the present analysis are as follows: (1) using neutral BARC criteria, the CRUSADE and ACTION models had good calibration and discrimination abilities with regard to major bleeding in Chinese STEMI patients, but the calibration of the ACUTIY-HORIZONS model was not acceptable in the overall group or with regard to access site; and (2) in each model, the transition from low- to high-risk category carried a significantly increased risk for 1-year mortality.
In the modern era of risk-tailored and personalized cardiovascular treatment, studies on risk prediction models have been inclined to use risk models constructed for different ethnicities and clinical settings. Assessing the models in an independent cohort before use would lower the likelihood of over or underestimating the real risks.
STEMI constitutes a high-risk clinical setting and requires more aggressive pharmacological treatment and invasive strategies, which are related to an increased risk of bleeding complications. Given the strong association between bleeding and subsequent mortality, bleeding prediction models are important for risk stratification and to determine treatment. Particularly in East Asian patients, compared with Caucasian patients, there is an increased susceptibility to bleeding because of the lower body weight, differences in genetic background, risk factors and disease patterns,15–17
and little clinical research exists on the application of these risk score systems. In the present STEMI cohort study, the in-hospital major bleeding rate was 2.4%, similar to previous studies with a reported range of 1–6%.18–20
The incidence rates of bleeding according to the neutral BARC criteria in the low-risk category were lower than the corresponding rates in the 3 original models. This may have been due to the different subject baseline characteristics. The present patients had lower baseline heart rate and systolic blood pressure (SBP), and lower prevalence of anemia and peripheral arteriopathy than Western patients.21
Another reason was the lower rate of iatrogenic artery access injury. Ariza-Sole et al reported that in a STEMI cohort, the access puncture site in coronary intervention was the femoral artery in 41.2%,22
and the femoral access site was associated with major bleeding in approximately 40% of all bleeds.23
In the present study, however, radial artery access was used in 90%, indicating that the radial artery is superior in reducing bleeding events, and could improve subsequent adverse outcomes in patients undergoing PCI.24
In the present study, the c-statistics of the CRUSADE, ACTION and ACUTIY-HORIZONS models were 0.88, 0.90, and 0.78, respectively, greater than in the original studies.8–10
This may be attributed to the differences in patient background, bleeding definitions, and genetic background. First, STEMI patients usually have a lower prevalence of comorbidities than non-ST-elevation ACS (NSTE-ACS) patients, and different timing of in-hospital treatment and procedures,25
thus potentially leading to a different overall bleeding risk. Second, the BARC criteria type 3 and 5 were used as the definitions of major bleeding, which provide more accurate prediction of bleeding events in STEMI patients than Thrombolysis In Myocardial Infarction (TIMI), Global Utilization of Streptokinase and Tissue Plasminogen Activator for Occluded Coronary Arteries (GUSTO), and International Society on Thrombosis and Haemostasis (ISTH) bleeding classifications.26
In contrast, most validation studies used TIMI or GUSTO definitions. Third, increasing data suggest that East Asian patients have different thrombogenicity, platelet P2Y12-receptor inhibition, and propensity for bleeding complications compared with Caucasian patients.27
Genetic polymorphisms might partially account for the underlying mechanism of differing bleeding risk with ethnicity.28
In addition, we found that the CRUSADE and ACTION risk scores had greater predictive value for major bleeding than the ACUITY-HORIZONS risk model. This difference might be due to the different variables used in each model. The CRUSADE and ACTION models have similar baseline variables, such as heart rate, SBP, heart failure, diabetes, and vascular disease, but the ACUITY-HORIZONS risk model did not include these variables, and instead used the factor treatment with anti-thrombotic regimen, especially bivalirudin, which was rarely used in this study.
In modern East Asian society, the association between aging and the increasing prevalence of coronary artery disease (CAD) risk factors, has become prominent.29,30
STEMI is the most serious manifestation of CAD, and ischemia and bleeding events result in substantial morbidity and mortality. On analysis of the present risk models, we found that the transition from low- to high-risk category carried a significantly increased risk of 1-year mortality. The risk of bleeding was related to mortality, and different bleeding risk strata predict different rates of subsequent 1-year death. This observation and conclusion could be taken into consideration to optimize choice of anti-thrombotic agents during hospitalization, and improve individual survival in East Asian society.
Study Limitations
The potential limitations of this study were as follows: first, this was a single-center retrospective study, although patient management was relatively homogenous. Second, we did not compare the 3 models using their own major bleeding definitions, but instead used neutral BARC criteria. Third, only 1% of patients used bivalirudin, which was proved to be associated with fewer bleeding complications. Finally, the performance of the ACUITY-HORIZONS score was assessed with regard to in-hospital bleeding events although it was originally designed to predict 30-day bleeding.
Conclusions
The CRUSADE, ACTION scores had a greater prediction ability for in-hospital major bleeding than the ACUITY-HORIZONS risk score in Chinese STEMI patients undergoing primary PCI. Mortality would increase with the transition from low- to high-risk category in 1 year. This study would help clinicians identify the accuracy of these risk stratifications and the association of risk category with mortality.
Acknowledgments
The authors thank Meng-Ge Zhou (Beijing Institute of Heart, Lung and Blood Vessel Diseases, Beijing Anzhen Hospital, Capital Medical University) for technical assistance with data cleaning and statistical analysis.
Funding
This study was supported by grants from the National High Technology Research and Development Program of China (2015AA020102) and Beijing Municipal Science & Technology Commission (Z141107002514014).
Disclosures
The author declare no conflicts of interest.
Supplementary Files
Supplementary File 1
Table S1.
CRUSADE score system algorithms
Table S2.
ACTION score system algorithms
Table S3.
ACUITY-HORIZONS score system algorithms
Please find supplementary file(s);
http://dx.doi.org/10.1253/circj.CJ-17-0760
References
- 1.
Ibanez B, James S, Agewall S, Antunes MJ, Bucciarelli-Ducci C, Bueno H, et al. 2017 ESC Guidelines for the management of acute myocardial infarction in patients presenting with ST-segment elevation: The Task Force for the management of acute myocardial infarction in patients presenting with ST-segment elevation of the European Society of Cardiology (ESC). Eur Heart J 2018; 39: 119–177.
- 2.
Kaul P, Tanguay JF, Newby LK, Hochman JS, Westerhout CM, Califf RM, et al. Association between bleeding and mortality among women and men with high-risk acute coronary syndromes: Insights from the Early versus Delayed, Provisional Eptifibatide in Acute Coronary Syndromes (EARLY ACS) trial. Am Heart J 2013; 166: 723–728.
- 3.
Steg PG, Huber K, Andreotti F, Arnesen H, Atar D, Badimon L, et al. Bleeding in acute coronary syndromes and percutaneous coronary interventions: Position paper by the Working Group on Thrombosis of the European Society of Cardiology. Eur Heart J 2011; 32: 1854–1864.
- 4.
Chhatriwalla AK, Amin AP, Kennedy KF, House JA, Cohen DJ, Rao SV, et al. Association between bleeding events and in-hospital mortality after percutaneous coronary intervention. JAMA 2013; 309: 1022–1029.
- 5.
Mehta RH, Parsons L, Peterson ED; National Registry of Myocardial Infarction Investigators. Comparison of bleeding and in-hospital mortality in Asian-Americans versus Caucasian-Americans with ST-elevation myocardial infarction receiving reperfusion therapy. Am J Cardiol 2012; 109: 925–931.
- 6.
Kwon TJ, Tantry US, Park Y, Choi YM, Ahn JH, Kim KH, et al. Influence of platelet reactivity on BARC classification in East Asian patients undergoing percutaneous coronary intervention: Results of the ACCEL-BLEED study. Thromb Haemost 2016; 115: 979–992.
- 7.
Wang TY, Chen AY, Roe MT, Alexander KP, Newby LK, Smith SC Jr, et al. Comparison of baseline characteristics, treatment patterns, and in-hospital outcomes of Asian versus non-Asian white Americans with non-ST-segment elevation acute coronary syndromes from the CRUSADE quality improvement initiative. Am J Cardiol 2007; 100: 391–396.
- 8.
Subherwal S, Bach RG, Chen AY, Gage BF, Rao SV, Newby LK, et al. Baseline risk of major bleeding in non-ST-segment-elevation myocardial infarction: The CRUSADE (Can Rapid risk stratification of Unstable angina patients Suppress ADverse outcomes with Early implementation of the ACC/AHA Guidelines) Bleeding Score. Circulation 2009; 119: 1873–1882.
- 9.
Mathews R, Peterson ED, Chen AY, Wang TY, Chin CT, Fonarow GC, et al. In-hospital major bleeding during ST-elevation and non-ST-elevation myocardial infarction care: Derivation and validation of a model from the ACTION Registry(R)-GWTG. Am J Cardiol 2011; 107: 1136–1143.
- 10.
Mehran R, Pocock SJ, Nikolsky E, Clayton T, Dangas GD, Kirtane AJ, et al. A risk score to predict bleeding in patients with acute coronary syndromes. J Am Coll Cardiol 2010; 55: 2556–2566.
- 11.
Mehran R, Rao SV, Bhatt DL, Gibson CM, Caixeta A, Eikelboom J, et al. Standardized bleeding definitions for cardiovascular clinical trials: A consensus report from the Bleeding Academic Research Consortium. Circulation 2011; 123: 2736–2747.
- 12.
Lemeshow S, Hosmer DW Jr. A review of goodness of fit statistics for use in the development of logistic regression models. Am J Epidemiol 1982; 115: 92–106.
- 13.
Nunez E, Steyerberg EW, Nunez J. Regression modeling strategies. Rev Esp Cardiol 2011; 64: 501–507 (in Spanish).
- 14.
DeLong ER, DeLong DM, Clarke-Pearson DL. Comparing the areas under two or more correlated receiver operating characteristic curves: A nonparametric approach. Biometrics 1988; 44: 837–845.
- 15.
Kang HJ, Clare RM, Gao R, Held C, Himmelmann A, James SK, et al. Ticagrelor versus clopidogrel in Asian patients with acute coronary syndrome: A retrospective analysis from the Platelet Inhibition and Patient Outcomes (PLATO) Trial. Am Heart J 2015; 169: 899–905.
- 16.
Jones DA, Gallagher S, Rathod KS, Redwood S, de Belder MA, Mathur A, et al. Mortality in South Asians and Caucasians after percutaneous coronary intervention in the United Kingdom. JACC Cardiovasc Interv 2014; 7: 362–371.
- 17.
Viquez Beita AK, Whayne TF Jr. Higher risk of bleeding in Asians presenting with ST elevation myocardial infarction (STEMI). Angiology, doi:10.1177/0003319717731961.
- 18.
Jolicoeur EM, O’Neill WW, Hellkamp A, Hamm CW, Holmes DR Jr, Al-Khalidi HR, et al. Transfusion and mortality in patients with ST-segment elevation myocardial infarction treated with primary percutaneous coronary intervention. Eur Heart J 2009; 30: 2575–2583.
- 19.
Rao SV, O’Grady K, Pieper KS, Granger CB, Newby LK, Mahaffey KW, et al. A comparison of the clinical impact of bleeding measured by two different classifications among patients with acute coronary syndromes. J Am Coll Cardiol 2006; 47: 809–816.
- 20.
Cornara S, Somaschini A, De Servi S, Crimi G, Ferlini M, Baldo A, et al. Prognostic impact of in-hospital-bleeding in patients with ST-elevation myocardial infarction treated by primary percutaneous coronary intervention. Am J Cardiol 2017; 120: 1734–1741.
- 21.
Liu J, Hong Y, D’Agostino RB Sr, Wu Z, Wang W, Sun J, et al. Predictive value for the Chinese population of the Framingham CHD risk assessment tool compared with the Chinese Multi-Provincial Cohort Study. JAMA 2004; 291: 2591–2599.
- 22.
Ariza-Sole A, Sanchez-Elvira G, Sanchez-Salado JC, Lorente-Tordera V, Salazar-Mendiguchia J, Sanchez-Prieto R, et al. CRUSADE bleeding risk score validation for ST-segment-elevation myocardial infarction undergoing primary percutaneous coronary intervention. Thromb Res 2013; 132: 652–658.
- 23.
Mrdovic I, Savic L, Krljanac G, Asanin M, Lasica R, Djuricic N, et al. Simple risk algorithm to predict serious bleeding in patients with ST-segment elevation myocardial infarction undergoing primary percutaneous coronary intervention. Circ J 2013; 77: 1719–1727.
- 24.
Valgimigli M, Gagnor A, Calabro P, Frigoli E, Leonardi S, Zaro T, et al. Radial versus femoral access in patients with acute coronary syndromes undergoing invasive management: A randomised multicentre trial. Lancet 2015; 385: 2465–2476.
- 25.
Chew DP, Junbo G, Parsonage W, Kerkar P, Sulimov VA, Horsfall M, et al. Perceived risk of ischemic and bleeding events in acute coronary syndromes. Circ Cardiovasc Qual Outcomes 2013; 6: 299–308.
- 26.
Kikkert WJ, van Geloven N, van der Laan MH, Vis MM, Baan J Jr, Koch KT, et al. The prognostic value of bleeding academic research consortium (BARC)-defined bleeding complications in ST-segment elevation myocardial infarction: A comparison with the TIMI (Thrombolysis In Myocardial Infarction), GUSTO (Global Utilization of Streptokinase and Tissue Plasminogen Activator for Occluded Coronary Arteries), and ISTH (International Society on Thrombosis and Haemostasis) bleeding classifications. J Am Coll Cardiol 2014; 63: 1866–1875.
- 27.
Levine GN, Jeong YH, Goto S, Anderson JL, Huo Y, Mega JL, et al. World heart federation expert consensus statement on antiplatelet therapy in east Asian patients with ACS or undergoing PCI. Glob Heart 2014; 9: 457–467.
- 28.
Ye Z, Liu EH, Higgins JP, Keavney BD, Lowe GD, Collins R, et al. Seven haemostatic gene polymorphisms in coronary disease: Meta-analysis of 66,155 cases and 91,307 controls. Lancet 2006; 367: 651–658.
- 29.
Kaneko H, Yajima J, Oikawa Y, Tanaka S, Fukamachi D, Suzuki S, et al. Impact of aging on the clinical outcomes of Japanese patients with coronary artery disease after percutaneous coronary intervention. Heart Vessels 2014; 29: 156–164.
- 30.
Lv J, Yu C, Guo Y, Bian Z, Yang L, Chen Y, et al. Adherence to healthy lifestyle and cardiovascular diseases in the Chinese population. J Am Coll Cardiol 2017; 69: 1116–1125.
