Abstract
Background:
A novel index of the functional severity of coronary stenosis, quantitative flow ratio (QFR), may not consider the amount of viable myocardium in prior myocardial infarction (MI) because QFR is calculated from 3D quantitative coronary angiography.
Methods and Results:
We analyzed QFR (fixed-flow QFR [fQFR] and contrast-flow QFR [cQFR]) and fractional flow reserve (FFR) in prior-MI-related coronary arteries (n=75) and non-prior-MI-related coronary arteries (n=75). Both fQFR and cQFR directly correlated with FFR in the prior-MI-related coronary arteries (fQFR: r=0.84, P<0.001; and cQFR: r=0.88, P<0.001) and the non-prior-MI-related coronary arteries (fQFR: r=0.91, P<0.001; and cQFR: r=0.94, P<0.001). fQFR was significantly smaller than FFR in the prior-MI-related coronary arteries (0.73±0.14 vs. 0.79±0.11, P=0.002), but there was no significant difference between fQFR and FFR in the non-prior-MI-related coronary arteries. The value of cQFR minus FFR was significantly lower in the prior-MI-related coronary arteries compared with the non-prior-MI-related coronary arteries (−0.02±0.06 vs. 0.00±0.04, P=0.010). The diagnostic accuracy of fQFR ≤0.8 and cQFR ≤0.8 for predicting FFR ≤0.80 was numerically lower in the prior-MI-related coronary arteries compared with the non-prior-MI-related coronary arteries (fQFR: 77% vs. 87%; and cQFR: 87% vs. 92%).
Conclusions:
When FFR is used as the gold standard, the accuracy of QFR for assessing the functional severity of coronary stenosis might be reduced in the prior-MI-related coronary arteries compared with non-prior-MI-related coronary arteries.
Fractional flow reserve (FFR) is a useful index of the functional significance of a coronary stenosis.1
It is obtained during routine coronary angiography (CAG) by using a pressure wire.2
FFR is independent of heart rate, systemic blood pressure and cardiac output and takes into account myocardial territory and viability and collateral perfusion.2–5
However, FFR has some disadvantages, such as risks of pressure wire injury, side effects of hyperemic agents and additional costs.
Quantitative flow ratio (QFR) is a novel approach to assessing the functional severity of a coronary stenosis. It is calculated from 3D quantitative CAG (3D-QCA) using an advanced algorithm that enables fast computation of the pressure drop caused by coronary stenosis. Compared with FFR, QFR is obtained easily and less invasively without the use of pressure wires and hyperemic agents. Recent studies have demonstrated good correlation between QFR and FFR.6–8
Mismatch between angiographic diameter stenosis and FFR is often observed in prior myocardial infarction (MI)-related coronary arteries. Angiographically severe stenoses in prior-MI-related coronary arteries are not necessary to induce myocardial ischemia because the amount of viable myocardium is reduced.9–11
Previous studies have demonstrated that FFR can accurately assess the degree of ischemia even in prior-MI-related coronary arteries,11,12
but QFR may not consider the amount of viable myocardium because this index is estimated from the anatomic information of the epicardial coronary artery. Therefore, we investigated the diagnostic accuracy of QFR in prior-MI-related coronary arteries as compared with FFR.
Methods
Study Population
The present study was a retrospective, single-center study of patients who underwent CAG and FFR. We analyzed a consecutive series of 75 prior-MI-related coronary arteries (examined in 75 patients between July 2012 and December 2016) and a consecutive series of 75 non-prior-MI-related coronary arteries (examined in 75 patients between October 2015 and December 2016). FFR was performed to assess angiographic intermediate lesions (40–70% diameter stenosis by visual estimation). If the patient had angiographic intermediate lesions in multiple coronary arteries, we selected the coronary artery with the most severe stenotic lesion as the target vessel. Prior MI was defined by the following criteria: (1) documented MI ≥30 days before CAG and FFR; (2) pathological Q waves on ECG; (3) reduction of left ventricular ejection fraction (LVEF) and abnormalities of left ventricular regional wall motion on transthoracic echocardiogram; and (4) 1-vessel coronary artery disease (CAD) responsible for MI. We excluded patients with (1) incomplete CAG results (e.g., insufficient contrast injection, lack of multiple angiographic projections); (2) ostial lesions in the coronary arteries; (3) collateral donor arteries; (4) coronary artery bypass graft; (5) chronic atrial fibrillation; and (6) prior-MI in non-target coronary arteries. The institutional review board approved the study, and all patients provided written informed consent.
CAG
CAG was performed using a 5- or 6-Fr catheter via transfemoral or transradial approach. All patients received intravenous injection of heparin 7,000 IU and intracoronary injection of isosorbide dinitrate 2 mg before angiography. Contrast media (Omnipaque 350 Injection, Daiichi Sankyo Co., Ltd., Tokyo, Japan) was injected into coronary artery through the catheter at a rate of 2–4 mL/s for approximately 2–3 s using an injector pump (Mark V, Medrad, PA, USA).
Coronary angiograms were obtained from a standard series of 6–8 projections for the left coronary artery and 2–3 projections for the right coronary artery using a monoplane or biplane X-ray system (Allura Xper FD10/10, Philips Healthcare, Best, The Netherlands) at 15 frames/s. All images were digitally stored on CD-ROM for off-line analysis.
3D-QCA and QFR
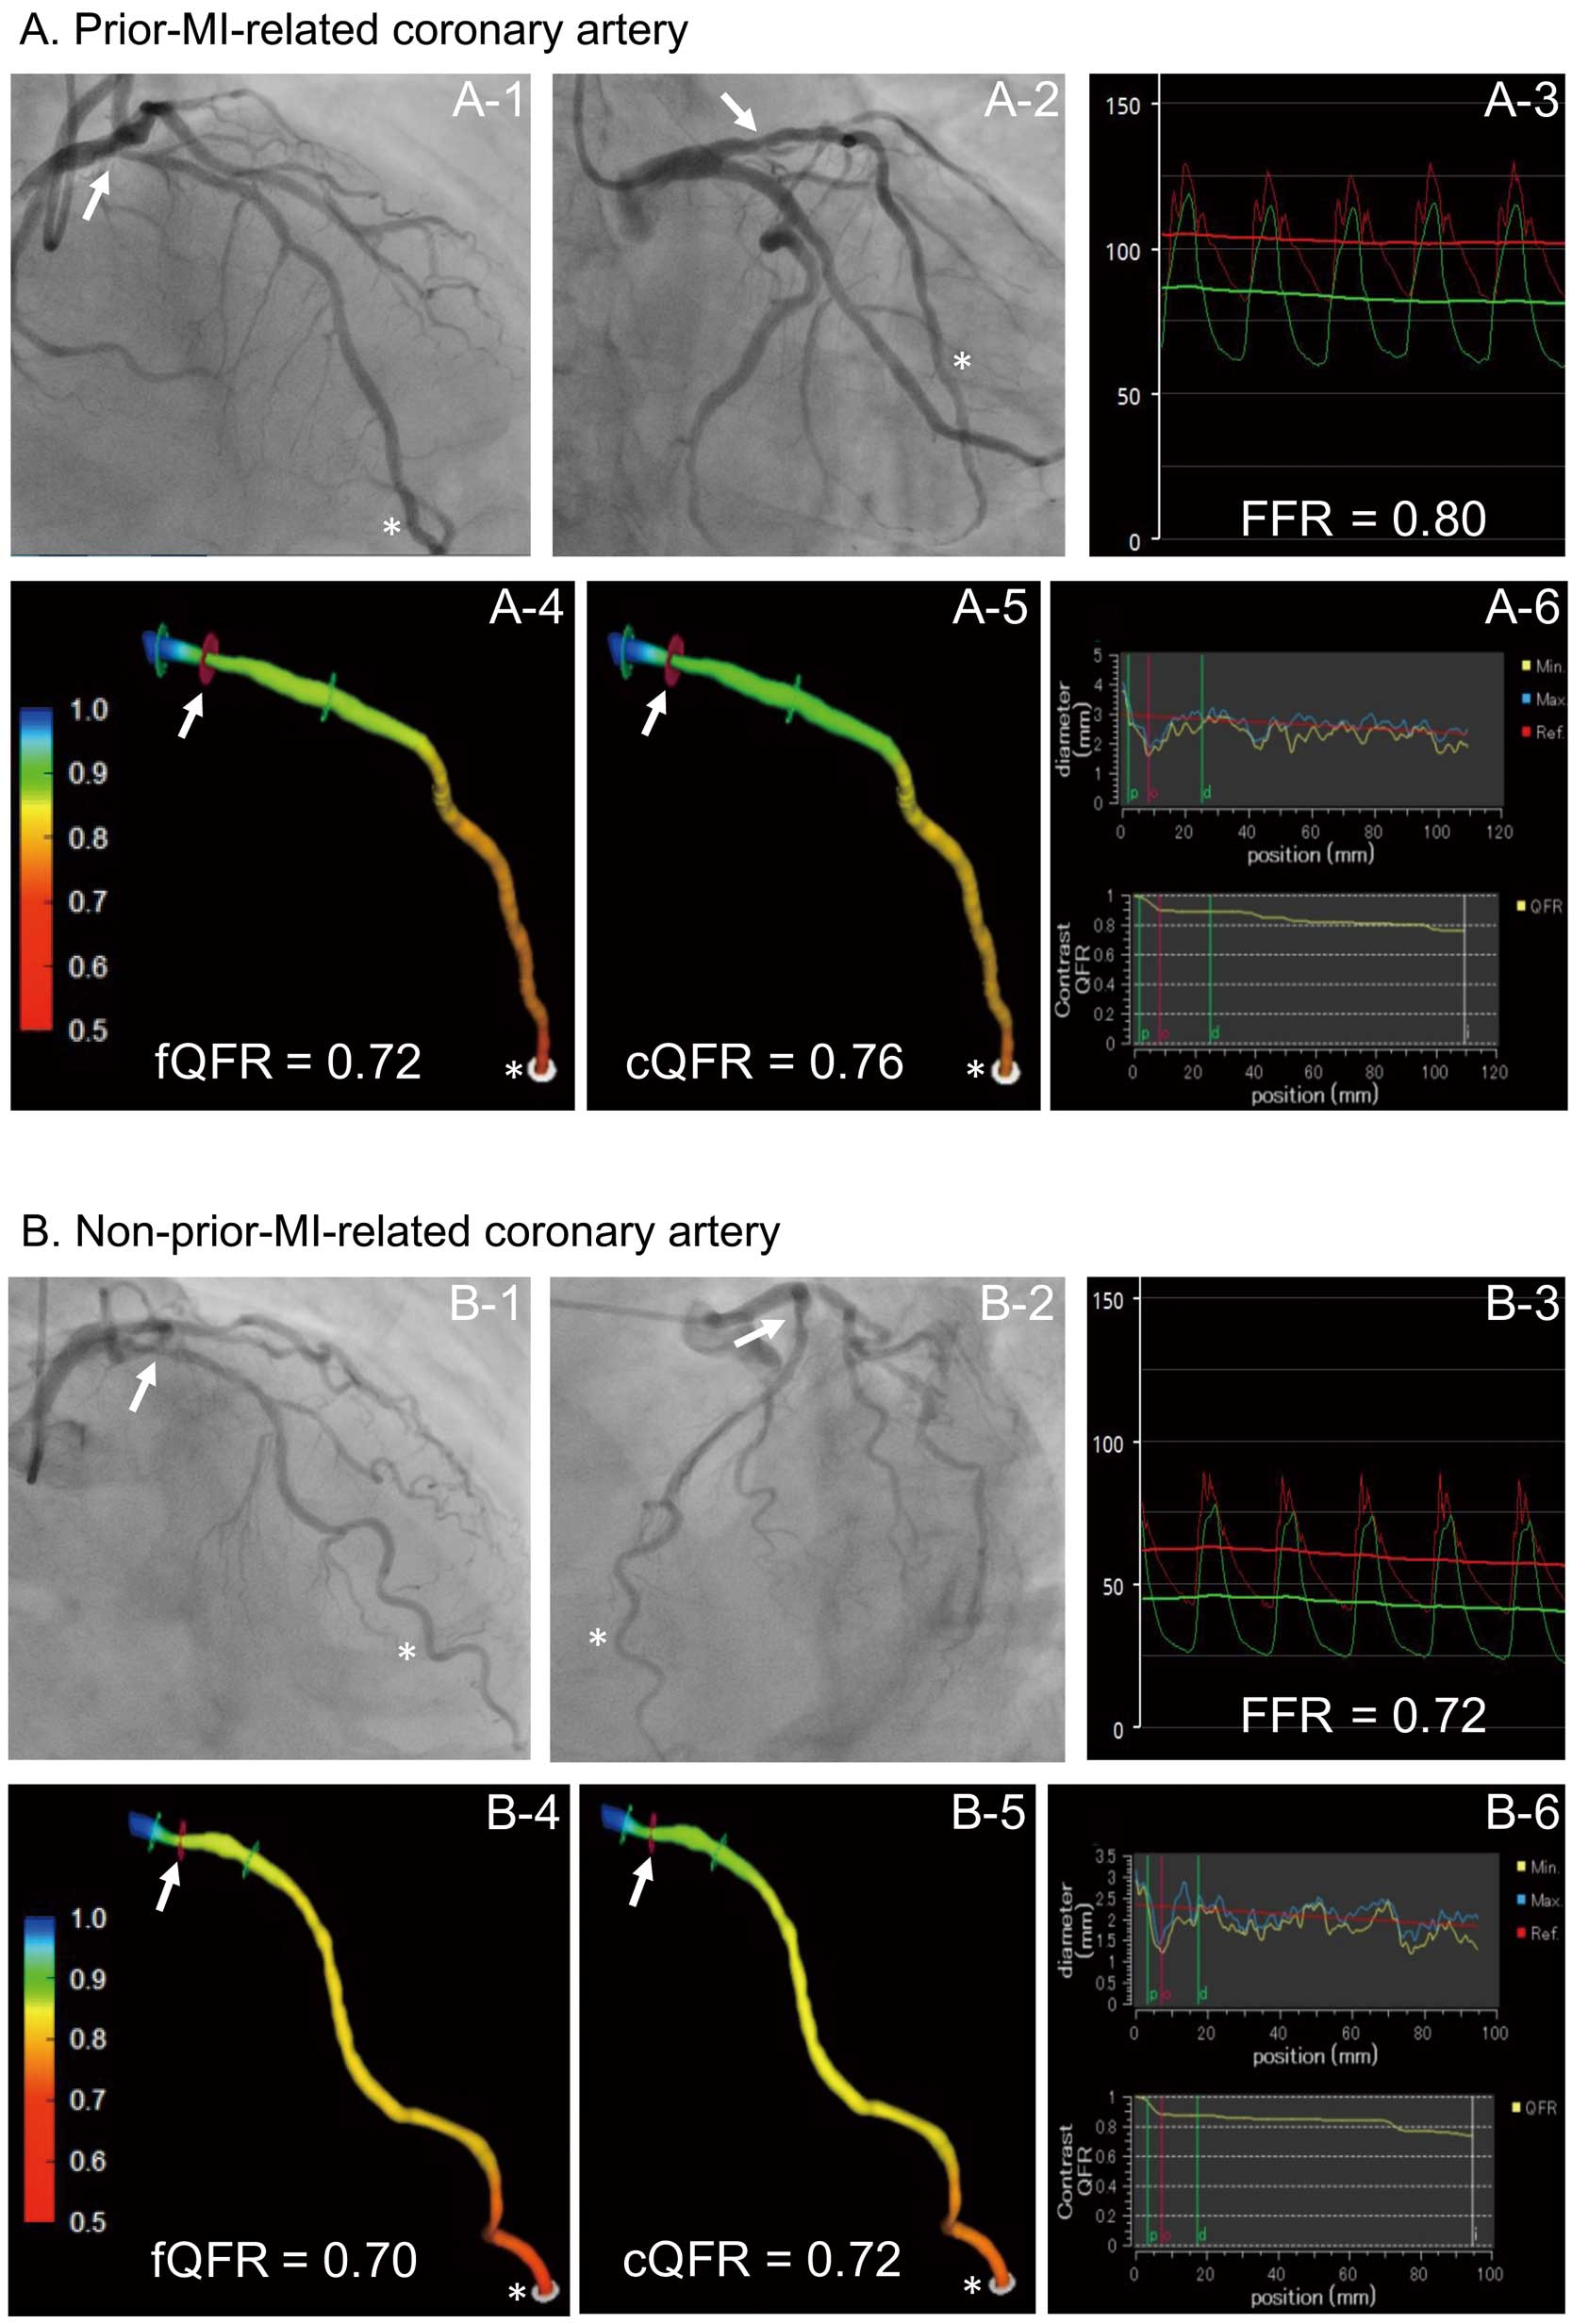
The 3D-QCA analysis and QFR computation were performed using validated software (QAngio XA 3D 1.0.28.4, Medis Medical Imaging System, Leiden, The Netherlands) and an independent investigator (T. Kameyama) who was unaware of the clinical presentations and the FFR results. Two angiographic projections ≥25° apart, which presented the least foreshortening of the stenosis and minimum overlap of the main vessel and side-branches, were used for analysis. In those projections, 2 end-diastolic frames were selected with ECG guidance. The investigator identified 1–2 anatomical landmarks (e.g., bifurcations) as reference points for matching location information in the 2 frames and subsequently indicated the most proximal and distal sites of the vessel. Vessel contours were automatically detected and manually corrected if needed. The software reconstructed a 3D anatomical vessel model without its side-branches for the 3D-QCA analysis and the QFR computation. The 3D-QCA analysis included minimum lumen diameter, reference vessel diameter, percent diameter stenosis (1−[minimum lumen diameter/reference vessel diameter]×100) and lesion length. The QFR computation was performed on the basis of the anatomical information obtained from 3D-QCA, using 2 different flow models: (1) fixed-flow QFR (fQFR) and (2) contrast-flow QFR (cQFR).7
Details of the computational methods and underlying principles of fQFR and cQFR were previously reported by Tu et al.7
In short, fQFR was computed using a fixed empirical hyperemic flow velocity, derived from a previous FFR study. cQFR was computed by using a modelled hyperemic flow velocity, based on the Thrombolysis in Myocardial Infarction (TIMI) frame count analysis without pharmacologically induced hyperemia. The TIMI frame count analysis was performed on the one of the 2 angiographic projections that provided the more well-defined contrast flow. Representative examples of the 3D-QCA analysis and QFR computations are shown in
Figure 1.
Intracoronary pressure was estimated using a 0.014-inch pressure wire (PressureWire; St. Jude Medical, St. Paul, MN, USA). The pressure wire was calibrated and advanced to the tip of the guiding catheter for equalization of pressure/temperature signals. Then, the pressure wire was introduced into the coronary artery and positioned distal to the coronary stenosis. The position of the sensor of the pressure wire was recorded on cinefluorogram, which was used to match the measurement site between FFR and QFR. FFR was calculated as the mean distal coronary pressure, measured by the pressure wire, divided by the mean aortic pressure, simultaneously measured by the guiding catheter, during maximal hyperemia. Maximal hyperemia was induced by continuous intravenous infusion of adenosine 5’-triphosphate at 150 μg/kg/min via the cephalic or femoral vein. Subsequently, the pressure wire was manually pulled slowly back from the most distal to the proximal part of the artery during steady-state maximal hyperemia. When the pressure sensor was pulled back in the guiding catheter, both pressures were checked to exclude any transducer drift.
Statistical Analysis
Statistical analysis was performed with JMP 13.0 (SAS Institute, Cary, NC, USA). Categorical variables are presented as counts and percentages, with comparison using chi-square statistics or Fisher’s exact test if there was an expected cell value <5. Continuous variables are presented as mean±standard deviation and compared using Student’s t-test. Pearson correlation was used to quantify the correlation between FFR and QFR. Agreement between FFR and QFR was assessed by Bland-Altman plot. The Bland-Altman plot depicted the differences of each pair of measurements vs. their mean values with reference lines for the mean difference of all paired measurements. The limits of agreement were defined as mean±1.96 standard deviation of absolute difference. The area under the curve (AUC) in the receiver-operating characteristic (ROC) analysis was used to assess the diagnostic accuracy of QFR for predicting functionally significant stenosis (FFR ≤0.80). The ROC curves were compared using the DeLong method. The performance of QFR ≤0.80 for predicting FFR ≤0.80 was assessed using the sensitivity, specificity, positive predictive value, negative predictive value, positive likelihood ratio, negative likelihood ratio, and diagnostic accuracy. The 95% confidence interval (CI) was added as appropriate. We analyzed the difference in the diagnostic accuracy of QFR ≤0.80 for predicting FFR ≤0.80 between prior-MI-related and non-prior-MI-related coronary arteries by McNemar’s test. A P-value <0.05 was considered statistically significant.
Results
Study Population
We identified a total of 163 patients who underwent both CAG and FFR during the study period. Of them, 13 patients met the exclusion criteria (9 incomplete CAG, 3 ostial lesions, and 1 collateral donor artery). Thus, 150 patients constituted the final study population.
Patients’ Clinical Characteristics and Angiographic Findings
Clinical characteristics were similar between the patients with the prior-MI-related and non-prior-MI-related coronary arteries, except for LVEF (47±8% vs. 56±8%, P<0.001) and regional wall motion abnormalities on echocardiography (Table 1). Angiographic findings, including coronary artery, lesion location and QCA analysis, were comparable between the prior-MI-related and non-prior-MI-related coronary arteries (Table 2).
Table 1.
Patients’ Clinical Characteristics
| |
Prior MI (+)
(n=75) |
Prior MI (−)
(n=75) |
P value |
| Age, years |
69±9 |
70±9 |
0.726 |
| Male sex |
62 (83) |
54 (72) |
0.119 |
| Hypertension |
61 (81) |
64 (85) |
0.511 |
| Dyslipidemia |
45 (60) |
46 (61) |
0.867 |
| Diabetes mellitus |
34 (45) |
36 (48) |
0.743 |
| Current smoker |
17 (23) |
23 (31) |
0.268 |
| Obesity |
22 (29) |
16 (21) |
0.260 |
| Family history of CAD |
13 (17) |
12 (16) |
0.827 |
| LVEF, % |
47±8 |
56±8 |
<0.001 |
| LV regional wall motion |
|
|
<0.001 |
| Normokinesis |
0 (0) |
75 (100) |
|
| Hypokinesis |
44 (58) |
0 (0) |
|
| Akinesis |
26 (35) |
0 (0) |
|
| Dyskinesis |
2 (3) |
0 (0) |
|
| Aneurysm |
3 (4) |
0 (0) |
|
Values are given as mean±standard deviation or n (%). Obesity is defined as body mass index >25 kg/m2. LVEF was measured by echocardiography. CAD, coronary artery disease; LVEF, left ventricular ejection fraction; MI, myocardial infarction.
Table 2.
Angiographic Findings
| |
Prior MI (+)
(n=75) |
Prior MI (−)
(n=75) |
P value |
| Coronary artery |
| LAD |
48 (64) |
49 (65) |
0.097 |
| LCX |
5 (7) |
12 (16) |
|
| RCA |
22 (29) |
14 (19) |
|
| Lesion location |
| Proximal |
28 (37) |
37 (49) |
0.322 |
| Mid |
36 (48) |
30 (40) |
|
| Distal |
11 (15) |
8 (11) |
|
| Previous stent implantation |
66 (88) |
10 (13) |
<0.001 |
| QCA analysis in maximum stenosis |
| Minimum lumen diameter, mm |
1.27±0.06 |
1.30±0.06 |
0.684 |
| Diameter stenosis, % |
53±14 |
54±14 |
0.846 |
| Length, mm |
20.2±9.6 |
20.2±9.9 |
0.965 |
| Reference vessel diameter, mm |
2.71±0.06 |
2.79±0.06 |
0.373 |
Values are given as n (%) or mean±standard deviation. LAD, left anterior descending; LCX, left circumflex; MI, myocardial infarction; QCA, quantitative coronary angiography; RCA, right coronary artery.
FFR (0.79±0.11 vs. 0.76±0.13, P=0.108), fQFR (0.73±0.14 vs. 0.74±0.13, P=0.495) and cQFR (0.77±0.12 vs. 0.76±0.12, P=0.658) were not different between the prior-MI-related and non- prior-MI-related coronary arteries (Table 3).
Table 3.
FFR and QFR
| |
Prior MI (+)
(n=75) |
Prior MI (−)
(n=75) |
P value |
| FFR |
0.79±0.11 |
0.76±0.13 |
0.108 |
| fQFR |
0.73±0.14* |
0.74±0.13 |
0.495 |
| cQFR |
0.77±0.12† |
0.76±0.12 |
0.658 |
| fQFR−FFR |
−0.07±0.08‡ |
−0.02±0.05 |
<0.001 |
| cQFR−FFR |
−0.02±0.06 |
0.00±0.04 |
0.010 |
Values are given as mean±standard deviation or n (%). *vs. FFR: P=0.002; †vs. fQFR: P<0.001; ‡vs. cQFR−FFR: P<0.001. cQFR, contrast-flow QFR; FFR, fractional flow reserve; fQFR, fixed-flow QFR; MI, myocardial infarction; QFR, quantitative flow ratio.
fQFR vs. FFR
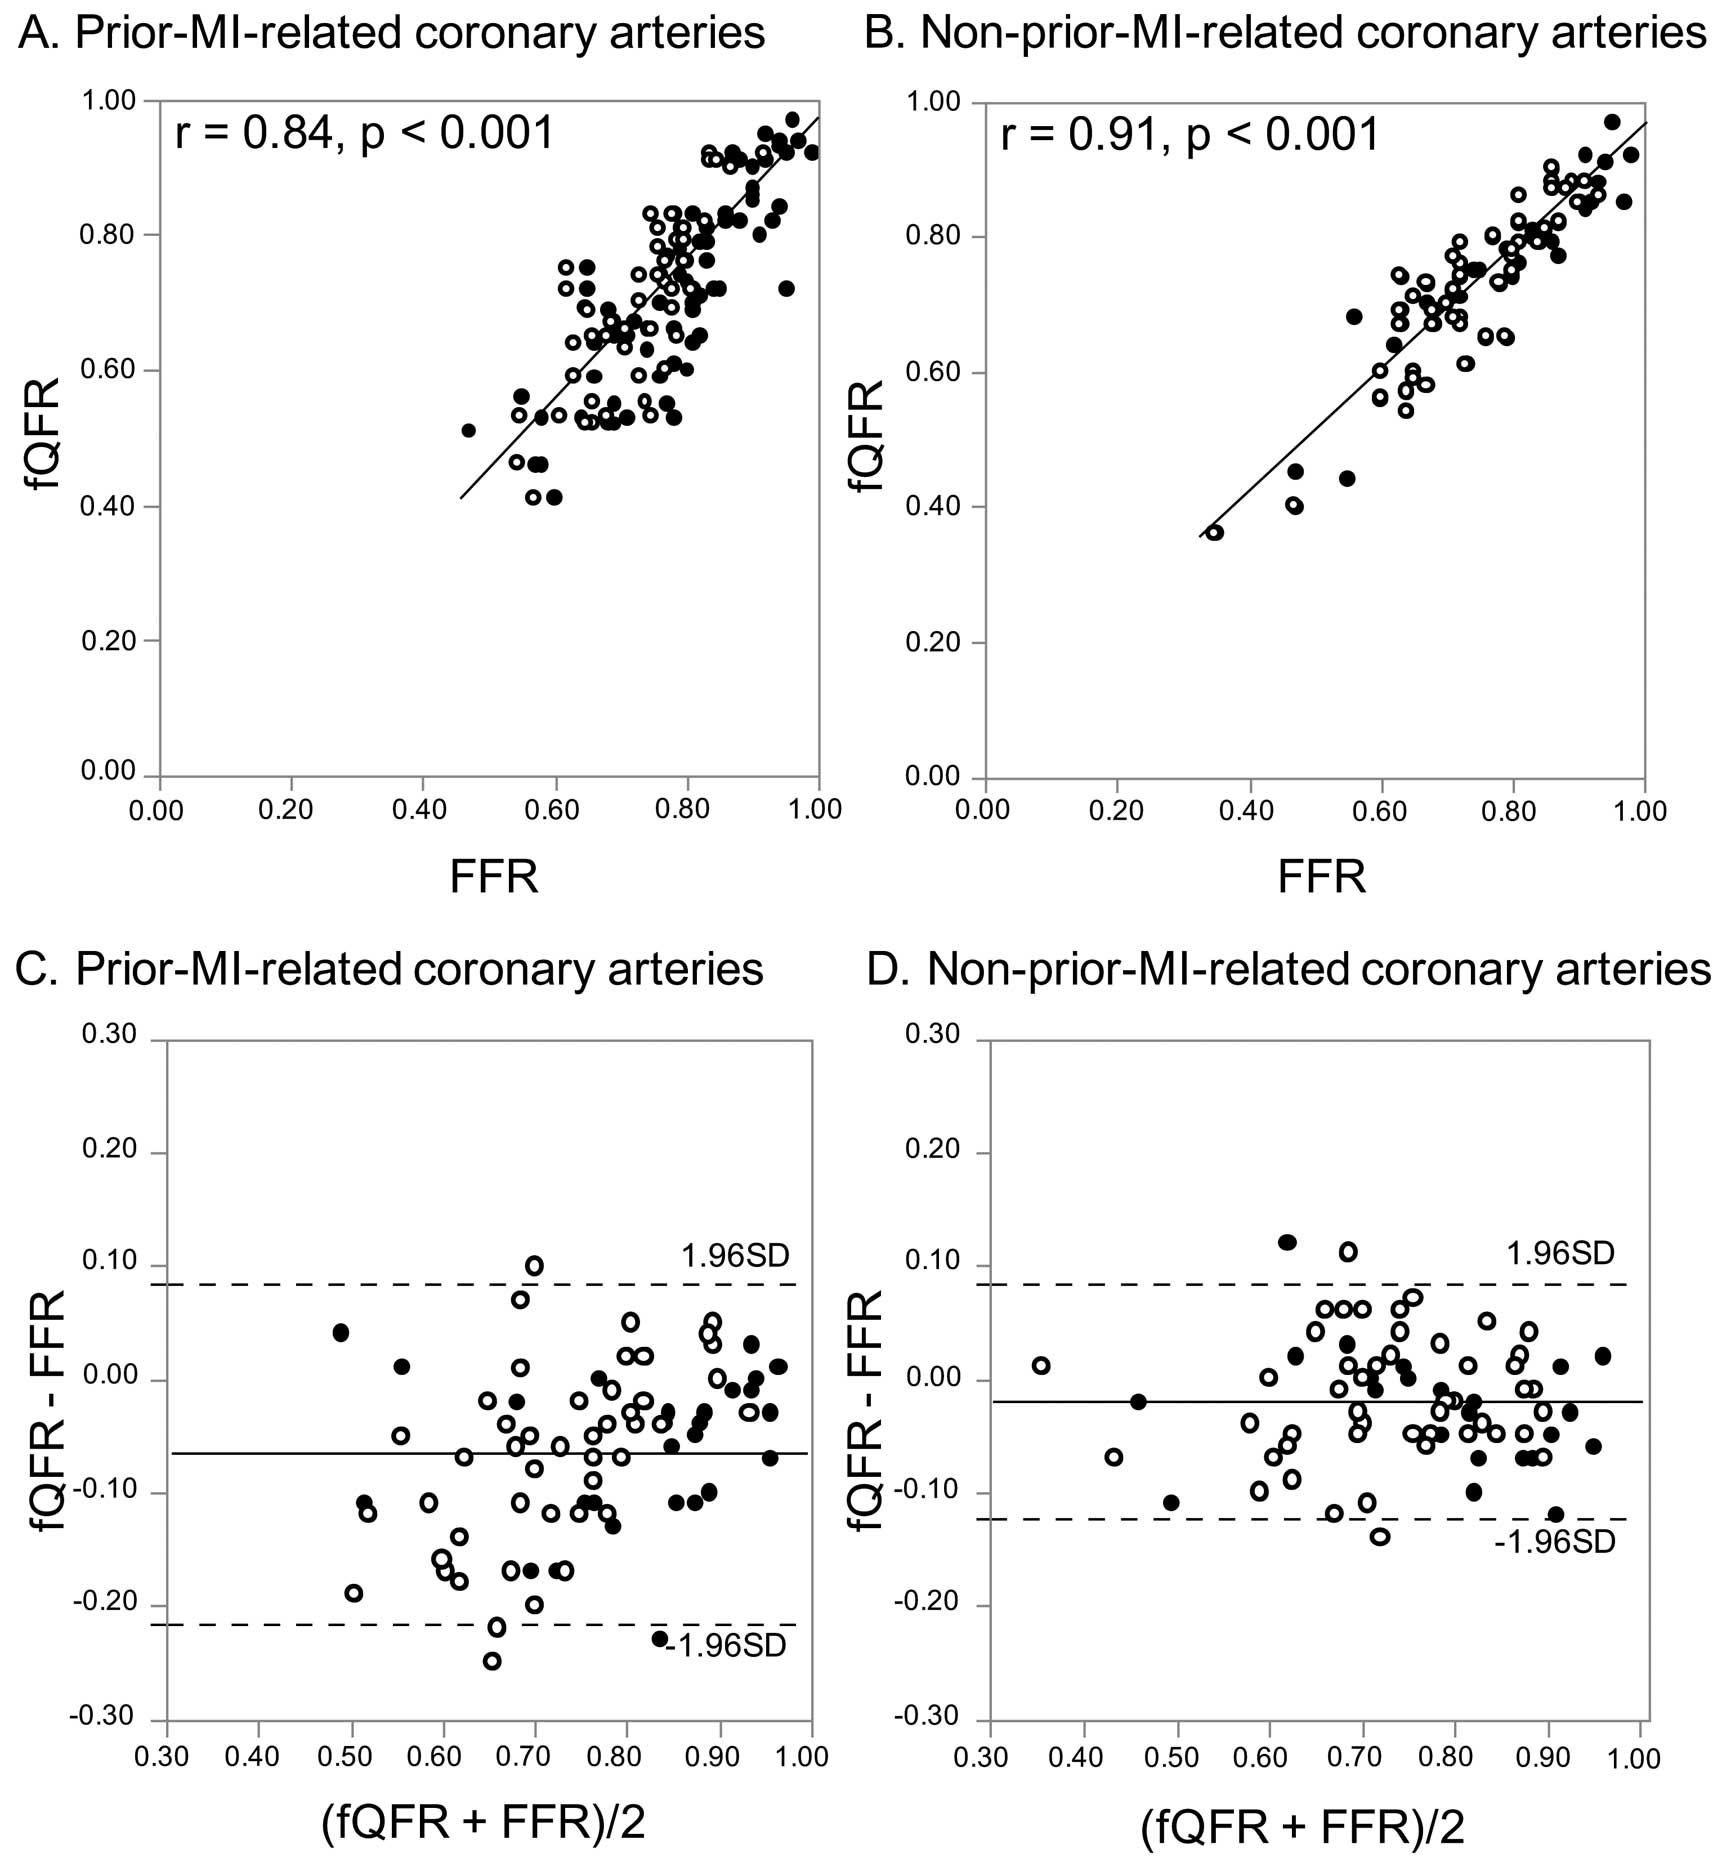
fQFR directly correlated with FFR in both the prior-MI-related coronary arteries (r=0.84, P<0.001) and non-prior-MI-related coronary arteries (r=0.91, P<0.001) (Figure 2A,B). fQFR was significantly smaller than FFR in the prior-MI-related coronary arteries (0.73±0.14 vs. 0.79±0.11, P=0.002), but there was no statistically significant difference between fQFR and FFR in the non-prior-MI-related coronary arteries (0.74±0.13 vs. 0.76±0.13, P=0.356) (Table 3). The value of fQFR minus FFR was significantly lower in the prior-MI-related coronary arteries compared with the non-prior-MI-related coronary arteries, and the standard deviation of fQFR minus FFR was approximately 1.6-fold as large in the prior-MI-related coronary arteries compared with the non-prior-MI-related coronary arteries (−0.07±0.08 vs. −0.02±0.05, P<0.001) (Table 3,
Figure 2C,D).
cQFR vs. FFR
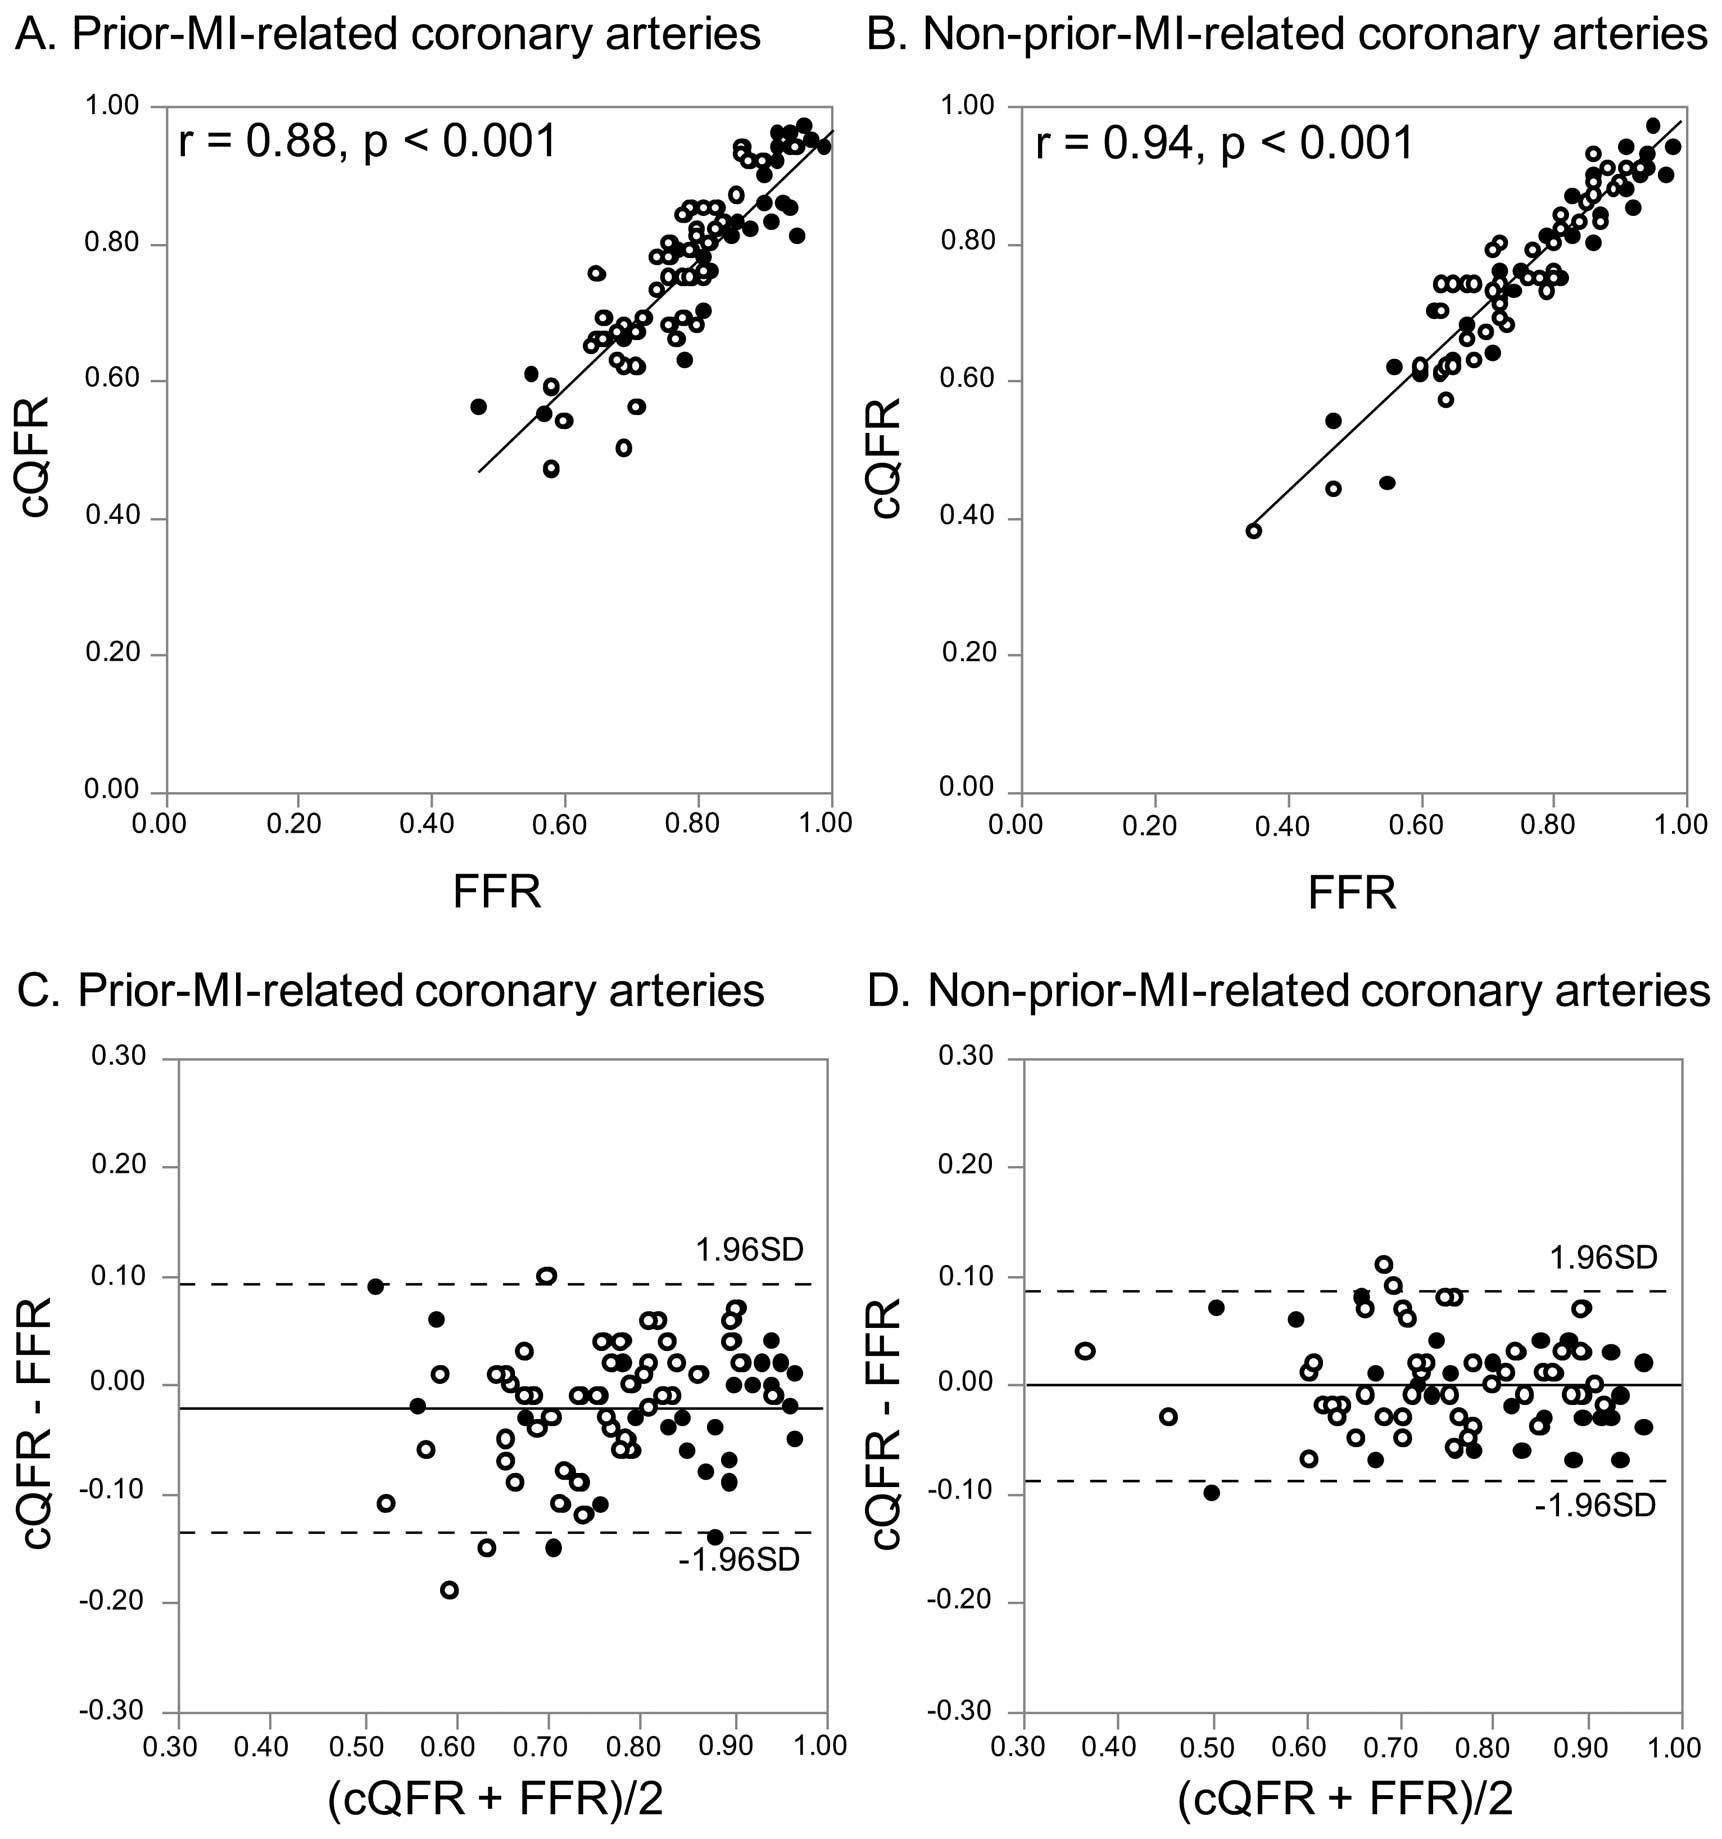
cQFR directly correlated with FFR in the prior-MI-related coronary arteries (r=0.88, P<0.001) and the non-prior-MI-related coronary arteries (r=0.94, P<0.001) (Figure 3A,B). There was no statistically significant difference between cQFR and FFR in the prior-MI-related coronary arteries (0.77±0.12 vs. 0.79±0.11, P=0.271) and the non-prior-MI-related coronary arteries (0.76±0.12 vs. 0.76±0.13, P=0.984) (Table 3). The value of cQFR minus FFR was significantly lower in the prior-MI-related coronary arteries compared with the non-prior-MI-related coronary arteries, and the standard deviation of cQFR minus FFR was approximately 1.5-fold as large in the prior-MI-related coronary arteries compared with the non-prior-MI-related coronary arteries (−0.02±0.06 vs. 0.00±0.04, P=0.010) (Table 3,
Figure 3C,D).
Accuracy of QFR for Predicting FFR ≤0.80
In the ROC analysis, the AUCs for fQFR and cQFR were numerically smaller in the prior-MI-related coronary arteries compared with the non-prior-MI-related coronary arteries (fQFR: 0.90 [95% CI: 0.81–0.95] vs. 0.97 [95% CI: 0.93–0.99]; and cQFR: 0.93 [95% CI: 0.86–0.97] vs. 0.97 [95% CI: 0.93–0.99]) (Figure 4). The diagnostic accuracies of fQFR ≤0.8 and cQFR ≤0.8 for predicting FFR ≤0.80 were numerically lower in the prior-MI-related coronary arteries compared with the non-prior-MI-related coronary arteries, but the differences were not statistically significant (fQFR: 77% [95% CI: 68–81%] vs. 87% [ 95% CI: 78–89%], P=0.137; and cQFR: 87% [95% CI: 77–92%] vs. 92% [95% CI: 84–96%], P=0.290) (Table 4).
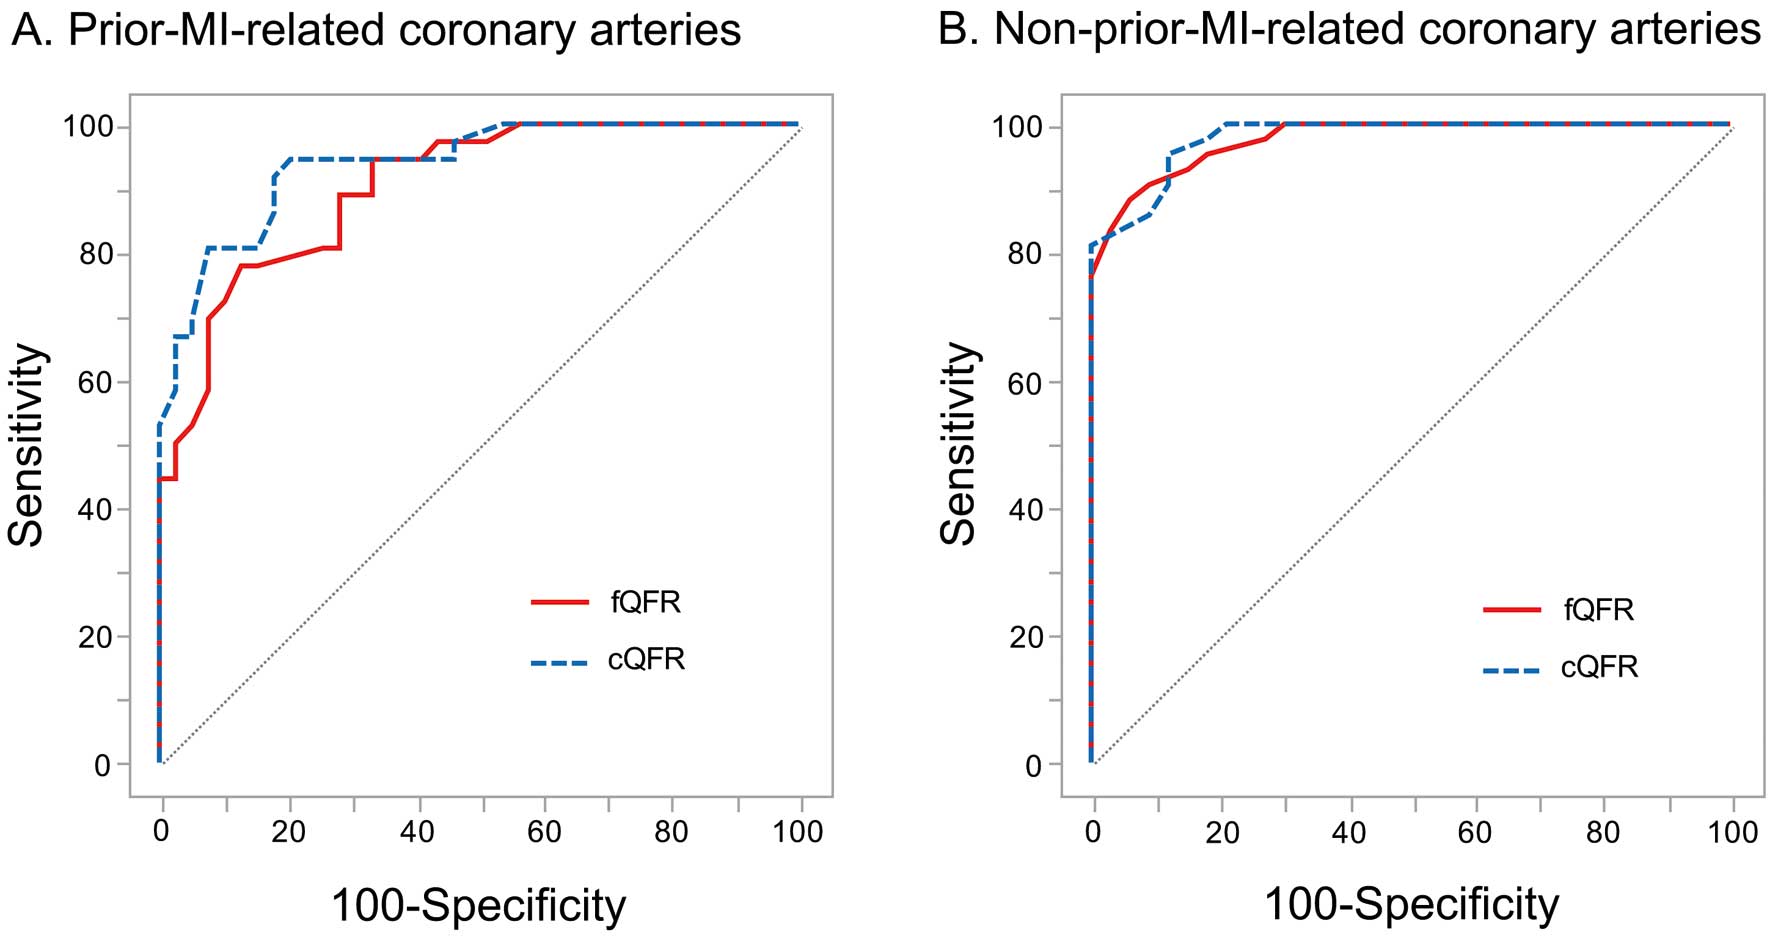
Table 4.
Diagnostic Performance of QFR ≤0.80 for Predicting FFR ≤0.80
| |
Prior MI (+) |
Prior MI (−) |
| fQFR ≤0.80 |
cQFR ≤0.80 |
fQFR ≤0.80 |
cQFR ≤0.80 |
| Overall |
| True positive |
34 (45) |
33 (48) |
41 (55) |
40 (53) |
| True negative |
24 (32) |
32 (43) |
24 (32) |
29 (39) |
| False positive |
15 (20) |
7 (9) |
9 (12) |
4 (5) |
| False negative |
2 (3) |
3 (4) |
1 (1) |
2 (3) |
| Accuracy, % |
77 (68–81) |
87 (77–92) |
87 (78–89) |
92 (84–96) |
| Sensitivity, % |
94 (85–98) |
92 (82–97) |
98 (90–99) |
95 (88–99) |
| Specificity, % |
62 (53–65) |
82 (73–87) |
73 (63–75) |
88 (79–92) |
| Positive predictive value, % |
69 (62–72) |
83 (74–87) |
82 (76–84) |
91 (84–94) |
| Negative predictive value, % |
92 (79–98) |
91 (82–97) |
96 (84–99) |
94 (84–98) |
| Positive likelihood ratio |
2.5 (1.8–2.8) |
5.1 (3.0–7.3) |
3.6 (2.5–4.0) |
7.9 (4.1–12.4) |
| Negative likelihood ratio |
0.1 (0.0–0.3) |
0.1 (0.0–0.2) |
0.0 (0.0–0.2) |
0.1 (0.0–0.2) |
| LAD |
| True positive |
31 (65) |
29 (61) |
35 (71) |
35 (71) |
| True negative |
8 (17) |
11 (23) |
12 (25) |
14 (29) |
| False positive |
7 (14) |
4 (8) |
2 (14) |
0 (0) |
| False negative |
2 (4) |
4 (8) |
0 (0) |
0 (0) |
| Accuracy, % |
81 (70–87) |
83 (71–91) |
95 (87–96) |
100 (95–100) |
| Sensitivity, % |
94 (86–98) |
88 (79–94) |
100 (94–100) |
100 (88–100) |
| Specificity, % |
53 (36–63) |
73 (54–86) |
86 (71–86) |
100 (88–100) |
| Positive predictive value, % |
82 (75–85) |
88 (79–94) |
95 (89–95) |
100 (95–100) |
| Negative predictive value, % |
80 (53–94) |
73 (54–86) |
100 (82–100) |
100 (88–100) |
| Positive likelihood ratio |
2.0 (1.3–2.6) |
3.3 (1.7–6.7) |
7.0 (3.2–7.0) |
– |
| Negative likelihood ratio |
0.1 (0.0–0.4) |
0.2 (0.1–0.4) |
0.0 (0.0–0.1) |
– |
Values are given as n (%), n (95% CI) or n% (95% CI). Abbreviations as in Tables 2,3.
An analysis in the vessels restricted to the left anterior descending (LAD) coronary artery did not alter the results for the diagnostic performance of QFR ≤0.80 for predicting FFR ≤0.80 (Table 4).
Discussion
The main findings of the present study were: (1) both fQFR and cQFR directly correlated with FFR in both prior-MI-related coronary arteries and non-prior-MI-related coronary arteries; (2) fQFR was significantly smaller than FFR in prior-MI-related coronary arteries; (3) the values of fQFR minus FFR and cQFR minus FFR were significantly lower in prior-MI-related coronary arteries compared with the non-prior-MI-related coronary arteries; and (4) the diagnostic accuracies of fQFR ≤0.8 and cQFR ≤0.8 for predicting FFR ≤0.80 were numerically lower in prior-MI-related coronary arteries compared with non-prior-MI-related coronary arteries. When FFR is used as the gold standard, QFR seems to overestimate the functional severity of coronary stenosis in prior-MI-related coronary arteries.
QFR vs. FFR
QFR emerges as a safe, efficient and cost-effective method of assessing the functional severity of coronary stenosis through diagnostic angiography. An initial study of QFR assessed the diagnostic accuracy of QFR (i.e., FFRQCA) in patients with intermediate coronary stenosis using FFR as the gold standard.6
QFR showed a direct correlation (r=0.81, P<0.001) and good agreement (mean difference: 0.00±0.06, P=0.541) with FFR.6
The accuracy of QFR for predicting FFR ≤0.80 was 88%, with positive and negative predictive values of 82% and 91%, respectively.6
In addition, subsequent studies showed that QFR (i.e., fQFR, cQFR and adenosine-flow QFR [measured hyperemic flow velocity derived from angiography during adenosine-induced hyperemia]) is highly reliable in the evaluation of CAD.7,8
QFR is the method showing most promise for assessing the functional severity of coronary stenosis.
fQFR in Prior-MI-Related Coronary Arteries
Previous studies have reported the failure of anatomical severity on angiogram to reflect or predict the functional severity of CAD in prior-MI-related coronary arteries.11
Angiographically significant coronary stenoses in prior-MI-related coronary arteries have the potential to be negative for FFR because the amount of viable myocardium is reduced in the affected region.11
In the present study, fQFR was smaller than FFR in prior-MI-related coronary arteries. Unlike FFR, fQFR is based only on anatomic information obtained from 3D-QCA and thus might not be able to take into account the amount of viable myocardium.
cQFR in Prior-MI-Related Arteries
cQFR is derived from 3D-QCA by applying the TIMI frame count analysis, which is a simple index of coronary blood flow. A clinical validation study showed that cQFR was more accurate for predicting FFR ≤0.80 as compared with fQFR (86% vs. 80%; difference in AUC: 0.04; 95% CI: 0.01–0.08; P<0.017). In our results, however, even for cQFR, the value of cQFR minus FFR was significantly lower in prior-MI-related coronary arteries compared with non-prior-MI-related arteries. This means that the TIMI frame count analysis may be insufficient for reflecting the amount of viable myocardium.13
The present study suggests that caution is needed when assessing the functional severity of coronary stenosis in prior-MI-related coronary arteries by cQFR or fQFR.
Discrepancy Between QFR and FFR
There are some cases of patients being unsuitable for the evaluation of stenosis severity by angiography. In diffuse disease or tandem lesions, the anatomic indexes on angiography (i.e., percent diameter stenosis) underestimate the functional severity of coronary stenosis. In lesions with angiographic haziness caused by calcification or thrombus and in lesions with ulceration caused by plaque rupture, angiography cannot accurately acquire the anatomic information about the coronary lumen. In the collateral donor arteries also, there is a discrepancy between angiographic stenosis severity and functional indexes. Therefore, the evaluation of functional severity of coronary stenosis by QFR might not be accurate in those cases.
Study Limitations
There are several limitations to note. First, QFR was estimated from previously obtained angiograms. However, we performed angiography with an automated contrast injector, and an experienced investigator conducted the QFR analysis. Second, the decision about FFR measurement was at the discretion of operators, which might lead to selection bias. Finally, the amount of viable myocardium within the infarct zone was not assessed in the present study. Further study is needed to assess the relationship between the amount of viable myocardium and the diagnostic accuracy of QFR.
Conclusions
When FFR is used as the gold standard, the accuracy of QFR for assessing the functional severity of a coronary stenosis might be reduced in prior-MI-related coronary arteries compared with non-prior-MI-related coronary arteries.
Conflict of Interest
T.A. has served on the advisory boards of St. Jude Medical, and has received lecture fees and research grants from St. Jude Medical. All other authors report that they have no relationships relevant to the content of this paper to disclose.
References
- 1.
Pijls NH, De Bruyne B, Peels K, Van Der Voort PH, Bonnier HJ, Bartunek J, et al. Measurement of fractional flow reserve to assess the functional severity of coronary-artery stenoses. N Engl J Med 1996; 334: 1703–1708.
- 2.
De Bruyne B, Baudhuin T, Melin JA, Pijls NH, Sys SU, Bol A, et al. Coronary flow reserve calculated from pressure measurements in humans: Validation with positron emission tomography. Circulation 1994; 89: 1013–1022.
- 3.
Shiono Y, Kubo T, Tanaka A, Kitabata H, Ino Y, Tanimoto T, et al. Impact of myocardial supply area on the transstenotic hemodynamics as determined by fractional flow reserve. Catheter Cardiovasc Interv 2014; 84: 406–413.
- 4.
Pijls NH, van Son JA, Kirkeeide RL, De Bruyne B, Gould KL. Experimental basis of determining maximum coronary, myocardial, and collateral blood flow by pressure measurements for assessing functional stenosis severity before and after percutaneous transluminal coronary angioplasty. Circulation 1993; 87: 1354–1367.
- 5.
Pijls NH, Bech GJ, el Gamal MI, Bonnier HJ, De Bruyne B, Van Gelder B, et al. Quantification of recruitable coronary collateral blood flow in conscious humans and its potential to predict future ischemic events. J Am Coll Cardiol 1995; 25: 1522–1528.
- 6.
Tu S, Barbato E, Köszegi Z, Yang J, Sun Z, Holm NR, et al. Fractional flow reserve calculation from 3-dimensional quantitative coronary angiography and TIMI frame count. JACC Cardiovasc Interv 2014; 7: 768–777.
- 7.
Tu S, Westra J, Yang J, von Birgelen C, Ferrara A, Pellicano M, et al. Diagnostic accuracy of fast computational approaches to derive fractional flow reserve from diagnostic coronary angiography: The International Multicenter FAVOR Pilot Study. JACC Cardiovasc Interv 2016; 9: 2024–2035.
- 8.
Yazaki K, Otsuka M, Kataoka S, Kahata M, Kumagai A, Inoue K, et al. Applicability of 3-dimensional quantitative coronary angiography-derived computed fractional flow reserve for intermediate coronary stenosis. Circ J 2017; 81: 988–992.
- 9.
Klein LW, Agarwal JB, Schneider RM, Hermann G, Weintraub WS, Helfant RH. Effects of previous myocardial infarction on measurements of reactive hyperemia and the coronary vascular reserve. J Am Coll Cardiol 1986; 8: 357–363.
- 10.
Uren NG, Crake T, Lefroy DC, De Silva R, Davies GJ, Maseri A. Reduced coronary vasodilator function in infarcted and normal myocardium after myocardial infarction. N Engl J Med 1994; 331: 222–227.
- 11.
De Bruyne B, Pijls NH, Bartunek J, Kulecki K, Bech JW, De Winter H, et al. Fractional flow reserve in patients with prior myocardial infarction. Circulation 2001; 104: 157–162.
- 12.
Usui Y, Chikamori T, Yanagisawa H, Morishima T, Hida S, Tanaka N, et al. Reliability of pressure-derived myocardial fractional flow reserve in assessing coronary artery stenosis in patients with previous myocardial infarction. Am J Cardiol 2003; 92: 699–702.
- 13.
Kunadian V, Harrigan C, Zorkun C, Palmer AM, Ogando KJ, Biller LH, et al. Use of the TIMI frame count in the assessment of coronary artery blood flow and microvascular function over the past 15 years. J Thromb Thrombolysis 2009; 27: 316–328.
