Abstract
Background:
The in vivo lesion morphologies and plaque components of coronary chronic total occlusion (CTO) lesions remain unclear.
Methods and Results:
We investigated 57 consecutive CTO lesions in 57 patients with stable angina pectoris undergoing elective percutaneous coronary intervention with intravascular ultrasound (IVUS) and coronary angioscopy (CAS) examination. All CTO lesions were classified according to the proximal angiographic lumen pattern; tapered-type (T-CTO) and abrupt-type (A-CTO). The differences in the intracoronary images of these lesion types were evaluated according to the location within the CTO segment. A total of 35 lesions (61.4%) were T-CTO. T-CTO lesions had higher frequencies of red thrombi (proximal 71.4%; middle 74.3%; distal 31.4%; P<0.001) and bright-yellow plaques (yellow-grade 2–3) (48.6%; 74.3%; 2.9%; P<0.001) at the proximal or middle than at the distal subsegment; A-CTO lesions showed no significant differences among the 3 sub-segments. At the middle subsegment, T-CTO lesions showed higher frequencies of positive remodeling (51.4% vs. 18.2%, P=0.01) and bright-yellow plaques (74.3% vs. 13.6%, P<0.001) compared with A-CTO lesions. Multivariate analysis identified bright-yellow plaque as an independent predictor (odds ratio, 7.25; 95% confidence interval, 1.25–42.04; P=0.03) of the occurrence of periprocedural myocardial necrosis.
Conclusions:
The combination of IVUS and CAS analysis may be useful for identifying lesion morphology and plaque components, which may help clarify the pathogenetic mechanism of CTO lesions.
Coronary chronic total occlusion (CTO) is not uncommon in patients undergoing non-urgent coronary angiography.1
Successful recanalization of coronary CTO lesions may improve long-term outcomes,2,3
but understanding the lesion pathology is important for procedural improvement, leading to good outcomes for patients. A recent study demonstrated the pathological findings of CTO lesions in human coronary artery autopsies,4
but the in vivo lesion morphologies and plaque components in CTO lesions remain unclear.
Although intravascular ultrasound (IVUS) images are commonly used both for assessing lesion morphology and achieving good procedural results in CTO lesions,5,6
the reliability of plaque characterization by IVUS remains undetermined.7
In contrast, coronary angioscopy (CAS) provides direct visualization of atheromatous plaques, which may help assess coronary plaque components more accurately and with more detail compared with other imaging techniques.8
Angioscopic atheromatous plaque components such as thrombus or yellow plaque have been pathologically validated9
and previous studies have reported that CAS images might provide information on pathogenic substrates in CTO lesions.10
CTO lesions have a considerable amount of atheromatous plaque, which may lead to distal embolization and periprocedural myocardial necrosis (PMN). PMN, diagnosed by elevated cardiac biomarker levels, is not uncommon and is related to adverse outcomes, even in patients with small elevations in cardiac biomarkers and clinically uneventful percutaneous coronary intervention (PCI).11
However, few studies have reported the relationship between plaque components and PMN occurrence in coronary CTO lesions. We hypothesized that the combined use of IVUS and CAS imaging would give optimal evaluation of the tissue characteristics in coronary CTO lesions, clarifying the pathogenetic mechanism. Accordingly, we aimed to investigate the differences in lesion morphology and plaque components evaluated with IVUS and CAS, according to clinical and angiographic findings in patients with stable angina pectoris (SAP) undergoing elective PCI for CTO. We also assessed the relationship between plaque morphology and PMN occurrence in coronary CTO lesions.
Methods
Study Population
We retrospectively reviewed 80 SAP patients with 80 native coronary CTO lesions who underwent IVUS and CAS during PCI between January 2013 and December 2015 at Yokosuka Kyosai Hospital. SAP was defined as a positive stress test for myocardial ischemia with no change in frequency, duration, or intensity of anginal symptoms within 6 weeks before PCI. We excluded lesions with a distal protection device, final angiographic evidence of side branch occlusions, coronary dissection, no-reflow phenomenon (Thrombolysis in Myocardial Infarction [TIMI] flow grade 0–2), or unsatisfactory IVUS and/or CAS image quality. Left main trunk lesions, in-stent restenosis lesions, coronary artery bypass graft lesions, multiple culprit lesions, patients undergoing PCI at another coronary site within 1 month, lesions treated by retrograde approach, patients with renal insufficiency (creatinine >3.0 mg/dL) or requiring hemodialysis, and patients with accompanying congestive heart failure before PCI were also excluded. Thus, 57 patients were finally included in the study. IVUS or CAS data were acquired before balloon dilatation after wire-crossing, and if this was difficult, the data were collected after dilation with a small balloon (1.0–1.5 mm diameter) to acquire the minimum diameter for crossing with the IVUS or CAS catheter. All lesions were classified according to the proximal angiographic lumen pattern: tapered-type (T-CTO) and abrupt-type (A-CTO). Differences in clinical characteristics, angiographic findings, intracoronary image data, and procedural results were evaluated between the 2 groups. Further, CTO lesions were divided into 3 sub-segments: proximal, middle, and distal subsegment (Figure 1), and the intracoronary images were compared among the sub-segments. Additionally, the relationships between the various findings and PMN occurrence were assessed. The Institutional Review Committee of Yokosuka Kyosai Hospital approved the study, and all patients gave written informed consent.

Blood samples were drawn from all patients immediately before PCI. Values of cardiac troponin-T (cTnT) were determined immediately before and after PCI, and 24 h after PCI using a high-sensitivity (hs)-cTnT assay (Elecsys Troponin T high-sensitive assay, Roche Diagnostics, Basel, Switzerland: lower detection limit, 3 ng/L; coefficient of variation <10% at 14 ng/L [99th percentile of the reference control group]). PMN was defined as a peak hs-cTnT value during the 24 h after PCI of >70 ng/L (5-fold the 99th percentile of the upper reference limit [URL]) in patients with normal baseline level [hs-cTnT <14 ng/L], or >5-fold the baseline level if pre-PCI hs-cTnT ≥14 ng/L).12,13
Additional laboratory data were obtained before PCI according to established procedures.
Angiographic Analysis and Interventional Procedure
Quantitative coronary angiography was performed with CAAS 4.1.1 software (Pie Medical Imaging, Maastricht, The Netherlands). CTO was defined as complete obstruction of the vessel with TIMI flow grade 0 and an estimated duration ≥3 months. CTO age was determined as the interval from the last diagnostic coronary angiogram documenting a CTO or, in patients without previous angiography, the duration of ischemic symptoms.14,15
The length of the occlusion was measured via either antegrade or retrograde (during bilateral simultaneous injection) filling of the distal vessel.14,16
Coronary flow was assessed according to TIMI flow grade17
and myocardial perfusion was assessed using myocardial blush grade.18
Collateral flow was graded according to Rentrop’s classification.19
The angiographic lumen pattern at the proximal site was classified as T-CTO showing an occluded segment with a funnel-shaped end or as A-CTO not showing this feature.20
All patients were treated with aspirin (100 mg/day) and a thienopyridine (ticlopidine [200 mg/day], clopidogrel [75 mg/day], or prasugrel [3.75 mg/day]). Before PCI, all patients received intravenous heparin (8,000–10,000 IU). All CTO interventions were performed via an antegrade approach. The PCI for the CTO was performed with contemporary techniques such as bilateral injection, use of a specialized hydrophilic, tapered tip, and stiff wires, parallel wires, and microcatheters as they became available.2
The angiographic endpoint was <25% residual stenosis on quantitative coronary angiography. All patients underwent drug-eluting stent implantation.
To identify the severity of CTO lesions, the J-CTO (Multicenter CTO Registry in Japan) score was calculated.20
IVUS Image Acquisition and Analysis
IVUS was performed after intracoronary administration of nitroglycerin (0.2 mg). A 40-MHz rotational IVUS imaging catheter (Boston Scientific, Natick, MA, USA) was automatically retracted at 0.5 mm/s from >10 mm distal to the proximal side (>10 mm proximal or the aorto-ostial junction) of the culprit lesion, but before any large side branch. The IVUS images were recorded on a DVD for offline analysis (QIvus 2.0; Medis Medical Imaging Systems, Leiden, The Netherlands). Quantitative measurements and qualitative gray-scale IVUS assessments were performed, as previously described.21
The reference site was selected as the most normal-looking region 10-mm distal and proximal to the CTO segment. CTO segments were qualitatively classified into the 3 sub-segments. Of these, the proximal and distal sub-segments were defined as the proximal and distal ends of the CTO lesion, and the middle subsegment was defined as the remaining region including the center of the CTOs. IVUS images were matched with the corresponding segment on the coronary angiograms according to landmarks within the vessel, usually side branches14
(Figure 1).
The cross-sectional areas (CSAs) of the external elastic membrane (EEM) and lumen were measured at each subsegment of the CTO lesion (proximal, distal ends and the center of the CTO) and at reference sites. The plaque area was calculated using the difference between lumen-CSA and EEM-CSA, and plaque burden was calculated as: plaque area÷EEM-CSA×100 (%). The remodeling index was defined as: EEM-CSA at the culprit site÷proximal reference EEM-CSA. Positive and negative remodeling were defined as a remodeling index >1.00 and <1.00, respectively.22
Severe calcification was defined as bright echoes with >180° of acoustic shadowing.
Angioscopic Image Acquisition and Analysis
CAS was performed before and after PCI using a non-occlusive CAS system (FT-203F angioscope and VISIBLE fiber; Fiber Tech Co., Ltd., Tokyo, Japan), as previously reported.23
The outer section of a 4-Fr probing catheter was used as a guide for inserting the optic fiber into the coronary artery. CAS was performed while the blood was cleared away from view by an injection of 3% dextran. Before CAS observation, the white balance was adjusted for color correction. The position of the angioscopic catheter was confirmed with simultaneous fluoroscopy during the imaging procedure to ensure that CAS images were obtained at the target positions within the CTO lesion. CAS data were recorded on digital video disks for offline analysis.
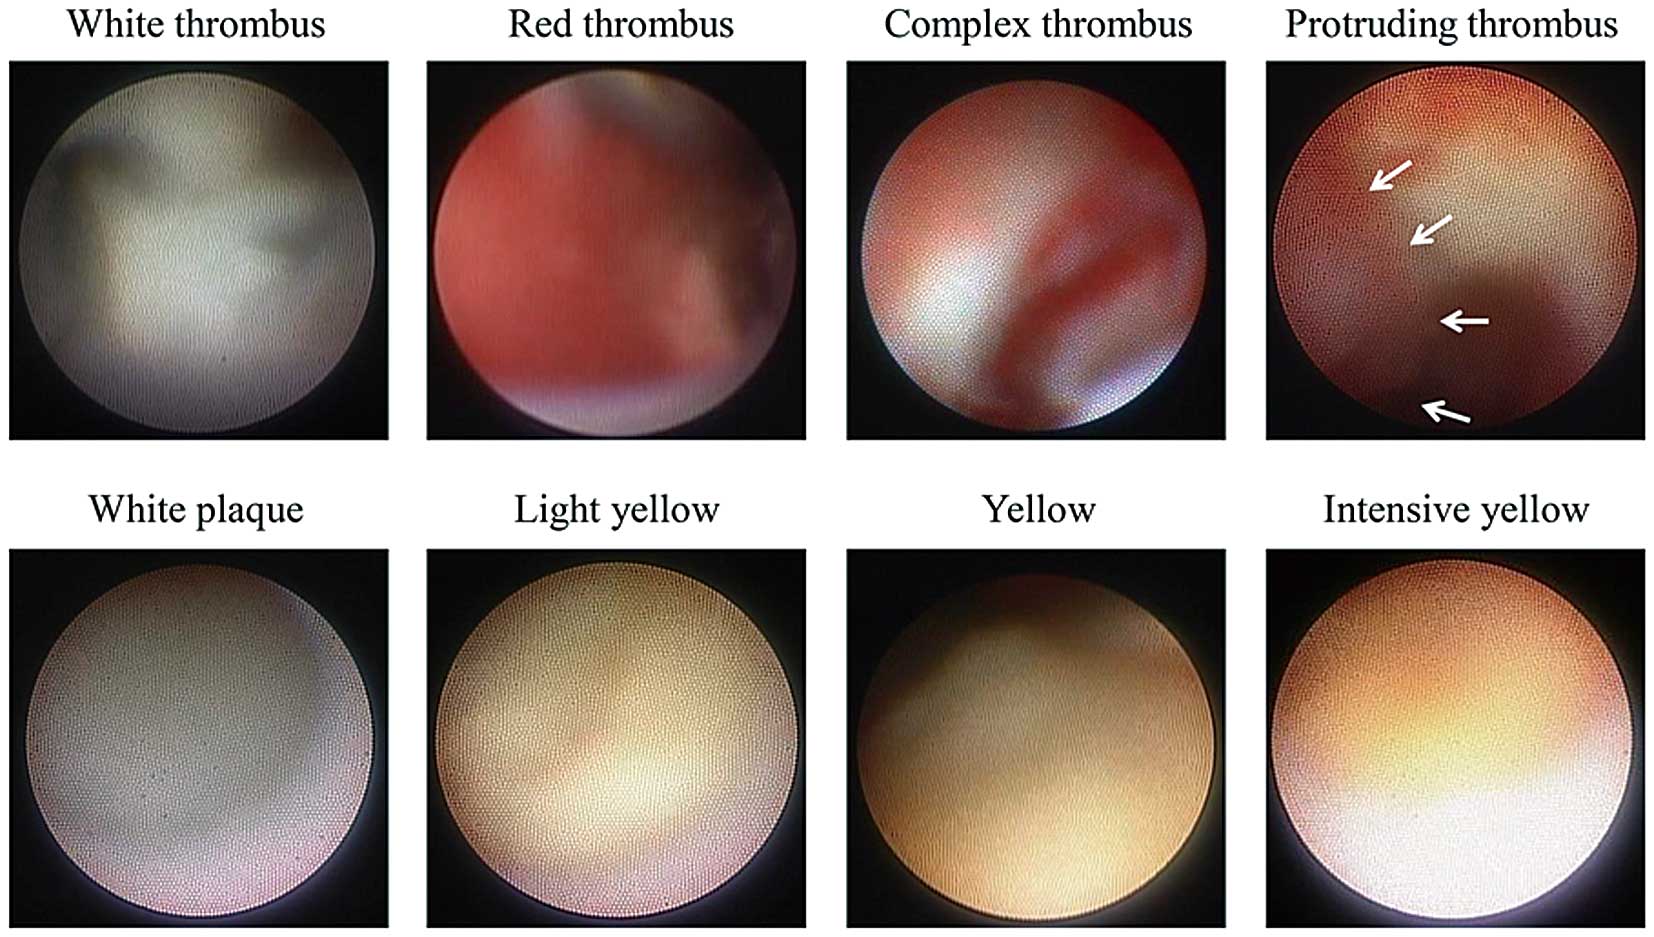
CAS images in each CTO subsegment were evaluated. The corresponding CAS and IVUS images were identified by landmarks such as side branches. Thrombus was defined as a white, red, or complex intraluminal, superficial (mural) or protruding mass that remained despite the removal of blood with a flush.10,24
The maximum yellow color of plaques in the CTO sub-segments was classified as 0=white, 1=light-yellow, 2=yellow, and 3=intense yellow.23
Bright-yellow plaque was identified as yellow color grade of 2 or 3 (Figure 2). Two experienced observers, blinded to the patient and angiography and IVUS information, analyzed the CAS images offline.
Statistical Analysis
IBM SPSS Statistics 21.0 software (IBM, Armonk, NY, USA) was used for all statistical analyses. Categorical data were expressed as absolute frequencies and percentages, and compared using χ2
or Fisher’s exact test, as appropriate. Continuous variables were expressed as mean±standard deviations for normally distributed variables or as median (25–75th percentile) for non-normally distributed variables, and were compared using Student’s t-test, Mann-Whitney U-test, or one-way analysis of variance, as appropriate. If a significant difference was found, a post-hoc test for multiple comparisons among the 3 sub-segments of the CTO lesion was performed using Tukey’s test or Scheffe’s test for continuous variables, and the Bonferroni correction for categorical variables. Intra- and interobserver agreement for qualitative plaque morphologies determined by IVUS and CAS were assessed using κ statistics. Multivariate logistic regression analysis (stepwise-forward method) was used to evaluate the relationships among the clinical, biochemical, angiographic, IVUS and CAS parameters, and PMN. To control for multiple comparisons, pairwise tests were performed with each variable. Variables with P<0.10 in the univariate analysis were included in the multivariate model. Natural logarithmic transformation was used for regression analyses of non-normally distributed variables. A P value <0.05 was considered statistically significant except in the post-hoc analysis with Bonferroni correction, where <0.017 (0.05÷3) was required for significance.
Results
Baseline Characteristics
In the present study, there were 35 T-CTO lesions among the total CTO lesions (61.4%). Patients with T-CTO lesions had higher values of low-density lipoprotein-cholesterol and HbA1c, and a lower frequency of side branch involvement than those with A-CTO lesions (Table 1). The J-CTO score was lower and total contrast medium volume was smaller for T-CTO lesions than for A-CTO lesions.
Table 1.
Baseline Characteristics, Lesion Characteristics, and Procedural Results
| |
Total
(n=57) |
T-CTO
(n=35) |
A-CTO
(n=22) |
P value |
| Age (years) |
68±11 |
69±10 |
66±12 |
0.38 |
| Male sex |
42 (73.7) |
25 (71.4) |
17 (77.3) |
0.76 |
| CCS class 2–4 |
37 (64.9) |
24 (68.6) |
13 (59.1) |
0.57 |
| CTO age >3 years or unknown |
11 (19.3) |
7 (20.0) |
4 (18.2) |
1.00 |
| Current smoker |
31 (54.4) |
18 (51.4) |
13 (59.1) |
0.60 |
| Diabetes mellitus |
25 (43.9) |
19 (54.3) |
6 (27.3) |
0.06 |
| Hypertension |
36 (63.2) |
19 (54.3) |
17 (77.3) |
0.10 |
| Dyslipidemia |
34 (59.6) |
23 (65.7) |
11 (50.0) |
0.28 |
| Previous MI |
10 (17.5) |
6 (17.1) |
4 (18.2) |
1.00 |
| Previous CABG |
2 (3.5) |
1 (2.9) |
1 (4.5) |
1.00 |
| Chronic kidney disease |
31 (54.4) |
22 (62.9) |
9 (40.9) |
0.17 |
| Medications |
| Statin |
48 (84.2) |
29 (82.9) |
19 (86.4) |
1.00 |
| β-blocker |
32 (56.1) |
20 (57.1) |
12 (54.5) |
1.00 |
| Calcium-channel blocker |
24 (42.1) |
12 (34.3) |
12 (54.5) |
0.17 |
| ACEI or ARB |
40 (70.2) |
28 (80.0) |
12 (54.5) |
0.07 |
| Laboratory data before PCI |
| HDL-C (mg/dL) |
44 (40–56) |
44 (38–58) |
43 (40–50) |
0.83 |
| LDL-C (mg/dL) |
93 (74–108) |
100 (82–109) |
81 (63–100) |
0.005 |
| Triglyceride (mg/dL) |
123 (97–163) |
113 (92–156) |
127 (100–169) |
0.38 |
| Hemoglobin A1c (NGSP) (%) |
6.6±1.2 |
6.9±1.3 |
6.2±1.0 |
0.046 |
| eGFR (mL/min/1.73 m2) |
58.3±22.6 |
58.1±19.7 |
58.5±27.2 |
0.94 |
| hs-cTnT (ng/L) |
13 (7–30) |
15 (9–31) |
10 (7–24) |
0.33 |
| WBC count (109 cells/L) |
6.1 (5.3–6.7) |
6.1 (5.3–6.6) |
6.2 (5.3–7.2) |
0.45 |
| hs-CRP (mg/L) |
1.1 (0.6–3.4) |
0.9 (0.5–3.1) |
1.3 (0.4–5.0) |
0.88 |
| Peak post-PCI hs-cTnT (ng/L) |
80 (40–186) |
91 (47–176) |
55 (30–282) |
0.27 |
| Angiographic data |
| LAD/RCA/LCX |
22/27/8
(38.6/47.4/14.0) |
9/20/6
(25.7/57.1/17.2) |
13/7/2
(59.1/31.8/9.1) |
0.78 |
| Ostial location |
6 (10.5) |
4 (11.4) |
2 (9.1) |
1.00 |
| Side branch involvement |
28 (49.1) |
12 (34.3) |
16 (72.7) |
0.007 |
| Calcification |
18 (31.6) |
10 (28.6) |
8 (36.4) |
0.57 |
| Bridge collateral |
7 (12.3) |
5 (14.3) |
2 (9.1) |
0.70 |
| Bending |
8 (14.0) |
6 (17.1) |
2 (9.1) |
0.47 |
| CTO length (mm) |
26.7±10.4 |
27.4±11.1 |
25.6±9.2 |
0.53 |
| CTO RD (mm) |
2.7±0.4 |
2.8±0.4 |
2.7±0.3 |
0.31 |
| Collateral grade ≥2 |
50 (87.7) |
29 (82.9) |
21 (95.5) |
0.23 |
| J-CTO score |
1.7±0.9 |
1.4±0.9 |
2.2±0.7 |
0.002 |
| Procedural data |
| Stent diameter (mm) |
3.3±0.3 |
3.3±0.4 |
3.3±0.3 |
0.55 |
| Stent length (mm) |
32.0±10.9 |
32.9±9.3 |
30.7±13.2 |
0.46 |
| Max balloon size (mm) |
3.5±0.3 |
3.5±0.3 |
3.5±0.3 |
0.73 |
| Final dilatation pressure (atm) |
18±3 |
18±3 |
19±3 |
0.65 |
| High-pressure balloon use |
54 (94.7) |
32 (91.4) |
22 (100.0) |
0.28 |
| No. of stents used ≥2 |
37 (64.9) |
20 (57.1) |
17 (77.3) |
0.16 |
| Final MBG 0–2 |
18 (31.6) |
14 (40.0) |
4 (18.2) |
0.14 |
| Post-PCI MLD (mm) |
2.9±0.4 |
2.9±0.4 |
2.9±0.5 |
0.68 |
| Fluoroscopy time (min) |
47.2 (38–63.0) |
47.2 (37.3–60.0) |
50.8 (41.5–65.5) |
0.37 |
| Total contrast medium (mL) |
328 (244–390) |
310 (208–248) |
370 (265–460) |
0.03 |
Data are presented as n (%), mean±standard deviation, or median (25–75th percentiles). ACEI, angiotensin-converting enzyme inhibitor; A-CTO, abrupt-type chronic total occlusion; ARB, angiotensin-II receptor blocker; CABG, coronary artery bypass grafting; CCS, Canadian Cardiovascular Society; eGFR, estimated glomerular filtration rate; HDL-C, high-density lipoprotein-cholesterol; hs-CRP, high-sensitivity C-reactive protein; hs-cTnT, high-sensitivity cardiac troponin-T; LAD, left anterior descending artery; LCX, left circumflex artery; LDL-C, low-density lipoprotein-cholesterol; MBG, myocardial blush grade; MI, myocardial infarction; MLD, minimal lumen diameter; NGSP, National Glycohemoglobin Standardization Program; PCI, percutaneous coronary intervention; RCA, right coronary artery; RD, reference diameter; T-CTO, tapered-type CTO; WBC, white blood cell.
The differences in the intracoronary images of the 3 sub-segments within the CTO for both T-CTO and A-CTO lesions are shown in
Table 2. On IVUS images, the proximal and distal reference EEM-CSA values were not significantly different between the lesion types (T-CTO vs. A-CTO; proximal: 15.5±3.8 mm2
vs. 14.1±4.8 mm2, P=0.27; distal: 9.7±4.0 mm2
vs. 9.6±4.4 mm2, P=0.96). In both types of CTO lesion, EEM-CSA was greater in the proximal than in the distal subsegment, and plaque burden was greater in the middle subsegment. T-CTO lesions showed positive remodeling in the proximal and middle sub-segments, whereas A-CTO lesions showed negative remodeling in each subsegment. In T-CTO lesions, CAS-derived white and red thrombi occurred more frequently in the proximal or middle subsegment, and protruding thrombi were more frequently observed in the proximal than in the distal subsegment. Bright-yellow plaque was more common in the middle subsegment (proximal: 48.6%; middle: 74.3%; distal: 2.9%, P<0.001). In contrast, the CAS findings did not differ among the 3 sub-segments in A-CTO lesions.
Table 2.
IVUS and CAS Findings in Each Subsegment of CTO Lesions
| |
T-CTO (n=35) |
A-CTO (n=22) |
| Proximal |
Middle |
Distal |
P value |
Proximal |
Middle |
Distal |
P value |
| IVUS |
| EEM-CSA (mm2) |
14.1±7.8 |
13.9±4.6 |
10.5±4.4 |
0.002 |
15.0±3.2 |
13.3±4.0 |
11.2±4.0 |
0.007 |
| Plaque area (mm2) |
11.1±4.6 |
11.8±4.5 |
7.4±3.7 |
<0.001 |
11.2±2.9 |
10.9±3.8 |
8.1±3.8 |
0.009 |
| Plaque burden (%) |
77.2±12.2 |
83.4±5.0 |
68.6±16.8 |
<0.001 |
75.5±12.8 |
80.9±5.9 |
70.3±15.2 |
0.03 |
| Remodeling index |
1.02±0.18 |
1.02±0.25 |
0.77±0.28 |
<0.001 |
0.99±0.14 |
0.90±0.18 |
0.74±0.22 |
<0.001 |
Calcification arc
(degrees) |
70.3
(53.6–159.0) |
77.6
(41.8–177.5) |
73.4
(44.3–113.3) |
0.64 |
81.9
(51.1–177.7) |
83.9
(60.7–249.1) |
50.1
(32.9–169.6) |
0.67 |
| CAS |
| White thrombus |
18 (51.4) |
22 (62.9) |
8 (22.9) |
0.003 |
15 (68.2) |
13 (59.1) |
9 (40.9) |
0.20 |
| Red thrombus |
25 (71.4) |
26 (74.3) |
11 (31.4) |
<0.001 |
13 (59.1) |
17 (77.3) |
9 (40.9) |
0.06 |
| Protruding thrombus |
8 (22.9) |
3 (8.6) |
1 (2.9) |
0.04 |
2 (9.1) |
2 (9.1) |
1 (4.5) |
0.81 |
| Light-yellow (grade 1) |
17 (48.6) |
9 (25.7) |
16 (45.7) |
0.11 |
10 (45.5) |
11 (50.0) |
6 (27.2) |
0.29 |
| Yellow (grade 2) |
8 (22.9) |
14 (40.0) |
1 (2.9) |
<0.001 |
1 (4.5) |
3 (13.6) |
1 (4.5) |
0.61 |
| Intense-yellow (grade 3) |
9 (25.7) |
12 (34.3) |
0 (0.0) |
<0.001 |
0 (0.0) |
0 (0.0) |
0 (0.0) |
1.00 |
Data are presented as n (%), mean±standard deviation, or median (25–75th percentile). CAS, coronary angioscopy; CTO, chronic total occlusion; EEM-CSA, external elastic membrane cross-sectional area; IVUS, intravascular ultrasound.
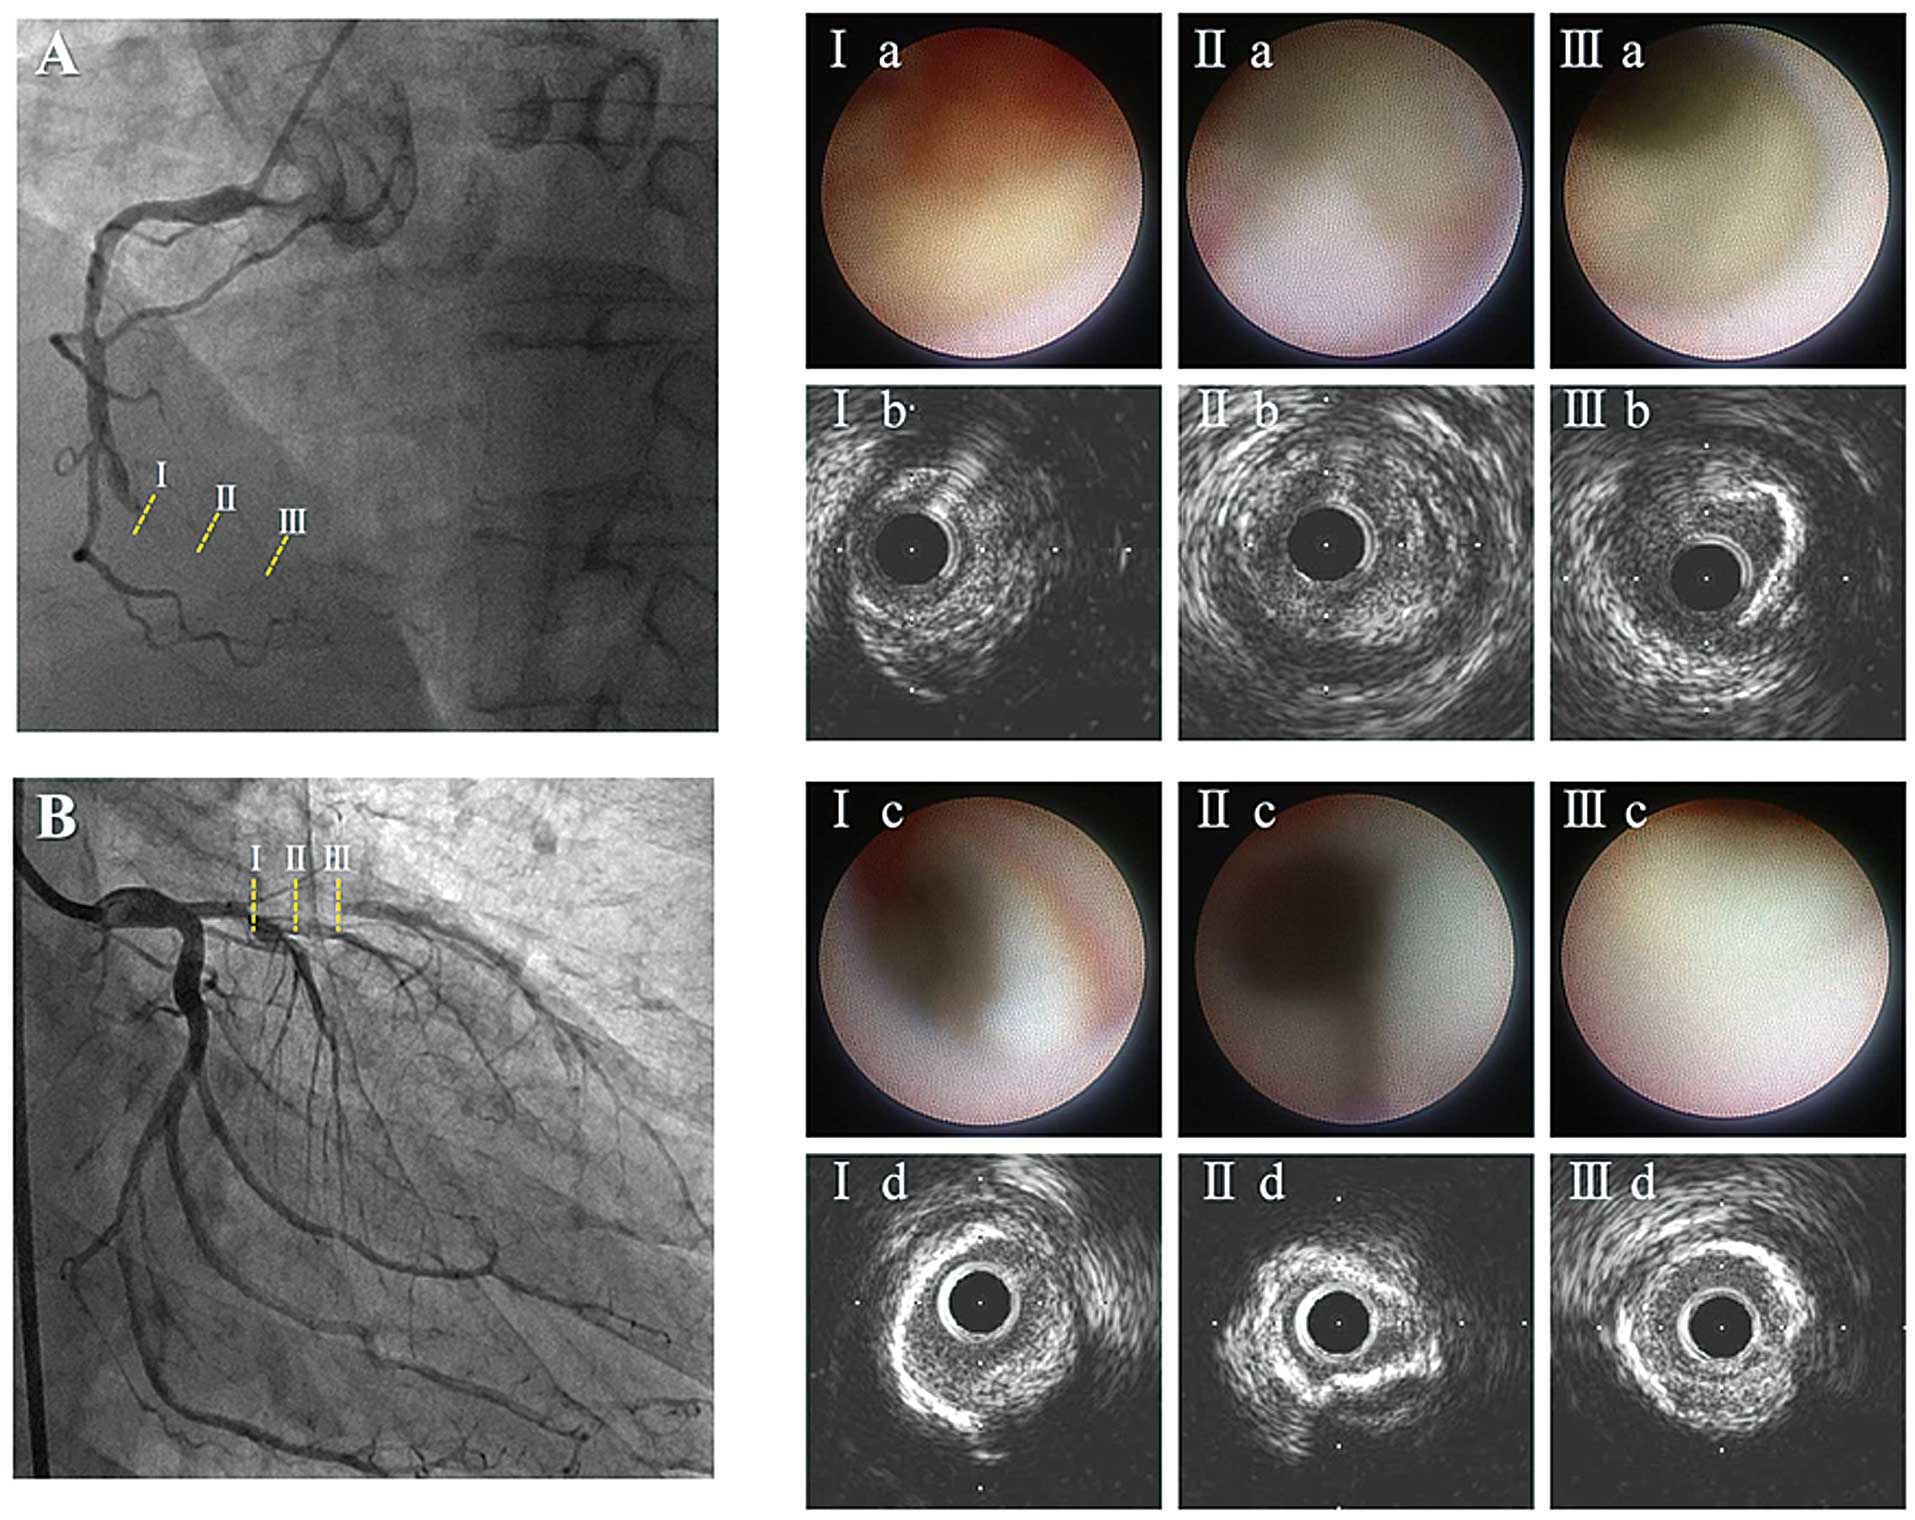
Compared with A-CTO lesions, T-CTO lesions showed a higher frequency of bright-yellow plaque in the proximal or middle subsegment. In the middle subsegment, positive remodeling was more frequently observed in T-CTO than in A-CTO lesions. In the proximal subsegment, the frequency of protruding thrombus tended to be higher in T-CTO lesions and that of severe calcification tended to be higher in A-CTO lesions (Figures 3,4).
Factors Related to PMN
PMN occurred in 24 (42.1%) lesions. Bright-yellow plaque within the CTO lesion was more frequently observed in those lesions with PMN (79.2% vs. 45.5%, P=0.01) (Table S1). Multivariate analysis indicated that bright-yellow plaque was an independent predictor for PMN (Table 3) and the combination of T-CTO lesion and bright-yellow plaque had higher predictive value for PMN than either factor alone (Figure 5).
Table 3.
Univariate and Multivariate Analyses of Factors Predicting Periprocedural Myocardial Necrosis
| |
OR |
95% CI |
P value |
| Univariate logistic regression analysis |
| Age (years) |
0.97 |
0.92–1.02 |
0.20 |
| Statin use |
0.20 |
0.04–1.10 |
0.06 |
| ACEI or ARB use |
2.17 |
0.60–7.31 |
0.21 |
| Nicorandil use |
0.50 |
0.17–1.46 |
0.21 |
| Sulfonilurea use |
3.10 |
0.52–18.53 |
0.22 |
| Hemoglobin A1c (NGSP) (%) |
0.78 |
0.50–1.23 |
0.29 |
| T-CTO lesion |
2.82 |
0.90–8.91 |
0.08 |
| CTO length >20 mm |
0.53 |
0.17–1.68 |
0.28 |
| Plaque burden in middle section (%) |
1.09 |
0.94–1.24 |
0.24 |
| Positive remodeling |
2.02 |
0.66–6.17 |
0.22 |
| CAS-bright-yellow plaque |
4.56 |
1.37–5.14 |
0.01 |
| Multivariate logistic regression analysis |
| CAS-bright-yellow plaque |
7.25 |
1.25–42.04 |
0.03 |
CI, confidence interval; OR, odds ratio. Other abbreviations as in Tables 1,2.
Intra- and interobserver agreement values were good regarding the identification of CAS findings (complex thrombus [intraobserver variability, κ=0.93 and interobserver variability, κ=0.85], protruding thrombus [0.86 and 0.77], and bright-yellow plaque [0.96 and 0.93]).
Discussion
The present study demonstrated that T-CTO lesions had higher frequencies of thrombi and yellow plaque in the proximal or middle subsegment than in the distal subsegment, whereas A-CTO lesions showed no significant differences among the 3 sub-segments. In the middle subsegment of T-CTO lesions there were higher frequencies of positive remodeling and bright-yellow plaque compared with A-CTO lesions. Bright-yellow plaque was identified as an independent predictor of PMN.
Mechanism of T-CTO Formation
The differences in the plaque components and their development mechanisms according to the angiographic proximal lumen pattern in CTO lesions remain unclear in vivo. A previous histopathological study involving autopsies reported that proximal T-CTO lesions had small lumen recanalization areas and surrounding loose fibrous tissue, shorter occluded segments, and a higher frequency of vessel stump.25
Thrombus formation after atheromatous plaque rupture might extend distally and proximally to the rupture site, leading to the specific features of T-CTO lesions. These histopathologic assessments seem to agree with our results. Moreover, a previous in vivo study with VH-IVUS reported that CTO lesions had 2 morphologic types (i.e., lesions with and without VH-fibroatheroma), suggesting 2 different mechanisms of CTO formation: lesions evolving from acute coronary syndrome (ACS) or from atherosclerosis progression.14
These observations, in accordance with histopathologic studies,25
suggest that many CTO lesions may evolve from ACS and might be caused by plaque rupture and thrombotic occlusion. A ruptured plaque may be difficult to identify in a CTO lesion in vivo, but the related features of unstable plaque such as positive remodeling, intensive yellow color, and protruding thrombus were more frequently observed in the proximal or middle subsegment of T-CTO lesions in our study. In particular, positive remodeling or bright-yellow plaque was more frequently detected in the middle subsegment of T-CTO lesions, which might be caused by plaque rupture in the center of T-CTO lesions.
Mechanism of A-CTO Formation
In many A-CTO lesions, the main lumen is occluded just distal to the branching point of a side branch. In A-CTO lesions, recanalization after thrombus occlusion is less frequent; thus, thrombus formation may extend proximally and reach the branching point of the large side branch, so a vessel stump is not formed.25
In A-CTO lesions, lesion edges that come in contact with blood flow are more likely to organize in a shorter period. Thrombus may change into organized thrombus, with collagen-rich fibrous tissue at the proximal site.26
In our study, A-CTO lesions had a greater prevalence of side branch involvement and highly calcified plaques in the proximal subsegment and negative remodeling and not as bright yellow plaque in the middle subsegment than T-CTO lesions, although the number of thrombi was similar between the groups. Accumulation of organized thrombus at the proximal site and transformation into fibrocalcific lesions combined with narrowing of the vessel area in the middle subsegment might explain A-CTO lesions.27
A previous study with VH-IVUS suggested that atherosclerosis with greater stenosis from underlying pathologic intimal thickening might cause plaque erosion and lead to thrombotic total occlusion14
that is not related to fibroatheroma. This may be an alternative mechanism of A-CTO formation.
With advancing age of the CTO, plaque composition may change from predominantly lipid-rich to fibrocalcific.14,27,28
Although the precise age of a CTO might not always be available, we determined CTO age according to a previously reported method. Most of the CTO lesions in the present study were less than 3 years old, and did not different significantly between T- and A-CTO lesions, which was consistent with a previous histopathologic study.4
These findings suggested that CTO age may not influence the difference in lesion morphology and plaque components of T- and A-CTO lesions.
Effect of CTO Plaque Components on PMN Occurrence
Recent studies have reported the effect of PMN on long-term outcomes after recanalization of CTO lesions.29–31
Several factors have been demonstrated as predictors of PMN in CTO lesions,30,31
but the effect of the plaque components on PMN has not been clarified. CAS assessment of plaque morphology may be useful in the prediction of PMN.32
In the present study, T-CTO lesions with bright-yellow plaque were independently related to the occurrence of PMN. Lipid-rich plaque or necrotic core is more frequently observed in younger CTO lesions.4,28
In the present study, CTO lesions with PMN tended to be younger than those without PMN, suggesting that immature and unstable atheromatous plaque might be related to the occurrence of PMN in CTO lesions. PMN might be caused by distal embolization from disrupted bright-yellow plaque after PCI. When bright-yellow plaque is observed on CAS before PCI, especially in T-CTO lesions, aggressive drug therapy, thrombectomy or distal protection device use should be considered to stabilize the plaque components and prevent or reduce distal embolization and PMN.
Combination of Intracoronary Imaging
IVUS can give qualitative and quantitative images and has a high accuracy of plaque morphology identification in CTO lesions. On the other hand, CAS, which allows direct visualization, can identify the characteristics of vulnerable plaque. CAS is the gold standard for detecting yellow plaque and is more sensitive for thrombus detection that other imaging modalities such as optical coherence tomography.33
Our observations suggested that combined use of imaging modalities might lead to better understanding of the pathogenetic mechanism of CTO lesions. Although the incorporation of CAS as a useful tool for post-PCI outcome prediction remains challenging, the present study demonstrated the good predictive value of CAS-identified bright-yellow plaque for PMN occurrence.
Study Limitations
First, this was a small, single-center, retrospective study, and selection bias might have occurred because we excluded unsuccessful procedures, cases of inability to cross the lesion with the imaging catheter, and inadequate IVUS or CAS image quality. These exclusions might contribute to a lower J-CTO score compared with previous studies. Second, we excluded lesions using a retrograde approach, which can often cause modification of the plaque intima within the CTO segment. Additionally, the retrograde approach has been identified as an independent risk factor for the occurrence of periprocedural myocardial damage in CTO lesions.31
Therefore, we selected only lesions treated with the antegrade approach in order to accurately assess plaque characteristics within the CTO lesions. Third, IVUS or CAS was occasionally performed after predilatation with balloon angioplasty. However, we used a small-sized balloon to minimize its effect on plaque characterization. Fourth, both IVUS and CAS were useful for assessing plaque characteristics in CTO lesions, but only the CAS finding remained as an independent predictor for PMN. Plaque volume is generally an important predictor for the occurrence of PMN in non-CTO lesions. Our results suggested less influence of plaque volume compared with plaque vulnerability on the occurrence of PMN in CTO lesions. Finally, PMN in our study was defined as previously reported.13
The clinical relevance of post-PCI mild myocardial damage and the optimal threshold of hs-cTnT for PMN in CTO lesions remain unclear. However, previous studies have demonstrated a significant link between PMN and poor outcomes during follow-up.13
Conclusions
The present study demonstrated that T-CTO lesions had a greater frequency of bright-yellow plaque with positive remodeling compared with A-CTO lesions. T-CTO lesion with bright-yellow plaque was identified as an independent predictor of PMN. Combined IVUS and CAS examination of lesion morphology and plaque components may help clarify the pathogenetic mechanism of CTO lesions. Furthermore, CAS assessment of plaque characteristics may be useful in risk stratification of SAP patients undergoing elective PCI for CTO lesions.
Disclosures
The authors report no conflicts of interest with respect to this manuscript.
Supplementary Files
Supplementary File 1
Table S1.
Factors related to occurrence of PMN
Please find supplementary file(s);
http://dx.doi.org/10.1253/circj.CJ-18-0186
References
- 1.
Fefer P, Knudtson ML, Cheema AN, Galbraith PD, Osherov AB, Yalonetsky S, et al. Current perspectives on coronary chronic total occlusions: The Canadian Multicenter Chronic Total Occlusions Registry. J Am Coll Cardiol 2012; 59: 991–997.
- 2.
Mehran R, Claessen BE, Godino C, Dangas GD, Obunai K, Kanwal S, et al. Long-term outcome of percutaneous coronary intervention for chronic total occlusions. J Am Coll Cardiol Intv 2011; 4: 952–961.
- 3.
Jones DA, Weerackody R, Rathod K, Behar J, Gallagher S, Knight CJ, et al. Successful recanalization of chronic total occlusions is associated with improved long-term survival. J Am Coll Cardiol Intv 2012; 5: 380–388.
- 4.
Sakakura K, Nakano M, Otsuka F, Yahagi K, Kutys R, Ladich E, et al. Comparison of pathology of chronic total occlusion with and without coronary artery bypass graft. Eur Heart J 2014; 35: 1683–1693.
- 5.
Hong SJ, Kim BK, Shin DH, Kim JS, Hong MK, Gwon HC, et al. K-CTO Registry. Usefulness of intravascular ultrasound guidance in percutaneous coronary intervention with second-generation drug-eluting stents for chronic total occlusions (from the Multicenter Korean-Chronic Total Occlusion Registry). Am J Cardiol 2014; 114: 534–540.
- 6.
Kim BK, Shin DH, Hong MK, Park HS, Rha SW, Mintz GS, et al; CTO-IVUS Study Investigators. Clinical impact of intravascular ultrasound-guided chronic total occlusion intervention with zotarolimus-eluting versus biolimus-eluting stent implantation: Randomized study. Circ Cardiovasc Interv 2015; 8: e002592.
- 7.
Thim T, Hagensen MK, Wallace-Bradley D, Granada JF, Kaluza GL, Drouet L, et al. Unreliable assessment of necrotic core by virtual histology intravascular ultrasound in porcine coronary artery disease. Circ Cardiovasc Imaging 2010; 3: 384–391.
- 8.
Kotani J, Awata M, Nanto S, Uematsu M, Oshima F, Minamiguchi H, et al. Incomplete neointimal coverage of sirolimus-eluting stents: Angioscopic findings. J Am Coll Cardiol 2006; 47: 2108–2111.
- 9.
Thieme T, Wernecke KD, Meyer R, Brandenstein E, Habedank D, Hinz A, et al. Angioscopic evaluation of atherosclerotic plaques: Validation by histomorphologic analysis and association with stable and unstable coronary syndromes. J Am Coll Cardiol 1996; 28: 1–6.
- 10.
Alfonso F, Goicolea J, Hernandez R, Goncalves M, Segovia J, Bañuelos C, et al. Angioscopic findings during coronary angioplasty of coronary occlusions. J Am Coll Cardiol 1995; 26: 135–141.
- 11.
Abdelmeguid AE, Topol EJ, Whitlow PL, Sapp SK, Ellis SG. Significance of mild transient release of creatine kinase-MB fraction after percutaneous coronary interventions. Circulation 1996; 94: 1528–1536.
- 12.
Thygesen K, Alpert JS, Jaffe AS, Simoons ML, Chaitman BR, White HD, et al. Joint ESC/ACCF/AHA/WHF Task Force for the Universal Definition of Myocardial Infarction: Third universal definition of myocardial infarction. Circulation 2012; 126: 2020–2035.
- 13.
Kimura S, Sugiyama T, Hishikari K, Yamakami Y, Sagawa Y, Kojima K, et al. Association of intravascular ultrasound- and optical coherence tomography-assessed coronary plaque morphology with periprocedural myocardial injury in patients with stable angina pectoris. Circ J 2015; 79: 1944–1953.
- 14.
Guo J, Maehara A, Mintz GS, Ashida K, Pu J, Shang Y, et al. A virtual histology intravascular ultrasound analysis of coronary chronic total occlusions. Catheter Cardiovasc Interv 2013; 81: 464–470.
- 15.
Stone GW, Kandzari DE, Mehran R, Colombo A, Schwartz RS, Bailey S, et al. Percutaneous recanalization of chronically occluded coronary arteries: A consensus document: Part I. Circulation 2005; 112: 2364–2372.
- 16.
Hoye A, Tanabe K, Lemos PA, Aoki J, Saia F, Arampatzis C, et al. Significant reduction in restenosis after the use of sirolimus-eluting stents in the treatment of chronic total occlusions. J Am Coll Cardiol 2004; 43: 1954–1958.
- 17.
The TIMI Study Group. The Thrombolysis in Myocardial Infarction (TIMI) trial. N Engl J Med 1985; 312: 932–936.
- 18.
van’t Hof AW, Liem A, Suryapranata H, Hoorntje JC, de Boer MJ, Zijlstra F. Angiographic assessment of myocardial reperfusion in patients treated with primary angioplasty for acute myocardial infarction: Myocardial blush grade. Zwolle Myocardial Infarction Study Group. Circulation 1998; 97: 2302–2306.
- 19.
Rentrop KP, Cohen M, Blanke H, Phillips RA. Changes in collateral channel filling immediately after controlled coronary artery occlusion by an angioplasty balloon in human subjects. J Am Coll Cardiol 1985; 5: 587–592.
- 20.
Morino Y, Abe M, Morimoto T, Kimura T, Hayashi Y, Muramatsu T, et al; J-CTO Registry Investigators. Predicting successful guidewire crossing through chronic total occlusion of native coronary lesions within 30 minutes: The J-CTO (Multicenter CTO Registry in Japan) score as a difficulty grading and time assessment tool. J Am Coll Cardiol Intv 2011; 4: 213–221.
- 21.
Mintz GS, Nissen SE, Anderson WD, Bailey SR, Erbel R, Fitzgerald PJ, et al. American College of Cardiology Clinical Expert Consensus Document on Standards for Acquisition, Measurement and Reporting of Intravascular Ultrasound Studies (IVUS): A report of the American College of Cardiology Task Force on Clinical Expert Consensus Documents. J Am Coll Cardiol 2001; 37: 1478–1492.
- 22.
Taylor AJ, Burke AP, Farb A, Yousefi P, Malcom GT, Smialek J, et al. Arterial remodeling in the left coronary system: The role of high-density lipoprotein cholesterol. J Am Coll Cardiol 1999; 34: 760–767.
- 23.
UedaY, Ohtani T, Shimizu M, Hirayama A, Kodama K. Assessment of plaque vulnerability by angioscopic classification of plaque color. Am Heart J 2004; 148: 333–335.
- 24.
Murakami D, Takano M, Yamamoto M, Inami T, Inami S, Okamatsu K, et al. Intense yellow culprit plaque coloration is closely associated with troponin-T elevation and flow complications following elective coronary stenting. J Atheroscler Thromb 2011; 18: 906–913.
- 25.
Katsuragawa M, Fujiwara H, Miyamae M, Sasayama S. Histologic studies in percutaneous transluminal coronary angioplasty for chronic total occlusion: Comparison of tapering and abrupt types of occlusion and short and long occluded segments. J Am Coll Cardiol 1993; 21: 604–611.
- 26.
Godino C, Carlino M, Al-Lamee R, Colombo A. Coronary chronic total occlusion. Minerva Cardioangiol 2010; 58: 41–60.
- 27.
Sumitsuji S, Inoue K, Ochiai M, Tsuchikane E, Ikeno F. Fundamental wire technique and current standard strategy of percutaneous intervention for chronic total occlusion with histopathological insights. J Am Coll Cardiol Intv 2011; 4: 941–951.
- 28.
Srivatsa SS, Edwards WD, Boos CM, Grill DE, Sangiorgi GM, Garratt KN, et al. Histologic correlates of angiographic chronic total coronary artery occlusions: Influence of occlusion duration on neovascular channel patterns and intimal plaque composition. J Am Coll Cardiol 1997; 29: 955–963.
- 29.
Lo N, Michael TT, Moin D, Patel VG, Alomar M, Papayannis A, et al. Periprocedural myocardial injury in chronic total occlusion percutaneous interventions: A systematic cardiac biomarker evaluation study. JACC Cardiovasc Interv 2014; 7: 47–54.
- 30.
Lee SW, Lee PH, Kang SH, Choi H, Chang M, Roh JH, et al. Determinants and prognostic significance of periprocedural myocardial injury in patients with successful percutaneous chronic total occlusion interventions. J Am Coll Cardiol Intv 2016; 9: 2220–2228.
- 31.
Zhang Q, Hu J, Yang ZK, Ding FH, Zhang JS, Du R, et al. Correlates and outcomes related to periprocedural myocardial injury during percutaneous coronary intervention for chronic total occlusion: Results from a prospective, single center PCI registry. Catheter Cardiovasc Interv 2016; 87(Suppl 1): 616–623.
- 32.
Kimura S, Sugiyama T, Hishikari K, Nakamura S, Nakagama S, Misawa T, et al. Impact of optical coherence tomography- and coronary angioscopy-assessed neointimal tissue characteristics on occurrence of periprocedural myonecrosis in patients with in-stent restenosis. Int J Cardiovasc Imaging 2016; 32: 1483–1494.
- 33.
Dai K, Matsuoka H, Kawakami H, Sato T, Watanabe K, Nakama Y, et al. Comparison of chronic angioscopic findings of bare metal stents, 1st-generation drug-eluting stents and 2nd-generation drug-eluting stents: Multicenter Study of Intra-Coronary Angioscopy After Stent (MICASA). Circ J 2016; 80: 1916–1921.