Ischemic Heart Disease
Transplantation of Endothelial Progenitor Cells Overexpressing miR-126-3p Improves Heart Function in Ischemic Cardiomyopathy
2018 Volume 82 Issue 9 Pages 2332-2341


Details
2018 Volume 82 Issue 9 Pages 2332-2341
Background: In a previous study, a low level of miR-126-3p in endothelial progenitor cells (EPCs) was linked to the outcome of ischemic cardiomyopathy (ICM) patients. However, it remains unclear whether transplantation with miR-126-3p-overexpressing EPCs (MO-EPCs) can improve the cardiac function of ICM animal models.
Methods and Results: miR-126-3p overexpression by lentiviral vector significantly increased migration and tube-like structures of EPCs from ICM patients. MO-EPCs or non-modified EPCs (NM-EPCs) were transplanted into nude rats with ICM induced by coronary artery ligation. MO-EPC transplantation increased capillary density and EPC survival rate in myocardial tissues of nude rats. Cytokines were also assessed by antibody array and real-time RT-PCR. G-CSF, VEGF-A, IL-3, IL-10, IGF-1, angiogenin, HGF, TIMP-1 and TIMP-2 were upregulated, and IL-8, MCP-1, MCP-2, TNF-α, TNF-β and MIP-1β were downregulated after miR-126-3p overexpression in EPCs. The same results were obtained in infarction tissues of nude rats after MO-EPC transplantation. Eight weeks after MO-EPC transplantation, left ventricular function improved significantly with clearly decreased infarction size, increased anterior wall thickness, and inhibition of inflammation compared with the results for NM-EPC transplantation. However, MO-EPC transplantation showed no increase in survival time of nude rats with ICM during 8 weeks of observation.
Conclusions: miR-126-3p can restore the biology of EPCs from ICM patients. Moreover, MO-EPC transplantation improves cardiac function effectively, representing a promising future treatment for ICM.
Chronic heart failure (CHF) induced by ischemic cardiomyopathy (ICM) is one of the most common causes of death worldwide.1,2 In ICM patients, insufficient blood supply (particularly in microcirculation) correlates with decreased myocardial function.3 Common treatment strategies including coronary artery stent fail to restore the dysfunction of coronary microcirculation. Because of its potential to promote angiogenesis and myocardial regeneration, stem cell transplantation may be the optimal therapeutic method for treating ICM.4
Editorial p 2248
There is growing evidence that endothelial progenitor cells (EPCs) are involved in myocardial angiogenesis of ICM patients.5 However, in contrast to EPCs from healthy subjects, the transplantation of EPCs from CHF patients failed to increase angiogenesis. This reveals that impaired EPC angiogenesis occurs in CHF patients.6 As such, restoring EPC biology may be essential for treating ICM with EPCs.
Recent studies have suggested that microRNAs (miRNAs) regulate the proliferation, migration, and angiogenesis of EPCs.7 Therefore, miRNAs may have a role in the impaired biology of EPCs in ICM patients.8 In previous work, after a 2-year follow up, we found that the miR-126-3p level in EPCs was an independent prognostic factor for the outcome of CHF patients.9 However, the effects of miR-126-3p overexpression in EPCs on the cardiac function in ICM patients remains unknown.
miR-126-3p is known to regulate angiogenesis by adjusting proangiogenic cytokine expression, including VEGF in EPCs.10,11 Based on work conducted by Jiang, it was also reported that human endometrial stem cell transplantation can improve cardiac function by regulating cytokine secretion.12 The altered cytokine levels in peripheral blood mononuclear cells (PBMCs) were also found to correlate with the progression and severity of heart disease.13 Based on this background, we hypothesize that miR-126-3p overexpression may restore EPC biology and improve heart function in ICM patients, and that increased angiogenesis and decreased inflammation may be involved in this process. Therefore, this study aimed to investigate whether: (1) miR-126-3p overexpression restores EPC biology; and (2) transplantation of EPCs overexpressing miR-126-3p can improve heart function in model rats by enhancing angiogenesis and inhibiting inflammation.
All 119 patients with NYHA class III to IV CHF were recruited from an outpatient clinic at the Department of Cardiology or referred for cardiac catheterization for suspected CAD in The Affiliated Hangzhou Hospital of Nanjing Medical University between 2013 and 2016. Inclusion and exclusion criteria were the same, as described in our previous report.9 All human studies were approved by The Institutional Review Board at Hangzhou First People’s Hospital. Written informed consent was provided by all subjects.
In the current study, 96 patients with ICM were randomized into a control group (CON), a blank vector group (BV), or an miR-126-3p transfection group (MT), and their peripheral blood EPCs were expanded in vitro and transplanted into a nude rat ICM model (Figure 1A for research design). The clinical characteristics of the subjects are shown in Table.

(A) Flow chart of study design. Endothelial progenitor cells (EPCs) from ischemic cardiomyopathy (ICM) patients were expanded and transfected with three types of lentiviral expression vector (pLenti6.3-mCherry, pLVX-IRES-mCherry, or pLVX-IRES-mCherry-miR-126-3p) in vitro. Then, the EPCs were transplanted into an ICM model in vivo. Representing the different transfection vectors, patients and corresponding nude rats were classified into three groups: control group (CON), blank vector group (BV), and miR-126-3p transfection group (MT). (B–G) Morphology of EPCs and CD34/CD133 expression. (B) Spindle-like cells derived from human peripheral blood mononuclear cells after 14 days of culture. (C) Cells taking up acLDL (red). (D) Cells were stained with FITC Ulex-lectin (green). (E) Cells with combined acLDL and Ulex-lectin labeling (yellow). (F,G) Typical dot plots of CD34 vs. CD133 after 7 or 14 days of culture, showing that CD34+/CD133+ cell numbers increased significantly from 7 to 14 days of culture (23.7±3.8% vs. 51.2±6.3%, P=0.024). (H–M) The transfection efficiency and miR-126-3p overexpression in EPCs. (H) The background of EPCs transfected with pLVX-IRES-mCherry-miR-126-3p. (I) EPCs expressing mCherry (red). (J) Merged image of (H) and (I). (K) Quantitative analysis of transfection efficiency of pLVX-IRES-mCherry-miR-126-3p vectors. The transfection efficiency was calculated as follows: (EPCs expressing mCherry/all EPCs in background)×100%. (L,M) Quantitative analysis of miR-126-3p expression among CON, BV, and MT groups from 1 to 9 passages. Scale bar=100 μm.
| CON (N=32) |
BV (N=32) |
MT (N=32) |
P-value | |
|---|---|---|---|---|
| Age, years [mean (range)] | 68.7±8.9 (59–85) | 69.6±10.2 (56–84) | 67.8±9.7 (57–87) | 0.756 |
| Sex, M/F | 18/14 | 17/15 | 19/13 | 0.881 |
| Drinker, % | 25 | 21.88 | 31.25 | 0.685 |
| Smoking, % | 21.88 | 18.75 | 15.63 | 0.815 |
| EPCs, % | 0.017±0.008 | 0.0146±0.006 | 0.00156±0.005 | 0.278 |
| TC, mmol/L | 4.53±1.25 | 4.23±1.38 | 4.65±1.32 | 0.425 |
| LDL, mmol/L | 2.24±1.05 | 2.12±1.09 | 2.31±1.11 | 0.778 |
| LVEF, % | 33.25±8.98 | 34.56±9.35 | 33.98±8.54 | 0.843 |
| SBP, mmHg | 121.5±13.2 | 118.9±11.8 | 115.5±12.5 | 0.163 |
| DBP, mmHg | 64.92±11.85 | 63.85±12.94 | 59.82±11.72 | 0.216 |
| Therapy, % | ||||
| β-receptor antagonist | 65.63 | 68.75 | 62.5 | 0.871 |
| ACE inhibitor or ARB | 84.38 | 81.25 | 87.5 | 0.789 |
| Loop diuretic | 93.75 | 96.86 | 93.75 | 0.810 |
| Aldosterone antagonists | 53.13 | 46.88 | 43.75 | 0.747 |
| Digitoxin | 43.75 | 54.55 | 46.88 | 0.733 |
| Statins | 87.50 | 90.63 | 84.38 | 0.751 |
ACE, angiotensin-converting enzyme; ARB, angiotensin II receptor blocker; BV, blank vector group; CON, control group; DBP, diastolic blood pressure; EPCs, endothelial progenitor cells; F, female; LDL, low-density lipoprotein; LVEF, left ventricular ejection fraction; LVIDd, left ventricular internal dimension-diastole; M, male; MT, miR-126-3p transfection group; TC, total cholesterol; SBP, systolic blood pressure.
A modified version of the procedure described by Hill and Kawamoto was used to obtain EPCs.14,15 Briefly, PBMCs were isolated from the peripheral venous blood of patients by Ficoll density-gradient centrifugation (Sigma-Aldrich, St. Louis, MO, USA), washed twice with phosphate-buffered saline (PBS), and preplated onto 10-cm fibronectin-coated plates (Becton, Dickinson and Company, Sparks, MD, USA) in Medium 199 (Sigma-Aldrich) containing 20% fetal calf serum. After 24 h, non-adherent cells were collected and 2 million of them were replated onto fibronectin-coated 6-well plates in endothelial growth medium (EGM-2; Lonza Bioscience, Switzerland) containing 20% fetal bovine serum. On day 4, non-adherent cells were washed off and the medium was changed. Then, the cells were cultured while changing the medium every 3 days until 14 days. EPCs were identified by their uptake of Ac-LDL and by their recognition by CD34/CD133 antibodies by the same procedures as described in our previous paper.9
Vector Construction and EPC TransfectionThe lentiviral expression vectors, pLVX-IRES-mCherry-miR-126-3p (Clontech Laboratories, CA, USA) and pLenti6.3-mCherry (Invitrogen, Carlsbad, CA, USA), were constructed to stably overexpress the mature sequence of miR-126-3p and mCherry in EPCs. The mature miR-126-3p sequence was subcloned into EcoR1 and BamH1 sites of the pLVX-IRES-mCherry vector. The packaging of pseudotyped recombinant lentivirus was performed by the transfection of 293T cells. EPCs were transfected with pLVX-IRES-mCherry-miR-126-3p, pLVX-IRES-mCherry, or pLenti6.3-mCherry vector at an MOI of 100 in 6-well culture plates at 5×10⁴ cells per well.
Cytokine Antibody ArrayEPCs were lysed using a Bio-Plex Cell Lysis Kit (Bio-Rad, Hercules, CA, USA). Qualitative assessment of 80 cytokines in cell lysates was performed with RayBio Human Cytokine Antibody Array 5 (RayBiotech, Norcross, GA, USA). Cytokine arrays were analyzed by densitometry using Bio-Rad Quantity One software. Expression levels were displayed as a heat map.
Migration and Tube-Like Structure FormationEPC migration was measured in culture inserts containing microporous membranes (BD Biosciences). Briefly, 1×10⁴ EPCs suspended in basal medium were added to the top chamber, and VEGF was added to the lower chamber (50 ng/mL) to induce EPC migration. After incubation for 24 h, the microporous membranes were fixed in 4% paraformaldehyde for 10 min, non-migrating cells on the top side were removed, and the migratory cells were stained with 4′,6-diamidino-2-phenylindole (DAPI) (Sigma-Aldrich) and counted manually in 5 random fields (200×) in each insert.
EPC tube-like structure formation was assessed by using a tube formation assay kit (Chemicon, Temecula, CA, USA). EPCs were trypsinized and 1×10⁴ of them were reseeded onto the surface of the polymerized ECMatrixTM in a 96-well dish for 24 h. The tube formation was inspected under an inverted light microscope. Five independent fields were assessed for each well, and the average number of tube-like structures per field (200×) was determined.
Ischemic Cardiomyopathy Model of Nude RatsAn ICM model was created by left coronary artery ligation in nude rats (Crl: NIH-Foxn1rnu) weighing 200–250 g (Charles River Laboratories, Wilmington, MA, USA). Animals were anesthetized by the intraperitoneal injection of ketamine (40 mg/kg) and xylazine (4 mg/kg). The left coronary artery was ligated at a position 2–3 mm from its origin between the pulmonary conus and left atrium. Four weeks later, baseline cardiac functions were measured by echocardiography and animals with an LVEF=35±5% were selected for cell transplantation study.
After baseline imaging, a second thoracotomy was performed to inject 3×10⁶ EPCs into three sites around the infarcted tissues of animal hearts. All experimental procedures and protocols were approved by the Institutional Review Board at Hangzhou First People’s Hospital.
Capillary Density of Myocardial TissueTissues harvested from the rat hearts were snap-frozen in OCT (BD Biosciences) and 5-μm cryostat sections were prepared for laser scanning confocal microscopy. Transplanted EPCs expressing mCherry were identified in tissue sections as red fluorescence by 587-nm excitation. Adjacent sections were double-stained with mouse von Willebrand factor monoclonal antibody (Santa Cruz Biotechnology, Santa Cruz, CA, USA) and rabbit polyclonal anti-troponin-C antibody (Santa Cruz Biotechnology) diluted 1:300 overnight at 4℃, then stained with FITC-conjugated anti-mouse IgG antibody (Sigma) and DyLight 405-conjugated anti-rabbit IgG antibody (Sigma) diluted 1:100 for 30 min at 25–28℃. Capillary density from transplanted EPCs was defined in terms of the number of vWF-mCherry double-positive cells per high-power field (400×). In addition, capillary density from non-transplanted EPCs was defined in terms of the number of vWF-positive and mCherry-negative cells per high-power field (400×). The number was averaged after counting in 5 high-power fields.
Survival of Transplanted EPCsThe absolute quantity of the mCherry gene (KU169258.1), as determined by real-time polymerase chain reaction (RT-PCR), was taken as an index of the number of transplanted EPCs. Quantitative RT-PCR was performed 8 weeks after EPC transplantation. The whole heart was harvested, weighed, and homogenized. Genomic DNA was extracted from 20 mg of myocardial tissue from the infarction area and 1.0×10⁶ EPCs. A standard curve was generated with multiple dilutions of pLVX-IRES-mCherry or pLenti6.3-mCherry vector to quantify the absolute gene copy number. The survival rate of transplanted EPCs was calculated as follows: (mCherry gene copies in heart / copies in transplanted EPCs)×100%.
Inflammation and Cytokines in Myocardial TissueTotal protein was extracted from cardiac muscle tissue using lysis buffer (Promega, Madison, WI, USA). Cytokines in cardiac muscle tissue lysates were assessed with Custom Cytokine Array (RayBiotech), as described above.
Macrophage infiltration was also assessed by CD68 and troponin-C double immunofluorescence. Briefly, cryosections were stained with mouse anti-CD68 (Sigma) and rabbit polyclonal anti-troponin-C antibody (Santa Cruz) diluted 1:300, and then stained with Alexa 680-conjugated anti-mouse IgG antibody (Thermo Scientific, Waltham, MA, USA) and FITC-conjugated anti-rabbit IgG antibody (Sigma) diluted 1:100, containing DAPI (Sigma-Aldrich) at 1:300. Macrophage infiltration is expressed as CD68-positive cells per mm2 of myocardial tissue. Tissue sections were examined microscopically under ×200 magnification.
Echocardiography for Heart FunctionThe LV functions of all of the treated rats were monitored by echocardiography at baseline (4 weeks after coronary artery ligation) and at 2, 4, 6, and 8 weeks after cell transplantation. The hearts were imaged in short-axis 2D views at the level of the papillary muscles, and the left ventricular end-systolic dimension (LVDs) and left ventricular end-diastolic dimension (LVDd) were determined. The LVEF was calculated using Pombo’s method as follows: LVEF (%)=[(LVDd3−LVDs3)/LVDd3]×100.
Invasive hemodynamic measurements were also performed 8 weeks after cell transplantation. A MicroTip catheter transducer (SPR-671; Millar-Instruments Inc., Houston, TX, USA) was placed longitudinally in the left ventricle (LV) through the right carotid artery. Hemodynamic parameters including the maximal and minimal rates of change in LV pressure (dP/dtmax and dP/dtmin respectively) and end-systolic P-V relation (ESPVR) were determined. After the hemodynamic assessment, the heart was removed for further biochemical and histological analyses.
Assessment of Infarct SizeAfter the completion of hemodynamic measurements, the hearts were cut into transverse slices and stained with Masson’s trichrome stain (Sigma-Aldrich), as per the manufacturer’s protocol. Computerized planimetry using Image J software was used to measure and calculate: (1) epicardial and endocardial circumference and circumference occupied by the infarcted wall (infarct size was determined as the percentage of total LV circumference); and (2) anterior wall thickness (average of four equidistant measurements).
Real-Time PCRReal-time PCR assays were performed using the Applied Biosystems Real-Time PCR System with TaqMan® primers and probes (Applied Biosystems, Foster City, CA, USA). The relative amounts of mRNA were normalized based on U6 or β-actin, as follows: 2[Ct(β-actin)−Ct(gene of interest)].
Statistical AnalysisData are presented as mean±standard error (SE) unless otherwise stated. SPSS Statistics version 17.0 (SPSS Inc., Chicago, IL, USA) was used for the analyses. The chi-squared test was used for categorical variables. Differences between multiple groups were analyzed by one-way ANOVA. Survival rate was plotted using the Kaplan-Meier method and analyzed using the log-rank test. A P-value of less than 0.05 was considered statistically significant.
There were no significant differences in baseline data among the three groups (Table).
EPC Culture and ExpansionThe culturing of mononuclear cells from human subjects for 14 days yielded a population of spindle-like acLDL+ and Ulex-lectin+ cells matching previous descriptions of the early EPC phenotype (Figure 1B–E). Furthermore, flow cytometry results showed that CD34 and CD133 were co-expressed on the surface of those cells, and CD34+/CD133+ cell numbers increased significantly from 7 to 14 days of culture (23.7±3.8% vs. 51.2±6.3%, P=0.024; Figure 1F and G), which allowed us to classify these cells as EPCs.
We aimed to expand our cells to a target dose of 3×10⁷ EPCs for 60 mL of whole blood, which would be adequate for transplantation and cytokine array. Starting from a single 60-mL blood sample from our subjects, expansion up to 3×10⁷ EPCs was achieved in 34.4% (n=11), 37.5% (n=12), and 31.3% (n=10) of cases in the CON, BV, and MT groups respectively, with P=0.871.
Lentiviral Vector TransfectionEPCs were transfected with recombinant lentiviral expression vector. The optimal MOI was chosen as a trade-off between transfection efficiency and cell viability. An MOI of 100 was used in the present study and the transfection efficiency was over 80% (Figure 1H–K). The expression of miR-126-3p in transfected EPCs was detected by using RT-PCR. From 1 to 9 passages after pLVX-IRES-mCherry-miR-126-3p transfection, miR-126-3p showed stable high expression in EPCs during passaging (Figure 1L and M).
miR-126-3p Overexpression in EPCs Affects CytokinesThe cytokine array showed that G-CSF, VEGF-A, IL-3, IL-10, IGF-1, angiogenin, HGF, TIMP-1, and TIMP-2 were upregulated in the MT group vs. their levels in the BV and CON groups. In addition, IL-8, MCP-1, MCP-2, TNF-α, TNF-β, and MIP-1β were downregulated in the MT group vs. their levels in the BV and CON groups. Regarding the mRNA levels, results consistent with those in the cytokine array were obtained by using real-time RT-PCR. The cytokine levels in EPCs from the MT and BV groups relative to that in the CON group are presented as heat maps in Figure 2A and B. Real-time PCR results are presented in Figure 2C.

miR-126-3p overexpression alters cytokine levels in EPCs. (A,B) Heat maps of levels of 80 cytokines in EPCs of MT and BV. The chemokine levels are presented as the relative optical intensity of MT or BV vs. CON. (C) Quantitative analysis of relative mRNA levels for 15 cytokines in EPCs of BV and MT vs. CON. *P<0.05 vs. CON. Abbreviations as in Figure 1.
Twenty-four hours after transfection, the numbers of EPCs migrating through filters and tube-like structures significantly increased in the MT group compared with the levels in the BV and CON groups (282.6±15.2 vs. 156.4±13.1 and 149.9±15.8 cells/field with P=0.023 for migration, and 42.6±7.8 vs. 12.3±5.8 and 13.9±6.4 tube-like structures/field with P=0.017 for tube-like structure formation) (Figure 3).

EPC migration and tube-like structure formation after miR-126-3p overexpression. (A–C) Representative figures of EPC migration of CON, BV, and MT. The migratory cells were stained with DAPI and counted in high-magnification fields (200×) in each insert. (D–F) Representative figures of EPC tube-like structure formation for CON, BV, and MT. An in vitro angiogenesis assay for EPCs was performed using ECMatrix gel. Cells were stained with crystal violet, and the averages of tube-like structures per field (200×) were compared. Scale bar=200 μm. (G,H) Quantitative analysis of EPC migration and tube-like structures. *P<0.05 vs. CON and ▲P<0.05 vs. BV. Abbreviations as in Figure 1.
In infarction tissues, the capillary density from non-transplanted EPCs showed no significant difference among the CON, BV, and MT groups. However, the capillary density from transplanted EPCs was significantly higher in the MT than in the CON and BV groups (176.65±21.1 vs. 64.8±13.7 and 60.2±12.4 capillaries/field, P=0.022; Figure 4A–E).

miR-126-3p overexpression in EPCs improves capillary density in myocardial tissue. (A–C) Representative figures of capillary density in infarction tissues of CON, BV, and MT. Transplanted EPCs expressed mCherry (red). Von Willebrand factor was labeled by FITC (green) and troponin-C was labeled by DyLight 405 (blue). Capillaries from transplanted EPCs were double-stained with mCherry/von Willebrand factor (yellow). Capillaries from non-transplanted EPCs were stained positive for von Willebrand factor and negative for mCherry (green). (D,E) Quantitative analysis of capillary density from transplanted and non-transplanted EPCs. (F) Quantitative analysis of survival of transplanted EPCs in infarction tissues. Scale bar=200 μm. Abbreviations as in Figure 1.
The survival rate of transplanted EPCs in infarction tissues was quantitatively evaluated by determining the number of copies of the mCherry gene. The survival rate of transplanted EPCs in the MT group was significantly higher than in the BV and CON groups 8 weeks after cell transplantation (23.46±4.62% vs. 6.14±2.05% and 5.98±1.42, P=0.038; Figure 4F).
miR-126-3p Overexpression in EPCs Reduces Inflammation in Myocardial TissuesEight weeks after cell transplantation, macrophage (CD68-positive) accumulation in myocardial tissues in the MT group was significantly lower than that in the CON and BV groups (1.12±0.97 vs. 3.24±1.12 and 3.42±1.21 cells/mm2, P=0.033; Figure 5A–D).
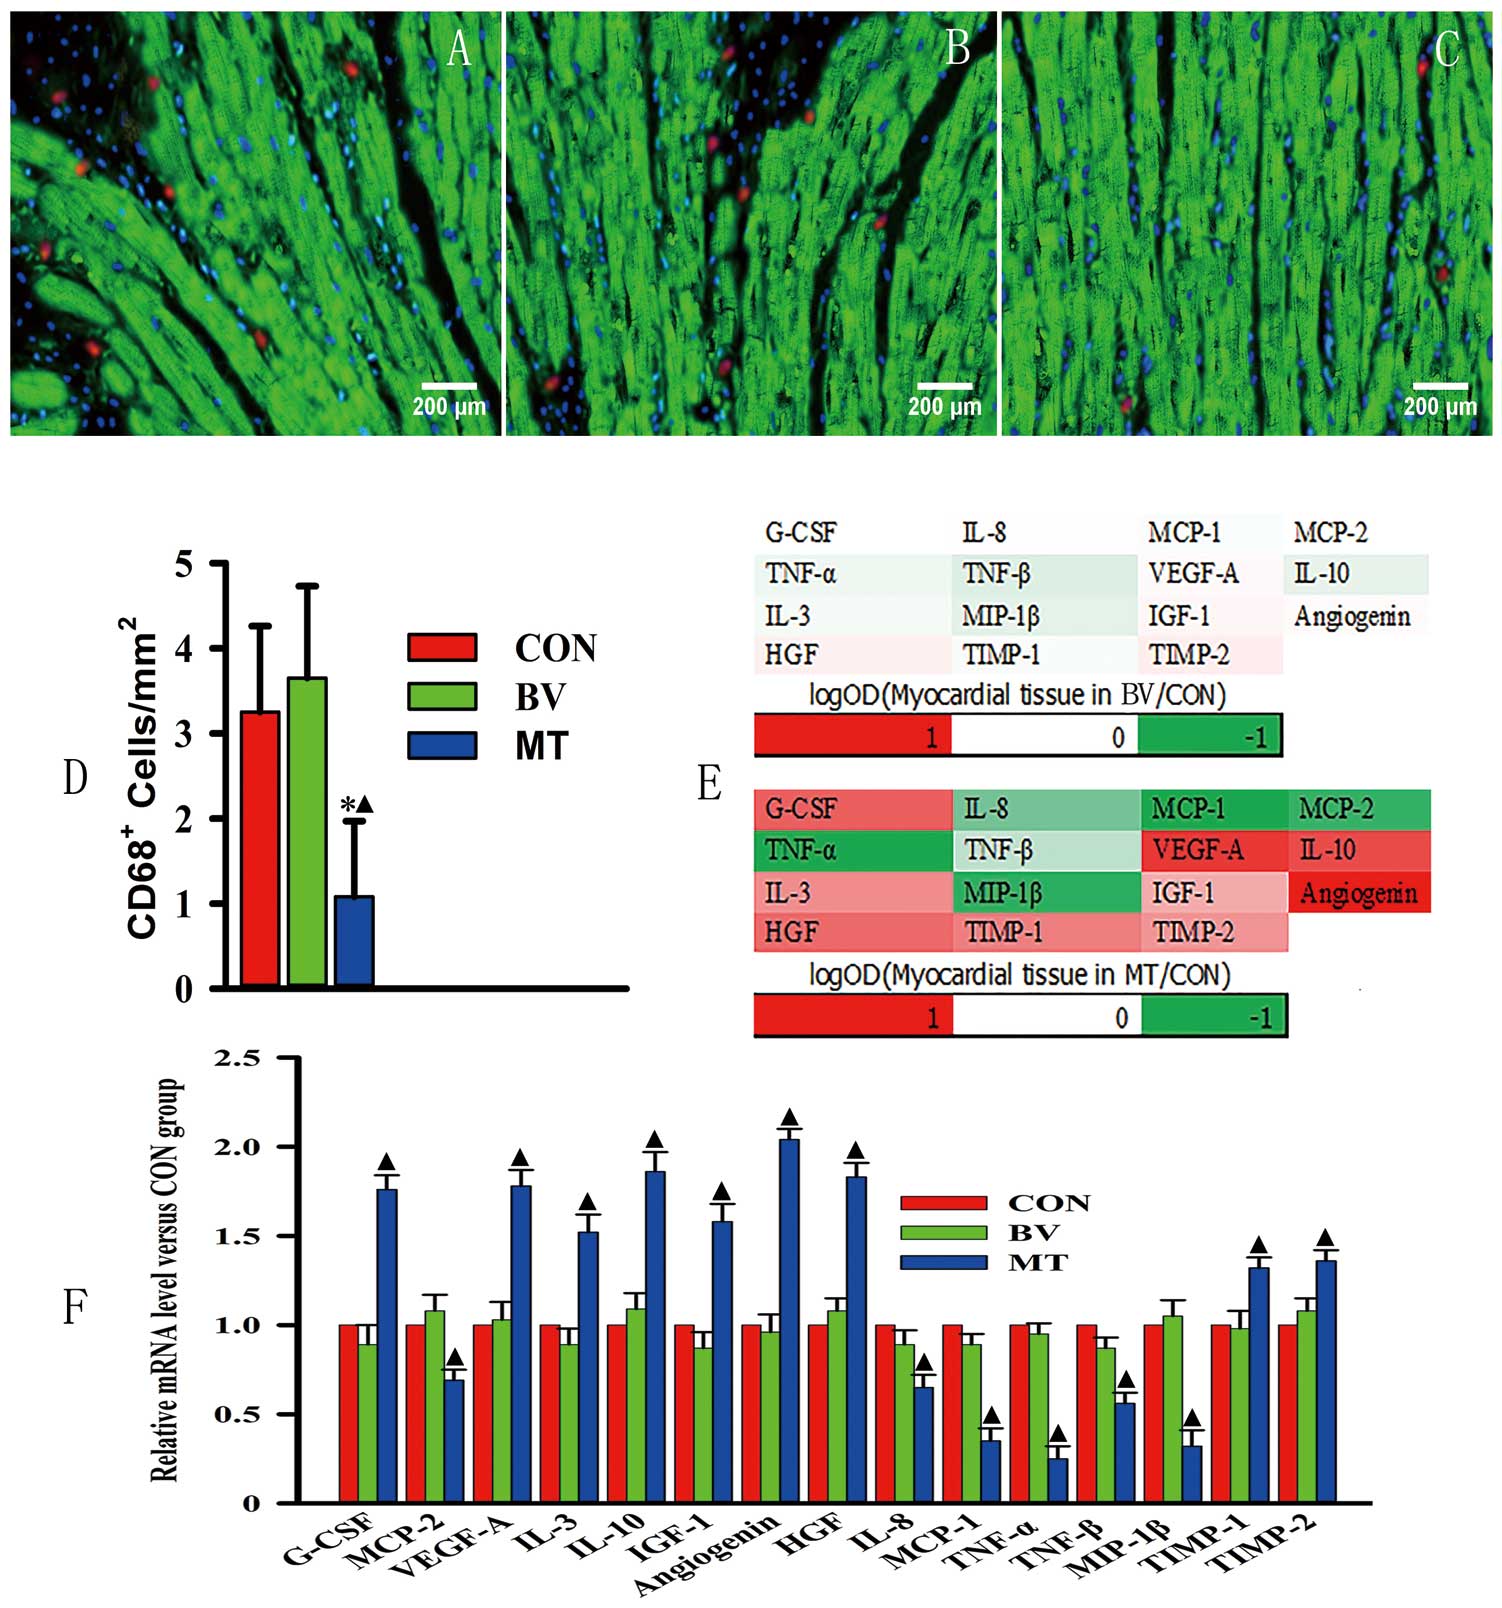
miR-126-3p overexpression in EPCs reduces inflammation in myocardial tissues. (A–C) Representative figures of macrophage (CD68-positive) accumulation in myocardial tissues of CON, BV, and MT respectively. To assess macrophage accumulation, CD68-positive cells were labeled by using Alexa 680 (red), troponin-C was labeled using FITC (green), and nuclei were stained by using DAPI (blue). (D) Quantitative analysis of macrophage accumulation in myocardial tissues among CON, BV, and MT. (E) Heat maps of levels of 15 cytokines in cardiac tissues of BV and MT. (F) Quantitative analysis of mRNA level of 15 cytokines. Scale bar=200 μm. *P<0.05 vs. CON and ▲P<0.05 vs. BV. Abbreviations as in Figure 1.
Meanwhile, G-CSF, VEGF-A, IL-10, IL-3, IGF-1, angiogenin, HGF, TIMP-1, and TIMP-2 were upregulated in myocardial tissues of the MT group compared with the levels found in the BV and CON groups at both mRNA and protein levels. However, IL-8, TNF-α, TNF-β, MCP-1, MCP-2, and MIP-1β were downregulated in tissues of the MT group compared with the levels found in the BV and CON groups (Figure 5E,F).
Change in Myocardial Infarct SizeThere was a significant (P=0.032) reduction of the infarct size in the MT group (23.4±2.6%) when compared with the levels found in the CON (41.5±3.7%) and BV (40.9±2.8%) groups. Moreover, there was a significant (P=0.027) increase of the anterior wall thickness in the MT group (1.73±0.15 mm) when compared with the CON (0.96±0.13 mm) and BV (0.92±0.12 mm) groups (Figure 6).

miR-126-3p overexpression in EPCs reduced myocardial infarction size. (A–C) Representative Masson’s trichrome staining for myocardial section: myocardium (red) and scarred fibrosis (blue). (D–F) Higher magnification of the corresponding areas (black arrows) in (A,B). (G) Quantitative analysis of infarct size. (H) Quantitative analysis of anterior wall thickness. Scale bar=1 mm in (A–C); scale bar=80 μm in (D–F). *P<0.05 vs. CON and ▲P<0.05 vs BV. Abbreviations as in Figure 1.
From baseline to 8 weeks after cell transplantation, there was no difference in the LVEF between the CON and BV groups; however, there was a significant increase detected in LVEF for the MT group from 4 to 8 weeks after cell transplantation, compared with the levels in the CON and BV groups.
Eight weeks after cell transplantation, the catheter examination results showed that dP/dtmax, dP/dtmin, and ESPVR were significantly higher in the MT group compared with the CON and BV groups (Figure 7A–G).

(A–G) miR-126-3p overexpression in EPCs improved heart function. (A–C) Representative pressure-volume (P-V) loops were obtained with a P-V conductance catheter system, showing differences in the end-systolic P-V relation (ESPVR) among CON, BV, and MT. (D–G) Quantitative analysis of ESPVR, dP/dtmax, dP/dtmin, and LVEF. *P<0.05 vs. CON and ▲P<0.05 vs. BV. (H,I) Cumulative survival curve and average survival time of rats. (H) The rat survival rate showed no difference among CON, BV, and MT during the 8 weeks after EPC transplantation. (I) Quantitative analysis of average survival time appeared to show that this time was prolonged in MT. Abbreviations as in Figure 1.
Rat survival was observed up to 8 weeks after EPC transplantation. As shown in Figure 7H and I, the survival rates in the CON, BV, and MT groups showed no significant difference after EPC transplantation. However, the average survival time appeared to be prolonged in the MT group compared with that observed in the CON and BV groups (38.2±4.52 vs. 30.50±4.67 and 31.79±4.32 days, P=0.47).
In our previous study, we found a correlation between a low level of miR-126-3p in EPCs and poor outcome of ICM patients. This prompted us to explore the effects of miR-126-3p overexpression in EPC transplantation on heart function in ICM patients.
Initially, we found that miR-126-3p overexpression clearly increased EPC migration and tube-like structure formation in vitro. This was consistent with a previous study documenting that the overexpression of miR-126-3p prolonged mesenchymal stem cell survival and enhanced angiogenesis.16 Meanwhile, a reduction of miR-126-3p levels in CD34-positive PBMCs due to high-glucose treatment was reported to be associated with impaired pro-angiogenic properties.17 Recent research also revealed that knockdown of miR-126-3p from CD34 Exo abolished angiogenic activity and beneficial function both in vitro and in vivo.18 These findings prompted us to investigate the therapeutic effect of miR-126-3p overexpression on heart function in ICM models.
Second, we conducted animal experiments to test the improvement in heart function of ICM models after the transplantation of EPCs overexpressing miR-126-3p. As expected, miR-126-3p overexpression increased the EPC survival rate by nearly five-fold and capillary density by over three-fold in infarction tissues. Meanwhile, heart function parameters including LVEF, ESPVR, and dp/dt were clearly increased 8 weeks after EPC transplantation. Moreover, the infarction size decreased and anterior wall thickness increased, which means that miR-126-3p-overexpressing EPCs have the ability to inhibit ventricular remodeling in ICM patients. To the best of our knowledge, there have been no other studies performing the transplantation of miR-126-3p-overexpressing EPCs into ICM animal models. However, some studies showed that diazoxide preconditioning could improve EPC survival and angiogenesis in heart with diabetic cardiomyopathy and myocardial ischemia.19,20 The findings of the present study mean that the transplantation of miR-126-3p-overexpressing EPCs may represent a novel and efficient therapeutic approach for ICM.
To reveal the possible involvement of cytokines in miR-126-3p’s promotion of EPC survival and angiogenesis, 80 cytokines were analyzed. miR-126-3p overexpression was shown to upregulate G-CSF, VEGF-A, IL-10, IL-3, IGF-1, angiogenin, HGF, TIMP-1, and TIMP-2, but downregulate IL-8, TNF-α, TNF-β, MCP-1, MCP-2, and MIP-1β in EPCs in vitro. The upregulated cytokines of VEGF-A,21 IL-10,22 IL-323 and HGF24 are effective pro-angiogenic or anti-inflammatory factors, and show anti-ischemic and vascular protection effects. Moreover, G-CSF may efficiently mobilize EPCs,25 and IGF-1 can enhance EPC migration, invasion, and vessel formation.26 Angiogenin can also promote EPC proliferation and colony formation.27 In terms of the downregulated cytokines, IL-8,28 MCP-129 and MIP-1β30 are pro-inflammatory factors and can exert adverse effects on EPC or endothelial cell biology. Moreover, TNF-α can impair EPC proliferation, migration, adhesion capacity, and vasculogenesis.31,32 The effect of TNF-β on EPCs is not clear, but it shares the same receptors as TNF-α and was described as showing functions similar to those of TNF-α in a previous report.33 Therefore, with regard to the cytokine expression profile, miR-126-3p overexpression stimulates EPCs to produce angiogenesis and an anti-inflammatory status by altering cytokine expression. This anti-inflammatory effect was supported by a significant decrease of macrophage accumulation in the infarction area after the transplantation of EPCs overexpressing miR-126-3p. Intriguingly, miR-126-3p overexpression also increased the expression of anti-angiogenic factors including TIMP-1 and TIMP-2,34 and decreased the level of pro-angiogenic factors such as MCP-235 in the current study, which reveals the intricacy of the mechanisms mediated by miR-126-3p. These cytokines were also analyzed in myocardial tissues after EPC transplantation. The results obtained in myocardial tissue in vivo were consistent those obtained in vitro. Taken together, these findings indicate that miR-126-3p overexpression can regulate pro-angiogenic and anti-inflammatory cytokine expression in EPCs, which may promote angiogenesis and inhibit inflammation in infarction tissues in ICM patients through EPC parasecretion or autosecretion.
Because of the circumscribed remit of the current study, there are limitations associated with this research. First, with the intention to remove monocytes and macrophages, we used unconventional methods (selecting only non-adherent PBMCs) to get EPCs. According to the reports by Fadini et al and Kawamoto et al, EPCs abtained by this procedure share the same characteristics with early outgrowth EPCs, including surface markers and ability to promote angiogenesis in vivo.15,36 Further research with EPCs abtained by using conventional methods (selecting adherent PBMCs) are needed. Second, we have not revealed the molecular mechanism by which miR-126-3p alters the cytokine expression profile in EPCs. The possible mechanisms may include post-translational regulation and intricate crosstalk among cytokines. For example, miR-126-3p can increase VEGF-A expression by downregulating its suppressor, SPRED1.37 To resolve this issue, further investigations are required. Finally, because of the limited observation time and small sample size, the current research did not show prolonged model rats survival rate or average survival time. There is thus a need for further research on the beneficial or detrimental effects of the long term, and the results obtained thus far should be interpreted with caution.
miR-126-3p overexpression in EPCs can restore the biology of EPCs from ICM patients by regulating pro-angiogenic and anti-inflammatory cytokine expression. The transplantation of EPCs overexpressing miR-126-3p can enhance heart function by decreasing infarction size, increasing angiogenesis, and inhibiting inflammation in the heart of ICM nude rats. Taking the obtained findings together, miR-126-3p-overexpressing EPCs appear to be an attractive and promising option for treating ICM.
This study was supported by Health Science and Technology Projects of Zhejiang Province (2013KYA160 and 2016KYB228) and Health Science and Technology Projects of Hangzhou City (2011A005 and 2012A010).
We thank all 119 patients with CHF in this study. We also wish to express our gratitude to the staff at Zhi Yun High Biotechnology Institute for providing technical assistance.