Abstract
Background:
To determine the impact of cardiac function and type of mitral valve (MV) surgery on blood flow and energy loss in the left ventricle (LV).
Methods and Results:
This study enrolled patients with ejection fraction (EF) <35% or >50%; both groups had native (n=27 and n=16), repaired (n=19 and n=33), or prosthetic MVs (n=18 and n=19). They were examined by echocardiography-based vector flow mapping to assess the LV blood flow pattern and energy loss per heartbeat. Among patients with preserved EF, those with native MVs displayed a clockwise vortex and relatively low energy loss. In contrast, MV replacement induced a counterclockwise vortex producing higher energy loss than MV repair, which induced a normal clockwise vortex. This indicated the need for MV repair to minimize LV energy loss after surgery. Among the patients with reduced EF, those with native MVs showed a blood flow pattern similar to those with preserved EF and native MVs; furthermore, those with repaired MVs and half of the patients with prosthetic MVs displayed a clockwise vortex, resulting in no difference in energy loss between the 2 types of MV surgery.
Conclusions:
Cardiac function and the type of MV surgery are factors affecting the postoperative LV blood flow pattern. MV replacement resulted in abnormal blood flow with normal cardiac function, whereas advanced cardiomyopathy modified the blood flow pattern post-MV replacement.
Recent improvements in imaging technology have enabled visualization of blood flow in the left ventricle (LV).1–4
In the healthy human LV, it forms an energy-efficient vortex2,4,5
that facilitates inflow into the LV, minimizes dissipation of energy, preserves momentum, and redirects flow towards the LV outflow tract.6–8
However, some of the mechanical energy that the LV myocardium generates to suck and eject the blood is consumed by the viscous friction of blood flow in the LV.2,9
This energy loss can be analyzed using a novel imaging technique: echocardiographic vector flow mapping (VFM).1,2,4,9,10
The anatomic structure of the LV, including its shape, the morphology of the mitral valve (MV), and type of cardiac function have been reported to be related to the blood flow pattern in the LV.9,11,12
An altered pattern could induce higher energy loss than the normal energy-efficient blood flow.9–12
Patients with higher energy losses in the LV require more mechanical energy from the LV to maintain sufficient hemodynamics or reduce their cardiac output, resulting in a deteriorating long-term cardiac prognosis.10,13,14
Although MV surgery has been reported to change the blood flow pattern in the LV,9,11
it is unclear whether the surgical method or cardiac function is associated with blood flow changes or energy loss. We hypothesized that the type of MV surgery or LV function would be associated with the blood flow pattern and energy loss in the LV. Thus, we aimed to evaluate the relationship of blood flow and energy loss in the LV with cardiac function and type of MV surgery.
Methods
Study Cohort
After approval from the institutional review board of at Osaka University Hospital (institutional number: 16100-3) and opt-out consent from patients, we collected data for this study from 40 and 24 patients with ischemic and non-ischemic cardiomyopathy, respectively, with an ejection fraction (EF) <35% and mild or lower mitral regurgitation (MR). They all showed generalized hypokinesis of LV wall motion. Of them 27 patients had native MVs and 37 had undergone MV repair (n=19) with mitral annuloplasty or MV replacement (n=18) using biological (n=13) or mechanical (n=5) valves for severe functional MR between April 2013 and March 2017. In addition, 68 patients with mild or lower MR and an EF >50% without asynergy of LV wall motion were enrolled to investigate the association between cardiac function and blood flow pattern in the LV. Of them, 16 had native MVs and 52 had undergone MV repair (n=33) with mitral annuloplasty and additional repair techniques or MV replacement (n=19) with biological (n=16) or mechanical (n=3) valves for severe regenerative MR between April 2013 and March 2017. Seven low-EF patients with heart failure requiring in-hospital treatment were excluded. All mechanical valves used for MV replacement in this study were placed in anti-anatomical mitral position. The MV repair procedures are shown in
Table S1
and the patients’ characteristics are shown in
Table 1.
Table 1.
Characteristics of the Study Patients
| |
Normal EF |
Low EF |
Native MV
(n=16) |
Repaired MV
(n=33) |
Prosthetic MV
(n=19) |
Native MV
(n=27) |
Repaired MV
(n=19) |
Prosthetic MV
(n=18) |
| Age |
74 (71–77) |
61 (55–71) |
74 (63–71) |
63 (50–68) |
68 (59–72) |
65 (56–67) |
| Male |
13 (81%) |
18 (55%) |
11 (58%) |
23 (85%) |
17 (89%) |
14 (78%) |
| Etiology |
| Ischemic |
– |
– |
– |
15 (56%) |
17 (89%) |
8 (44%) |
| Non-ischemic |
– |
– |
– |
12 (44%) |
2 (11%) |
10 (56%) |
| Left bundle branch block |
0 (0%) |
0 (0%) |
1 (5%) |
8 (30%) |
7 (37%) |
10 (56%) |
| QRS (ms) |
91 (88–98) |
92 (88–98) |
92 (86–97) |
128 (101–154) |
120 (107–142) |
131 (101–148) |
| Prosthetic valve |
| Biological |
– |
– |
16 (84%) |
– |
– |
13 (72%) |
| Mechanical |
– |
– |
3 (16%) |
– |
– |
5 (28%) |
| LV end-diastolic dimension (mm) |
46 (42–48) |
46 (43–50) |
42 (39–46) |
62 (60–71) |
66 (56–69) |
72 (61–77) |
| LV end-systolic dimension (mm) |
28 (27–30) |
33 (30–38) |
28 (25–31) |
58 (52–66) |
59 (49–62) |
67 (53–75) |
| LVEF (%) |
68 (66–70) |
64 (58–69) |
68 (60–71) |
25 (17–30) |
31 (25–33) |
23 (18–28) |
| E/A ratio |
0.8 (0.7–0.9) |
1.1 (0.8–1.3) |
0.9 (0.9–1.0) |
1.2 (0.9–1.7) |
1.1 (0.8–1.7) |
1.8 (1.8–1.8) |
Postoperative transmitral gradient
(mmHg) |
– |
4 (3–5) |
6 (5–7) |
– |
3 (2–4) |
4 (3–5) |
| MR grade |
| None |
14 (88%) |
31 (94%) |
17 (89%) |
9 (33%) |
10 (53%) |
15 (83%) |
| Mild |
2 (13%) |
2 (6%) |
2 (11%) |
18 (67%) |
9 (47%) |
3 (17%) |
| Concomitant procedure |
| Coronary artery bypass grafting |
– |
14 (42%) |
5 (26%) |
– |
3 (16%) |
2 (11%) |
| Tricuspid annuloplasty |
– |
4 (21%) |
6 (32%) |
– |
3 (16%) |
6 (33%) |
EF, ejection fraction; LV, left ventricular; MR, mitral regurgitation; MV, mitral valve.
Patients were examined between 6 and 12 months after surgery by standard 2D transthoracic echocardiography using ProSound Alpha 7 (Hitachi-Aloka Medical Ltd., Tokyo, Japan), with a UST-52105 probe. Standard echocardiographic data, such as LV end-diastolic dimension (LVEDD), LV end-systolic dimension, LVEF, E/A ratio, postoperative transmitral gradient, and MR grade were gathered from official reports (Table 1). Specific data, such as the angle between the MV annular plane and the ventricular septum, were analyzed offline using representative movies of the long-axis views. Color Doppler images with frame rates of 27–40 frames/s in the apical long-axis view were transferred to dedicated analysis software, VFM Analysis (DAS-RS-1, Hitachi-Aloka Medical Ltd.) to visualize vortical blood flow and analyze energy loss in the LV. MR severity was categorized according to the Recommendations for Noninvasive Evaluation of Native Valvular Regurgitation15
(none, no MR jet; mild, regurgitant orifice area <0.2 cm2, regurgitant volume <30 mL/beat, regurgitant fraction <30%, and Doppler vena contracta width <0.3 cm).
Visualization of Vortical Blood Flow and Energy Loss Analysis in the LV
The velocity vectors in the LV were obtained by application of the continuity equation to color Doppler and speckle-tracking echocardiography using VFM Analysis.16,17
The endocardial border was manually traced at end-systole and automatically determined at other phases during 3 cardiac cycles. The principle of VFM is that the extraction of information from the distribution of Doppler color flow in the beam direction by post-processing computational algorithm allows estimation of the velocity component in the direction which intersects perpendicular with a beam and displays it without angle dependency.18
Thus, blood flow in the LV was visualized with the velocity vector showing its direction and magnitude. The direction of the vortex was decided by the plus or minus sign of the vorticity of the maximal vortex in the LV. Furthermore, the size and vorticity magnitude of the maximal vortex in the LV at diastolic phase were evaluated using VFM Analysis.
The velocity vector allowed calculation of energy loss owing to viscous friction using the following formula:

where µ is the coefficient of blood viscosity,
u
and
v
are the velocity components along the Cartesian axes (x
and
y), and
A
is the area of the grid unit.
Energy loss was measured during 3 cardiac cycles in sinus rhythm, and the average of energy loss in 1 cardiac cycle was used for further analysis. As the equation indicates, energy loss was the sum of squared differences between neighboring velocity vectors. It increases at points where the size and direction of velocity vectors change. For example, energy loss is likely to increase with turbulent flow. The energy loss values are expressed in watts per meter (W/m) because VFM images are two-dimensional.
We used the velocity at a point away from the wall because the VFM meshes were not boundary-fitted but were fixed in a measurement plane. The element that included the point was identified, and the velocity vector component parallel to the wall was interpolated. Wall shear stress was calculated with the first differential between this velocity and speckle-tracking measured the wall velocity using the same software (VFM Analysis).16
Statistical Analysis
Data are presented as frequencies with percentages for categorical variables and as medians with interquartile ranges for continuous variables. Categorical variables were analyzed using the chi-square test or Fisher’s exact test. Continuous variables were examined using Student’s t-test or the Wilcoxon rank-sum test. The Kruskal-Wallis test was used to compare the size and vorticity magnitude of the maximal vortex, the velocity of mitral inflow, energy loss, and wall shear stress on the ventricular septum in all groups. When the Kruskal-Wallis test was significant, group differences were compared using the Steel-Dwass test. Spearman’s rank correlation was used to compare the relationship of the angle between the MV annular plane and ventricular septum with LVEDD, the association between energy loss in the LV and the vorticity magnitude, and the association between energy loss in the LV and the valve size in patients with a prosthetic MV. Multivariate regression analysis was used to identify the significant factors related to energy loss in the LV. Statistical analyses were performed using JMP®
13 (SAS Institute Inc., Cary, NC, USA). Statistical significance was defined as P<0.05.
Results
Flow Pattern and Direction of the Vortex in the LV
Representative sequential images of LV vortical blood flow in all groups are shown in
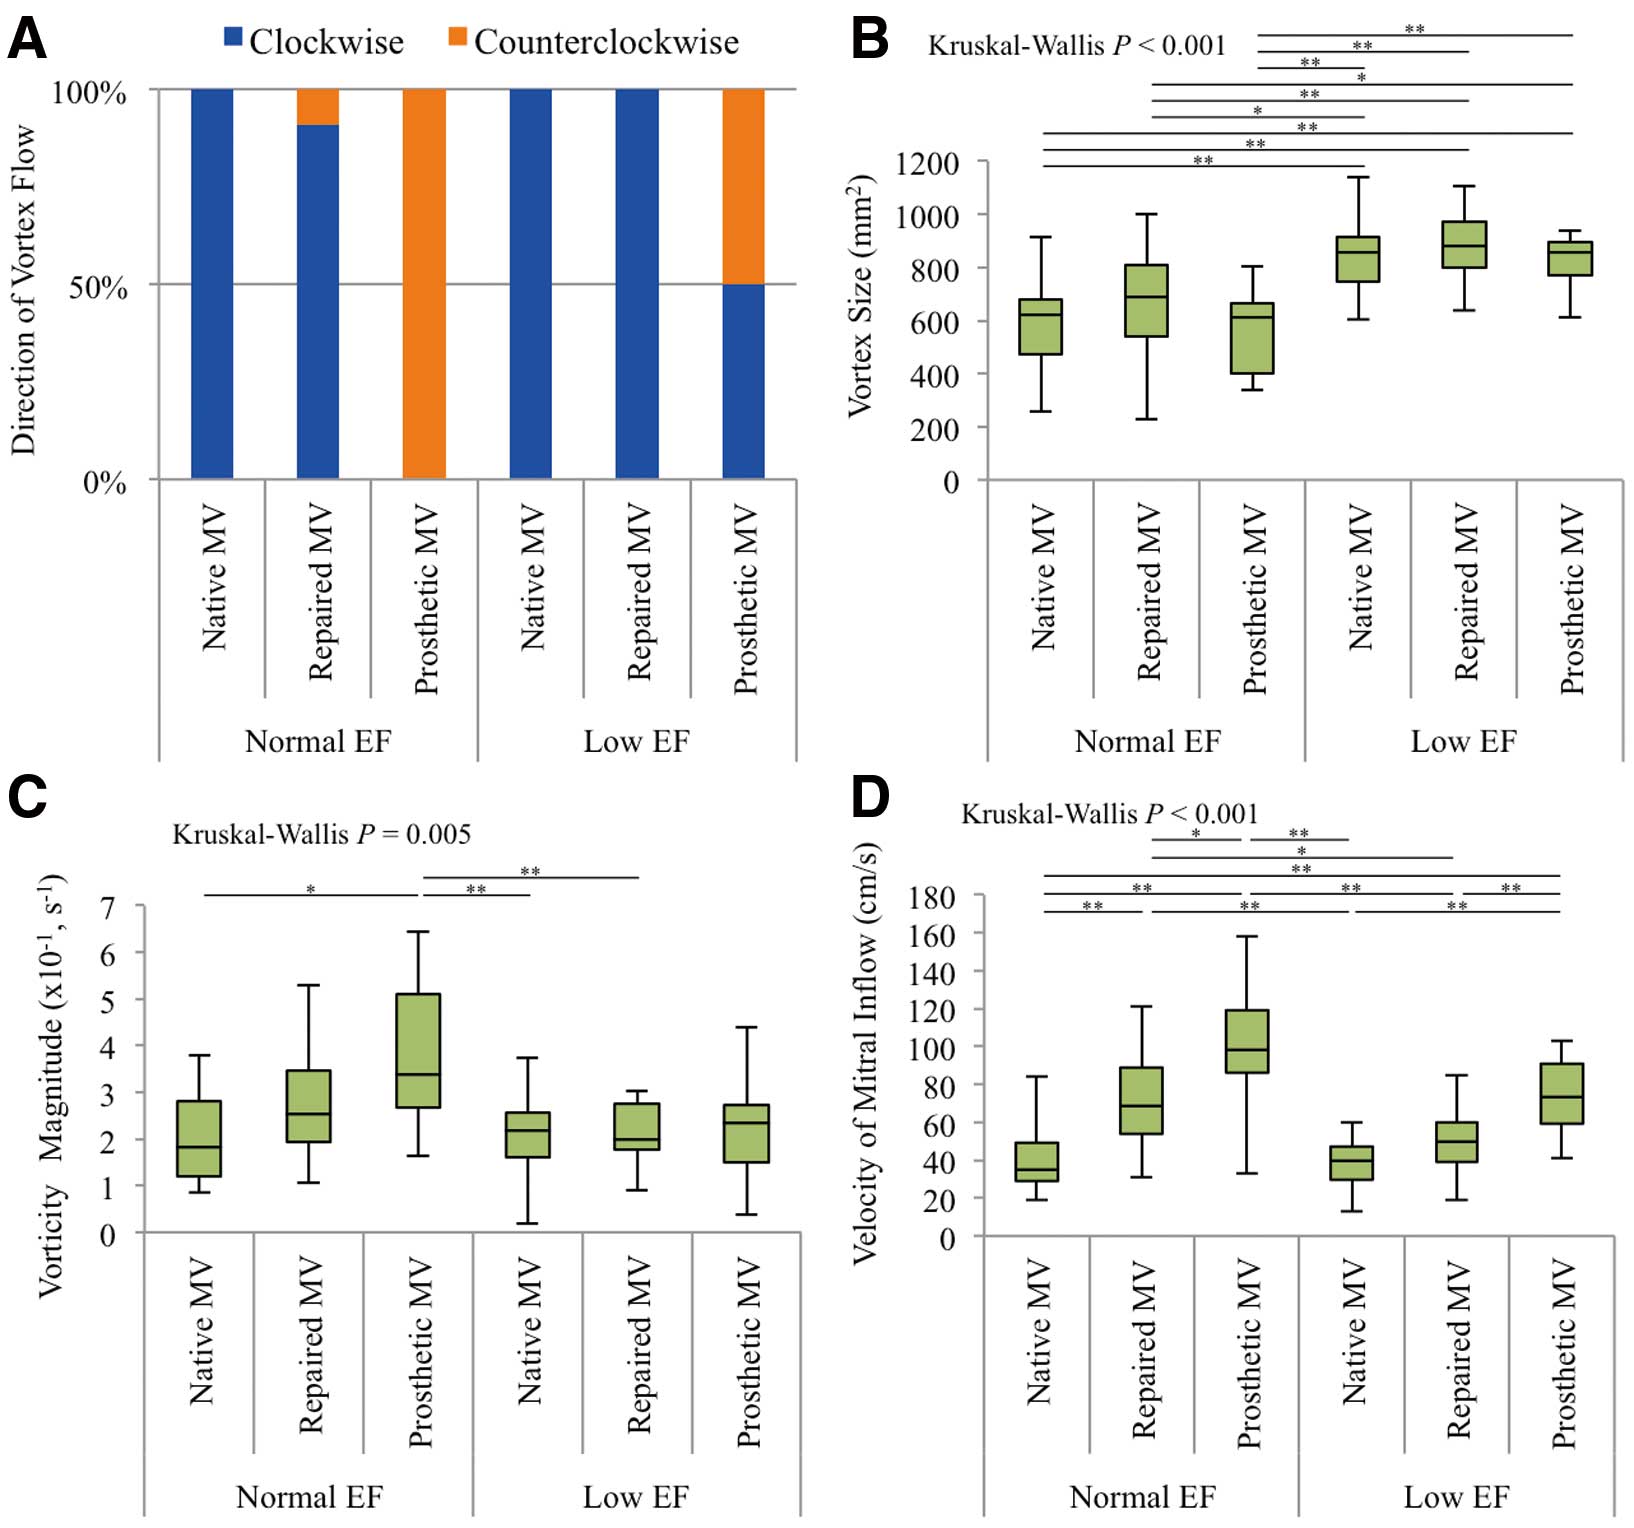
Figure 1. In patients with normal EF and native MVs, the transmitral inflow was directed to the posterior wall in early diastole. Thereafter, a clockwise vortex was formed in the LV during mid–late diastole. In the atrial contraction phase, posteriorly directed transmitral inflow was observed again and it formed a new vortex converging on the previous one, which was maintained during the isovolumic contraction time. The laminar outflow was directed towards the aortic valve, after which the vortex decreased in size and finally disappeared during the systolic phase. The aforementioned vortical blood flow pattern was exhibited in patients with normal EF and repaired MVs; 30 (91%) of these patients displayed clockwise vortices. However, transmitral inflow toward the ventricular septum and counterclockwise vortices in the diastolic phase were observed in all patients with normal EF and prosthetic MVs, whether the valves were mechanical or biological. However, in patients with low EF and a dilated, spherical LV, together with either a native or repaired MV, clockwise vortices were observed. Notably, 9 of 18 patients with low EF and a prosthetic MV (1 mechanical and 8 biological) displayed clockwise vortices, and the remaining 9 patients showed counterclockwise vortices (Figure 2A).

To assess the vortex that affected hydrodynamic efficiency and energy loss, we evaluated the size and vorticity magnitude of the maximal vortex. The size of the maximal vortex was similar in the 3 groups comprising patients with normal EF and in the 3 groups comprising patients with low EF. However, the size of the maximal vortex was statistically different among the 6 groups (Kruskal-Wallis: P<0.001), especially between groups comprising patients with normal EF and low EF (Figure 2B; Tables 2A,S2A). However, the vorticity magnitude in patients with normal EF and prosthetic MVs was significantly higher than in those with normal EF and native MVs, low EF and native MVs, and low EF and repaired MVs (Kruskal-Wallis: P=0.005) (Figure 2C; Tables 2A,S2B). The velocity of mitral inflow in the early diastolic phase in patients with prosthetic MVs was higher than that in patients with repaired MVs regardless of contractile function (Kruskal-Wallis: P<0.001) (Figure 2D; Tables 2A,S2C).
Table 2.
(A) Parameters Associated With Blood Flow Pattern and (B) Wall Shear Stress on the Ventricular Septum in All Groups
| (A) |
Normal EF |
Low EF |
P value |
|
|
Native MV
(n=16) |
Repaired
MV (n=33) |
Prosthetic
MV (n=19) |
Native MV
(n=27) |
Repaired
MV (n=19) |
Prosthetic
MV (n=18) |
|
|
| Vortex size (mm2) |
619
(475–681) |
690
(538–809) |
612
(403–663) |
857
(745–912) |
881
(798–971) |
857
(769–894) |
<0.001 |
|
|
Vorticity magnitude
(s−1) |
0.18
(0.12–0.28) |
0.25
(0.19–0.36) |
0.34
(0.27–0.51) |
0.22
(0.16–0.26) |
0.20
(0.18–0.28) |
0.23
(0.15–0.28) |
0.005 |
|
|
Velocity of mitral
inflow (cm/s) |
35
(29–49) |
69
(54–89) |
98
(86–119) |
40
(30–47) |
50
(39–60) |
74
(59–91) |
<0.001 |
|
|
Energy loss in LV
(W/m) |
1.8
(1.1–2.6) |
4.2
(3.5–4.6) |
6.6
(4.7–9.8) |
2.4
(1.8–3.0) |
3.2
(2.4–4.6) |
4.6
(2.7–5.7) |
<0.001 |
|
|
| (B) |
Normal EF |
Low EF |
P value |
Native
MV |
Repaired
MV |
Prosthetic
MV |
Native
MV |
Repaired
MV |
Prosthetic
MV |
Clockwise
(n=16) |
Clockwise
(n=30) |
Counterclockwise
(n=3) |
Counterclockwise
(n=19) |
Clockwise
(n=27) |
Clockwise
(n=19) |
Clockwise
(n=9) |
Counterclockwise
(n=9) |
Wall shear stress on
ventricular septum
(Pa) |
3.5
(2.4–5.5) |
4.7
(2.8–8.9) |
15.8
(10.8–44.9) |
39.9
(23.2–53.2) |
2.4
(1.0–4.7) |
2.2
(1.2–4.7) |
2.3
(1.0–3.5) |
31.0
(17.4–56.5) |
<0.001 |
EF, ejection fraction; LV, left ventricle; MV, mitral valve.
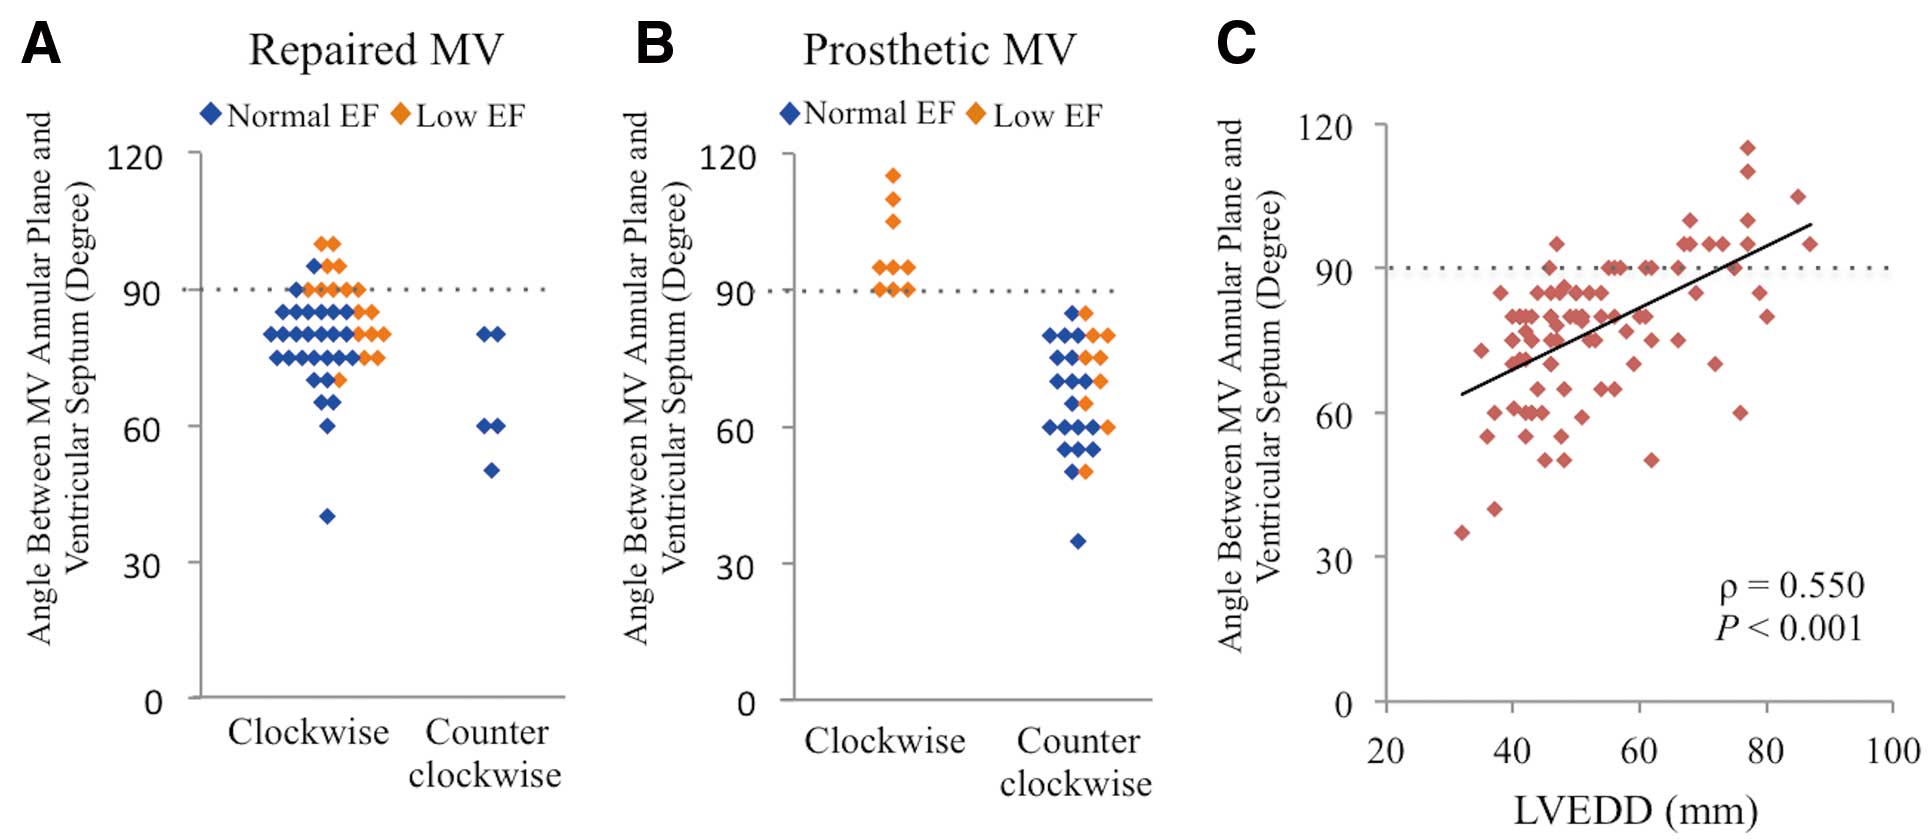
Because inflow through a prosthetic MV, including biological and mechanical valves, is perpendicular to the MV annular plane, we investigated the angle between the MV annular plane and the ventricular septum in patients with repaired and prosthetic MVs using echocardiographic images in the long-axis view. In patients with repaired MVs, the direction of the vortex in the LV was not related to the magnitude of the angle (Figure 3A). However, patients with a ≥90° angle displayed a clockwise vortex and patients with a <90° angle showed a counterclockwise vortex after MV replacement (Figure 3B). The angle had a positive correlation with LVEDD, indicating that a counterclockwise vortex rarely occurred in a dilated LV (ρ=0.550, P<0.001) (Figure 3C). The type of prosthetic valve (Fisher’s exact test: P=0.294) (Table S3A) and the etiology of cardiomyopathy (Fisher’s exact test: P=0.637) (Table S3B) were unrelated to vortical flow direction. In patients with a repaired MV, the type of MV repair was not significantly associated with vortical flow direction (Table S1).
We investigated energy loss from viscous friction produced by blood flow in the LV. The sequential energy loss images are shown in
Figure 4
(yellow and black represent high- and low-level energy loss, respectively). Representative time-dependent changes in LV energy loss during 1 cardiac cycle in all groups are displayed in
Figure 5A.
The peak energy loss during 1 cardiac cycle was observed in early–mid-diastole in all groups. The total energy loss during 1 heartbeat is shown in Figure 5B, Table 2A and Table S4 (Kruskal-Wallis: P<0.001). For a normal EF, patients with prosthetic MVs exhibited higher energy loss than patients with native or repaired MVs, indicating the need for the MV repair procedure to minimize energy loss in the LV after MV surgery. Notably, for a low EF, energy loss was significantly higher in patients with prosthetic MVs compared with patients with native MVs, but not significantly higher compared with patients with repaired MVs.
Energy loss moderately correlated with vorticity magnitude in the maximal vortex (ρ=0.518, P<0.001) (Figure 5C). Notably, the approximate straight line in patients with a counterclockwise vortex (ρ=0.446, P=0.012) was located above that of patients with a clockwise vortex (ρ=0.467, P<0.001) (Figure 5C). However, in the low-EF prosthetic MV group, comprising patients with a clockwise or counterclockwise vortex, vortical direction was unrelated to energy loss in the LV (clockwise: 4.8 [3.6–5.7] W/m; counterclockwise: 4.0 [2.5–6.6] W/m; Wilcoxon rank-sum test: P=0.566) (Figure 5D), or to vorticity magnitude (clockwise: 2.6 [1.8–3.3] s−1; counterclockwise: 2.0 [1.5–2.7] s−1; Wilcoxon rank-sum test: P=0.452) (Figure 5E).
In all patients, multivariate regression analysis revealed that a prosthetic MV and high vorticity magnitude were significant factors for increased LV energy loss (Table S5). Furthermore, in patients with a prosthetic MV, small-sized prosthetic valves were associated with high LV energy loss (ρ=−0.385, P=0.019) (Figure S1). In patients with a repaired MV, the type of MV repair procedure was not significantly associated with LV energy loss (Table S1). Notably, patients with a counterclockwise vortex in the LV had higher wall shear stress on the ventricular septum than patients with a clockwise vortex (Kruskal-Wallis: P<0.001) (Figure 5F; Tables 2B,S6).
Discussion
The results of the current study showed that MV repair in patients with preserved EF induced normally directed vortical flow, also found in healthy cohorts, but a significantly higher LV energy loss compared with healthy cohorts. By contrast, MV replacement in patients with preserved EF produced reverse vortical blood flow and collision of inflow with the ventricular septum, causing significantly greater energy loss in the LV compared with MV repair. However, in patients with low EF, MV repair allowed normally directed vortical flow and no difference in energy loss between patients with native and repaired MVs. Of note, MV replacement in patients with low EF produced normal and reverse vortical blood flow (50% and 50% of cases, respectively) (Figure 6). Energy loss in patients with prosthetic MVs and low EF was not different from that in patients with a repaired MV and low EF, indicating that the difference in energy loss between the types of MV surgery in patients with reduced EF may become less because these hearts produce only a small amount of energy for cardiac output. Furthermore, the vortex direction in patients with a prosthetic MV and low EF was not associated with LV energy loss, but the reverse vortex increased wall shear stress on the ventricular septum. Moreover, this study demonstrated that the angle between the MV annular plane and ventricular septum, which correlated with LVEDD, determined the direction of vortical flow after MV replacement.

Patients in all groups exhibited peak energy loss during 1 cardiac cycle in early–mid-diastole, because the blood flows into the LV created a vortex in the dilated LV chamber in the diastolic phase, while the blood flows out of the aorta and the LV chamber became smaller in the systolic phase. As blood flow and energy loss could not be clearly divided by the diastolic and systolic phases, because both phases are consecutive, we analyzed them using energy loss during 1 cardiac cycle in this study to avoid bias related to divided timing.
LV blood flow in patients with normal EF after MV surgery has been reported.9,11
Faludi et al demonstrated that the LV blood flow pattern in patients with biological prosthetic MVs was different from that in patients with mechanical prosthetic MVs,11
but the blood flow patterns in the current study were not different between the biological and anti-anatomically placed mechanical valves, because inflow through both types of prosthetic MV was perpendicular to the annular plane. This contradiction might be related to the different angles of the echocardiography views. Further analysis concerning the different blood flow patterns between prosthetic valve types is needed using a 3D system. However, the results of our 2D study were convincing, because a recent study using 4D flow magnetic resonance imaging, also known as 3D and time-resolved velocity-encoded magnetic resonance imaging, demonstrated that the inflow angle and vortex flow in the LV are associated with elevated volumetric viscous energy loss,19
similar to that shown in the current study. Akiyama et al have reported that MV repair produces a normally directed vortex and MV replacement induces a reverse-directed vortex,9
which is similar to our findings in patients with preserved EF. This is perhaps because the larger anterior mitral leaflet, compared with the posterior leaflet, delivers inflow to the posterior wall in patients with native and repaired MVs. However, MV repair in patients with preserved EF induced a higher vorticity magnitude and LV energy loss than in patients with native MVs, perhaps because the velocity of transmitral inflow in patients with a repaired MV and normal EF is increased by the small effective orifice area from the remodeled redundant leaflets and annuloplasty, even if functional mitral stenosis does not occur. In contrast, the velocity of transmitral inflow in patients with a prosthetic MV and normal EF is significantly higher than in those with native and repaired MVs, probably because inflow velocity through the prosthetic MV perpendicular to the annular plane is more affected by the sucking force from LV. The increase in inflow velocity and the collision of inflow against the ventricular septum induces a significantly increased energy loss in the LV.
Importantly, the present findings suggested that LV shape is a factor influencing LV blood flow; Ro et al reported that ventricular septum hypertrophy affects the blood flow pattern.12
LV shape in patients with low EF is more spherical than in patients with preserved EF,20
resulting in different blood flow changes in patients with normal or low EF. Because the perpendicular direction of the mitral annular plane is toward the apex because of LV dilatation, the mitral inflow perpendicular to the mitral annular plane did not collide with the ventricular septum and produced a normally directed vortex in half of the patients with low EF and a prosthetic MV. Moreover, the current study revealed that the angle between the mitral annular plane and the ventricular septum was clearly associated with vortical direction in post-MV-replacement patients and that LVEDD, which indicates the degree of LV dilatation, also correlated with this angle. This means that advanced LV remodeling changes the mitral inflow direction from the ventricular septum to the apex and tends to maintain normally directed vortical blood flow in patients with prosthetic MVs. Notably, the present study also revealed that the direction of vortical blood flow did not influence energy loss or the vorticity magnitude in patients with reduced EF and prosthetic MVs. This was because inflow through the prosthetic MV did not collide strongly with the ventricular septum but was directed towards the ventricular septum near the apex in low-EF patients, even if they showed a reverse-directed vortex in the LV. However, the reverse-directed vortex increased wall shear stress on the ventricular septum, even in low-EF patients, showing no increment in energy loss in the LV, which subsequently loads on the ventricular septal myocardium.
Functional MR is associated with poor prognosis in patients with ischemic or non-ischemic cardiomyopathy; patients with severe functional MR had a 60–85% survival rate at 1 year in previous studies.21–24
However, the appropriate surgical treatment for functional MR, such as repair vs. replacement of MV, is unclear for patients with poor LV function.21,24–26
Therefore, the appropriate surgical option for MR in heart failure patients should be discussed from various standpoints for improved prognosis. Because LV energy loss might be a factor determining cardiac prognosis, especially in patients with reduced EF, MV surgery that reduces energy loss should be performed from the viewpoint of blood flow pattern. The most important finding in the current study was that in low-EF patients, energy loss in the prosthetic MV was not significantly different from that in the repaired MV. A recent randomized controlled trial demonstrated no significant difference in LV reverse remodeling or survival at 2 years between patients who underwent MV repair or replacement, although MR recurred more frequently in the repair group in association with a higher rate of heart failure-related admissions compared with the replacement group.24
This suggests that MV replacement, which was comparable to MV repair regarding LV energy loss in the current study, might be recommended for functional MR in patients with low EF.
Study Limitations
Because the current study used 2D echocardiography, the actual energy loss in the 3D LV is unknown. Although energy loss in the LV was reported as myocardial load, the amount of energy produced by the myocardium was not completely clarified. Thus, we could not ascertain the percentage of myocardial energy involved in the LV energy loss. To address this, the development of a new imaging modality is necessary. Other limitations of this study include its retrospective nature, the small number of cases examined, its single-center design, and the differences in patients’ backgrounds.
Conclusions
Cardiac function and the type of MV surgery affected the postoperative blood flow pattern in the LV. Although MV replacement produced a reverse-directed vortex and higher energy loss in the LV compared with MV repair in patients with preserved EF, no significant difference in blood flow pattern was noted between either operative method in patients with reduced EF.
Funding
No funding was obtained for this study.
Conflict of Interest
None declared.
Supplementary Files
Supplementary File 1
Figure S1.
The graph shows the significant association between the valve size and LV energy loss.
Table S1.
The procedure of mitral valve repair
Table S2.
Parameters associated with blood flow patterns in all groups
Table S3.
Factors related to the direction of vortical blood flow in patients with low EF and prosthetic mitral valves
Table S4.
The LV energy loss in all groups
Table S5.
The multivariate regression analysis for increase in LV energy loss
Table S6.
Wall shear stress on the ventricular septum in all groups
Please find supplementary file(s);
http://dx.doi.org/10.1253/circj.CJ-18-0625
References
- 1.
Uejima T, Koike A, Sawada H, Aizawa T, Ohtsuki S, Tanaka M, et al. A new echocardiographic method for identifying vortex flow in the left ventricle: Numerical validation. Ultrasound Med Biol 2010; 36: 772–788.
- 2.
Akiyama K, Maeda S, Matsuyama T, Kainuma A, Ishii M, Naito Y, et al. Vector flow mapping analysis of left ventricular energetic performance in healthy adult volunteers. BMC Cardiovasc Disord 2017; 17: 21.
- 3.
Yoshida S, Fukushima S, Miyagawa S, Toda K, Sawa Y. Visualization of vortex flow and shear stress in the aortic root during left ventricular assist device support. J Thorac Cardiovasc Surg 2017; 154: 877–878.
- 4.
Kilner PJ, Yang GZ, Wilkes AJ, Mohiaddin RH, Firmin DN, Yacoub MH. Asymmetric redirection of flow through the heart. Nature 2000; 404: 759–761.
- 5.
Rodriguez Munoz D, Moya Mur JL, Fernandez-Golfin C, Becker Filho DC, Gonzalez Gomez A, Fernandez Santos S, et al. Left ventricular vortices as observed by vector flow mapping: Main determinants and their relation to left ventricular filling. Echocardiography 2015; 32: 96–105.
- 6.
Hong GR, Pedrizzetti G, Tonti G, Li P, Wei Z, Kim JK, et al. Characterization and quantification of vortex flow in the human left ventricle by contrast echocardiography using vector particle image velocimetry. JACC Cardiovasc Imaging 2008; 1: 705–717.
- 7.
Martinez-Legazpi P, Bermejo J, Benito Y, Yotti R, Perez Del Villar C, Gonzalez-Mansilla A, et al. Contribution of the diastolic vortex ring to left ventricular filling. J Am Coll Cardiol 2014; 64: 1711–1721.
- 8.
Charonko JJ, Kumar R, Stewart K, Little WC, Vlachos PP. Vortices formed on the mitral valve tips aid normal left ventricular filling. Ann Biomed Eng 2013; 41: 1049–1061.
- 9.
Akiyama K, Nakamura N, Itatani K, Naito Y, Kinoshita M, Shimizu M, et al. Flow-dynamics assessment of mitral-valve surgery by intraoperative vector flow mapping. Interact Cardiovasc Thorac Surg 2017; 24: 869–875.
- 10.
Stugaard M, Koriyama H, Katsuki K, Masuda K, Asanuma T, Takeda Y, et al. Energy loss in the left ventricle obtained by vector flow mapping as a new quantitative measure of severity of aortic regurgitation: A combined experimental and clinical study. Eur Heart J Cardiovasc Imaging 2015; 16: 723–730.
- 11.
Faludi R, Szulik M, D’hooge J, Herijgers P, Rademakers F, Pedrizzetti G, et al. Left ventricular flow patterns in healthy subjects and patients with prosthetic mitral valves: An in vivo study using echocardiographic particle image velocimetry. J Thorac Cardiovasc Surg 2010; 139: 1501–1510.
- 12.
Ro R, Halpern D, Sahn DJ, Homel P, Arabadjian M, Lopresto C, et al. Vector flow mapping in obstructive hypertrophic cardiomyopathy to assess the relationship of early systolic left ventricular flow and the mitral valve. J Am Coll Cardiol 2014; 64: 1984–1995.
- 13.
Bahlmann E, Gerdts E, Cramariuc D, Gohlke-Baerwolf C, Nienaber CA, Wachtell K, et al. Prognostic value of energy loss index in asymptomatic aortic stenosis. Circulation 2013; 127: 1149–1156.
- 14.
Pedrizzetti G, La Canna G, Alfieri O, Tonti G. The vortex: An early predictor of cardiovascular outcome? Nat Rev Cardiol 2014; 11: 545–553.
- 15.
Zoghbi WA, Adams D, Bonow RO, Enriquez-Sarano M, Foster E, Grayburn PA, et al. Recommendations for noninvasive evaluation of native valvular regurgitation: A report from the American Society of Echocardiography Developed in Collaboration with the Society for Cardiovascular Magnetic Resonance. J Am Soc Echocardiogr 2017; 30: 303–371.
- 16.
Itatani K, Okada T, Uejima T, Tanaka T, Ono M, Miyaji K, et al. Intraventricular flow velocity vector visualization based on the continuity equation and measurements of vorticity and wall shear stress. Jpn J Appl Physics 2013; 52: 07HF16.
- 17.
Tanaka T, Asami R, Kawabata K, Itatani EK, Uejima T, Nishiyama T, et al. Intracardiac VFM technique using diagnostic ultrasound system. Hitachi Rev 2015; 64: 488–492.
- 18.
Asami R, Tanaka T, Kawabata K, Hashiba K, Okada T, Nishiyama T. Accuracy and limitations of vector flow mapping: Left ventricular phantom validation using stereo particle image velocimetory. J Echocardiogr 2017; 15: 57–66.
- 19.
Elbaz MS, van der Geest RJ, Calkoen EE, de Roos A, Lelieveldt BP, Roest AA, et al. Assessment of viscous energy loss and the association with three-dimensional vortex ring formation in left ventricular inflow: In vivo evaluation using four-dimensional flow MRI. Magn Reson Med 2017; 77: 794–805.
- 20.
Delgado V, Tops LF, Schuijf JD, de Roos A, Brugada J, Schalij MJ, et al. Assessment of mitral valve anatomy and geometry with multislice computed tomography. JACC Cardiovasc Imaging 2009; 2: 556–565.
- 21.
Michler RE, Smith PK, Parides MK, Ailawadi G, Thourani V, Moskowitz AJ, et al. Two-year outcomes of surgical treatment of moderate ischemic mitral regurgitation. N Engl J Med 2016; 374: 1932–1941.
- 22.
Rossi A, Dini FL, Faggiano P, Agricola E, Cicoira M, Frattini S, et al. Independent prognostic value of functional mitral regurgitation in patients with heart failure: A quantitative analysis of 1256 patients with ischaemic and non-ischaemic dilated cardiomyopathy. Heart 2011; 97: 1675–1680.
- 23.
Dayan V, Soca G, Cura L, Mestres CA. Similar survival after mitral valve replacement or repair for ischemic mitral regurgitation: A meta-analysis. Ann Thorac Surg 2014; 97: 758–765.
- 24.
Goldstein D, Moskowitz AJ, Gelijns AC, Ailawadi G, Parides MK, Perrault LP, et al. Two-year outcomes of surgical treatment of severe ischemic mitral regurgitation. N Engl J Med 2016; 374: 344–353.
- 25.
Trento A, Goland S, De Robertis MA, Czer LS. COUNTERPOINT: Efficacy of adding mitral valve restrictive annuloplasty to coronary artery bypass grafting in patients with moderate ischemic mitral valve regurgitation. J Thorac Cardiovasc Surg 2009; 138: 286–288.
- 26.
Fattouch K, Guccione F, Sampognaro R, Panzarella G, Corrado E, Navarra E, et al. POINT: Efficacy of adding mitral valve restrictive annuloplasty to coronary artery bypass grafting in patients with moderate ischemic mitral valve regurgitation: A randomized trial. J Thorac Cardiovasc Surg 2009; 138: 278–285.