Abstract
Background:
We evaluated the 2-year clinical outcomes of deferred lesions with discordant results between resting and hyperemic pressure-derived physiologic indices, including resting distal to aortic coronary pressure (resting Pd/Pa), instantaneous wave-free ratio (iFR), resting full-cycle ratio (RFR), diastolic pressure ratio (dPR), and fractional flow reserve (FFR).
Methods and Results:
The 2-year clinical outcomes of 1,024 vessels (435 patients) with available resting Pd/Pa, iFR, RFR, dPR, and FFR data were analyzed according to a 4-group classification using known cutoff values (resting Pd/Pa ≤0.92, iFR/RFR/dPR ≤0.89, and FFR ≤0.80): Group 1 (concordant normal), Group 2 (high resting index and low FFR), Group 3 (low resting index and high FFR), and Group 4 (concordance abnormal). The primary outcome was vessel-oriented composite outcomes (VOCO) in deferred vessels at 2 years. In the comparison of VOCO risk among 4 groups classified according to FFR and 4 resting physiologic indices, Group 4 consistently showed a significantly higher risk of VOCO than Group 1. Comparison of VOCO risk among 4 groups classified according to iFR and other resting physiologic indices also showed the same results. The presence of discordance, either between hyperemic and resting indices or among resting indices, was not an independent predictor for VOCO.
Conclusions:
Discordant results between resting physiologic indices and FFR and among the resting indices were not associated with increased risk of VOCO in deferred lesions.
Based on the low diagnostic yield and limited predictability of noninvasive tests for identifying functionally significant epicardial coronary stenosis,1
invasive physiologic indices have become an essential tool in the cardiac catheterization laboratory to guide proper clinical decision-making for patients with coronary artery disease.2
To date, fractional flow reserve (FFR) and instantaneous wave-free ratio (iFR) are recommended by guidelines as reference invasive physiologic indices based on large clinical trials.3–7
Editorial p 2203
Although FFR or iFR-guided treatment has proven clinical relevance based on clinical outcome trials, previous studies consistently show that the incidence of discordance between FFR and iFR is ≈10–30% of interrogated lesions. Because the 2 pressure-derived indices are measured under different conditions (i.e., hyperemia and resting), it may be anticipated to have discordant results in some patients.2
Previous studies suggested that the discordance between iFR and FFR originates from a complex interaction of clinical characteristics, severity or geometry of the epicardial coronary stenosis, and difference in resting and hyperemic coronary physiologic behaviors.8–11
Nevertheless, the more important issue in daily practice is whether clinical outcomes of lesions with discordance between resting and hyperemic pressure-derived indices are different from those with concordant results.
A previous study that evaluated the clinical outcomes of deferred lesions showed that only lesions with abnormal results in both FFR and iFR showed a significantly increased risk of major adverse cardiac events (MACE) at 2 years.12
The recent development of new resting pressure-derived indices, such as resting full-cycle ratio (RFR) and diastolic pressure ratio (dPR),13–15
further increase the demand for evidence regarding clinical outcomes of lesions with discordance results between resting and hyperemic physiologic indices or between iFR and other resting physiologic indices.
Because all resting physiologic indices have similar diagnostic performance in comparison with FFR, the prognosis of lesions with discordant results between FFR and resting physiologic indices might not be different from that between FFR and iFR. As these indices are used to make clinical decisions for revascularization vs. deferral of revascularization in daily clinical practice, understanding the prognosis of lesions with discordant results between the 2 indices is clinically relevant. However, this hypothesis has not been tested. The purpose of the current study was to evaluate whether deferred lesions with discordant results between FFR and resting physiologic indices or between iFR and other resting physiologic indices have increased risk of vessel-related events.
Methods
Study Design and Patient Population
The study population was derived from the 3V FFR-FRIENDS study (3-vessel FFR for the assessment of total stenosis burden and its clinical impact in patients with coronary artery disease, NCT01621438)16
and the 13N-ammonia PET registry.10,17,18
In both studies, patients with depressed left ventricular systolic function (ejection fraction <35%), acute ST-elevation myocardial infarction (MI) within 72 h, previous coronary artery bypass graft surgery (CABG), chronic renal disease, abnormal epicardial coronary flow (TIMI flow <3) or planned CABG after diagnostic angiography were excluded.
Among the total population, 1,024 vessels (435 patients) with available resting distal to aortic coronary pressure (resting Pd/Pa), iFR, RFR, dPR, and FFR were included in this study. The enrolled patients were included in other published studies.10,12,15–19
The study protocol was approved by the institutional review board or ethics committee at each participating center and all patients provided written informed consent.
Angiographic Analysis and Quantitative Coronary Angiography
Coronary angiography was performed using standard techniques. Angiographic views were obtained following the administration of intracoronary nitrate (100 or 200 µg). All angiograms were analyzed at a core laboratory (Seoul National University Hospital) blinded to other data. Quantitative coronary angiography was performed in optimal projections with validated software (CAAS II, Pie Medical System, Maastricht, The Netherlands). Minimal lumen diameter, reference vessel size, and lesion length were measured, and percent diameter stenosis (%DS) was calculated.
Coronary Physiologic Measurements and Derivation of Resting Physiologic Indices
All coronary physiologic measurements were obtained after diagnostic angiography as previously described.20
Briefly, a 5–7Fr guide catheter was used to engage the coronary artery. The pressure-temperature sensor guide wire (Abbott Vascular, Santa Clara, CA, USA) was zeroed and equalized to aortic pressure, and then positioned at the distal segment of the target vessel. Intracoronary nitrate (100 or 200 µg) was administered before each set of physiologic measurements. Resting Pd/Pa was calculated as the ratio of mean distal coronary artery pressure to mean aortic pressure in the resting state. The iFR was calculated using automated algorithms acting over the wave-free period over a minimum of 5 beats as previously described.10,19,21
RFR was calculated from each individual waveform using a fully automated off-line software algorithm (CoroLab; Coroventis Research AB, Uppsala, Sweden) following standardization of the pressure sampling rate to 100 Hz, as previously described.22
RFR was defined as the point at which the ratio of Pd and Pa was lowest during the entire cardiac cycle22
and averaged within 5 consecutive heart cycles. Among the total 1,024 pressure tracings, RFR calculation was not possible in 11 vessels because of insufficient quality of the resting pressure tracings. dPR was also calculated from each individual waveform as an average Pd/Pa over the entire period of diastole as previously described.14
Continuous infusion of adenosine (140 µg/kg/min) was used to induce hyperemia. Hyperemic proximal aortic pressure (Pa) and distal arterial pressure (Pd) were obtained, and FFR was calculated as the lowest average of 3 consecutive beats during adenosine infusion. After measurements, the pressure wire was pulled back to the guide catheter and checked for the presence of pressure drift. All pressure readings were collected and validated at the core laboratory, and the calculation of RFR and dPR from pressure tracing data was also performed at the core laboratory in a blinded fashion (Samsung Medical Center, Seoul, Korea).
Cutoff Values of Physiologic Indices and Lesion Classifications
In order to compare clinical outcomes according to high or low resting pressure-derived indices, the cutoff values of ≤0.92,19,23
≤0.89,5,6
≤0.89,22
≤0.8914
or ≤0.804
were used for resting Pd/Pa, iFR, RFR, dPR, or FFR, respectively. Using these values, all lesions were classified into 4 groups: Group 1 (concordant normal; high resting index and high FFR), Group 2 (high resting index but low FFR), Group 3 (low resting index but high FFR), and Group 4 (concordant abnormal; low resting index and low FFR). The discordance between iFR and other resting pressure-derived indices was similarly classified according to the value of each resting pressure-derived index.
Patient Follow-up, Outcome Measurements, and Adjudication of Clinical Events
Clinical data were obtained at outpatient clinic visits or by telephone contact when needed. An independent clinical events committee, whose members were unaware of the clinical, angiographic, and physiologic data, adjudicated all events. The primary outcome was vessel-oriented composite outcome (VOCO) at 2 years among deferred vessels, including cardiac death, target vessel-related MI and target vessel-related ischemia-driven revascularization. All event records were reviewed to assess vessel-related clinical events and were defined according to the Academic Research Consortium, including the addendum to the definition of MI. All deaths were considered cardiac unless an undisputable noncardiac cause was present. Periprocedural MI was not included as a clinical event. Ischemia-driven revascularization was defined as a revascularization procedure with at least one of the following: (1) recurrence of angina; (2) positive noninvasive test; and (3) positive invasive physiologic test.
Statistical Analysis
Categorical variables are presented as numbers and relative frequencies (percentages), and continuous variables are presented as means and standard deviations or median with interquartile range (IQR) according to their distribution, which was checked by the Kolmogorov-Smirnov test. Data were analyzed on a per-patient basis for clinical characteristics and on a per-vessel basis for comparison of lesion characteristics, physiologic indices, and vessel-related clinical outcomes. For per-vessel analyses, a generalized estimating equation was used to adjust intra-subject variability among vessels from the same patient. Estimated means and 95% confidence interval (CI) are presented as summary statistics. No post-hoc adjustment was performed.
Comparisons of per-vessel clinical outcomes were performed in 3 different ways. First, comparison of clinical outcomes was performed according to each physiologic index using their cutoff value (lesions with below cutoff value vs. lesions with above cutoff value of physiologic index). Second, there was comparison of clinical outcomes among the 4 groups, classified according to resting and hyperemic physiologic indices (FFR and iFR, FFR and RFR, FFR and dPR, or FFR and resting Pd/Pa). Third, clinical outcomes were also compared among the 4 groups, classified according to iFR and other resting physiologic indices (iFR and RFR, iFR and dPR, or iFR and resting Pd/Pa). Clinical outcome analysis was primarily performed among deferred vessels. However, in comparison of the risk of VOCO among discordance groups (Group 2 or 3) between revascularized and deferred vessels, total vessel data (n=1,024) was used. In order to compare per-vessel clinical outcome, event rates were calculated based on Kaplan-Meier censoring estimates, and the log-rank test was used to compare survival curves between groups. Those clinical event data were compared using a marginal Cox proportional hazards regression model to calculate hazard ratio (HR) and 95% CI in order to adjust for intra-subject correlations among the interrogated vessels.24
The assumption of proportionality was assessed graphically by log-minus-log plot, and Cox proportional hazard models for all clinical outcomes satisfied the proportional hazards assumption. In order to evaluate the independent association between Group 4 (concordant abnormal) and the risk of VOCO, a multivariable marginal Cox model with penalized methods was used to identify independent predictors of VOCO. The discriminant function of the multivariable model was presented with Harrell’s c-statistics with 95% CI. All probability values were two-sided and P<0.05 was considered statistically significant.
Results
Patient and Lesion Characteristics According to Physiologic Indices
Most patients presented with stable angina (87.1%) and showed intermediate stenosis with mean angiographic %DS of 44.3±17.5% and mean FFR of 0.87±0.11 (Supplementary Table 1). According to the binary cutoff values of FFR, iFR, RFR, dPR, and resting Pd/Pa, the lesions with below cutoff values consistently showed significantly worse lesion severity than those with above cutoff values (Table 1).
Table 1.
General Characteristics of Vessels According to Invasive Physiologic Indices
Total vessels
(n=1,024) |
High FFR |
Low FFR |
P value† |
High iFR |
Low iFR |
P value‡ |
High RFR |
Low RFR |
P value§ |
High dPR |
Low dPR |
P value* |
High PdPa |
Low PdPa |
P value¶ |
775/1,024
(75.7%) |
249/1,024
(24.3%) |
853/1,024
(83.3%) |
171/1,024
(16.7%) |
781/1,024
(76.3%) |
232/1,024
(22.7%) |
835/1,024
(81.5%) |
189/1,024
(18.5%) |
835/1,024
(81.5%) |
189/1,024
(18.5%) |
| Measured vessel location |
|
|
<0.001 |
|
|
<0.001 |
|
|
<0.001 |
|
|
<0.001 |
|
|
<0.001 |
| Left anterior descending artery |
211 (27.2%) |
176 (70.7%) |
|
259 (30.4%) |
128 (74.9%) |
|
213 (27.3%) |
170 (73.3%) |
|
243 (29.1%) |
144 (76.2%) |
|
232 (27.8%) |
155 (82.0%) |
|
| Left circumflex artery |
296 (38.2%) |
43 (17.3%) |
|
310 (36.3%) |
29 (17.0%) |
|
296 (37.9%) |
40 (17.2%) |
|
310 (37.1%) |
29 (15.3%) |
|
320 (38.3%) |
19 (10.1%) |
|
| Right coronary artery |
268 (34.6%) |
30 (12.0%) |
|
284 (33.3%) |
14 (8.2%) |
|
272 (34.8%) |
22 (9.5%) |
|
282 (33.8%) |
16 (8.5%) |
|
283 (33.9%) |
15 (7.9%) |
|
| Quantitative coronary angiography |
| Reference diameter, mm |
3.03±0.60 |
2.80±0.50 |
<0.001 |
3.01±0.59 |
2.78±0.53 |
<0.001 |
3.03±0.60 |
2.79±0.51 |
<0.001 |
3.02±0.60 |
2.79±0.52 |
<0.001 |
3.01±0.60 |
2.82±0.50 |
<0.001 |
| Minimum lumen diameter (mm) |
1.85±0.66 |
1.11±0.43 |
<0.001 |
1.80±0.67 |
1.05±0.41 |
<0.001 |
1.82±0.67 |
1.17±0.49 |
<0.001 |
1.80±0.66 |
1.09±0.45 |
<0.001 |
1.79±0.67 |
1.13±0.45 |
<0.001 |
| Diameter stenosis, % |
39.5±15.4 |
59.3±14.9 |
<0.001 |
41.0±16.0 |
60.9±15.2 |
<0.001 |
40.6±15.9 |
56.9±16.5 |
<0.001 |
40.8±15.9 |
59.8±15.9 |
<0.001 |
41.1±16.1 |
58.5±16.1 |
<0.001 |
| Lesion length, mm |
9.0±6.2 |
16.3±10.8 |
<0.001 |
9.6±6.8 |
16.8±11.3 |
<0.001 |
9.4±6.7 |
15.4±10.7 |
<0.001 |
9.5±6.7 |
16.5±11.2 |
<0.001 |
9.5±6.6 |
16.8±11.3 |
<0.001 |
| Physiologic parameters |
| Resting Pd/Pa |
0.98±0.03 |
0.88±0.10 |
<0.001 |
0.98±0.03 |
0.85±0.10 |
<0.001 |
0.98±0.03 |
0.87±0.09 |
<0.001 |
0.98±0.03 |
0.86±0.10 |
<0.001 |
0.98±0.03 |
0.86±0.10 |
<0.001 |
| 0.99 (0.96–1.00) |
0.91 (0.87–0.94) |
|
0.99 (0.95–1.00) |
0.84 (0.88–0.91) |
|
0.99 (0.96–1.00) |
0.90 (0.86–0.92) |
|
0.99 (0.96–1.00) |
0.89 (0.85–0.91) |
|
0.99 (0.96–1.00) |
0.89 (0.85–0.91) |
|
| iFR |
0.97±0.04 |
0.83±0.14 |
<0.001 |
0.97±0.04 |
0.78±0.14 |
<0.001 |
0.97±0.03 |
0.82±0.13 |
<0.001 |
0.97±0.03 |
0.79±0.13 |
<0.001 |
0.97±0.04 |
0.79±0.14 |
<0.001 |
| 0.99 (0.95–1.00) |
0.87 (0.79–0.92) |
|
0.99 (0.94–1.00) |
0.83 (0.76–0.87) |
|
0.99 (0.95–1.00) |
0.86 (0.79–0.90) |
|
0.99 (0.95–1.00) |
0.84 (0.77–0.87) |
|
0.99 (0.95–1.00) |
0.84 (0.77–0.88) |
|
| RFR |
0.96±0.04 |
0.82±0.13 |
<0.001 |
0.95±0.04 |
0.77±0.13 |
<0.001 |
0.96±0.03 |
0.80±0.12 |
<0.001 |
0.96±0.04 |
0.78±0.13 |
<0.001 |
0.96±0.04 |
0.78±0.13 |
<0.001 |
| 0.97 (0.93–0.99) |
0.86 (0.78–0.90) |
|
0.96 (0.93–0.99) |
0.82 (0.75–0.86) |
|
0.97 (0.93–0.99) |
0.85 (0.77–0.88) |
|
0.96 (0.93–0.99) |
0.82 (0.76–0.86) |
|
0.96 (0.93–0.99) |
0.83 (0.76–0.87) |
|
| dPR |
0.97±0.04 |
0.83±0.13 |
<0.001 |
0.97±0.04 |
0.78±0.13 |
<0.001 |
0.97±0.03 |
0.82±0.12 |
<0.001 |
0.97±0.04 |
0.79±0.13 |
<0.001 |
0.97±0.04 |
0.80±0.13 |
<0.001 |
| 0.98 (0.94–1.00) |
0.87 (0.80–0.91) |
|
0.98 (0.94–1.00) |
0.84 (0.76–0.86) |
|
0.98 (0.94–1.00) |
0.86 (0.79–0.89) |
|
0.98 (0.94–1.00) |
0.84 (0.77–0.87) |
|
0.98 (0.94–1.00) |
0.84 (0.77–0.88) |
|
| FFR |
0.92±0.06 |
0.70±0.09 |
<0.001 |
0.90±0.08 |
0.69±0.11 |
<0.001 |
0.91±0.07 |
0.73±0.11 |
<0.001 |
0.90±0.07 |
0.71±0.11 |
<0.001 |
0.90±0.07 |
0.70±0.11 |
<0.001 |
| 0.92 (0.87–0.96) |
0.73 (0.67–0.78) |
|
0.91 (0.85–0.96) |
0.71 (0.64–0.76) |
|
0.92 (0.86–0.96) |
0.74 (0.66–0.81) |
|
0.92 (0.85–0.96) |
0.72 (0.65–0.78) |
|
0.92 (0.85–0.96) |
0.72 (0.65–0.78) |
|
| Deferred vessels (n=864) |
High FFR |
Low FFR |
P value† |
High iFR |
Low iFR |
P value‡ |
High RFR |
Low RFR |
P value§ |
High dPR |
Low dPR |
P value* |
High PdPa |
Low PdPa |
P value¶ |
| 756/864 (87.5%) |
108/864 (12.5%) |
789/864 (91.3%) |
75/864 (8.7%) |
729/864 (84.4%) |
127/864 (14.7%) |
769/864 (89.0%) |
95/864 (11.0%) |
777/864 (89.9%) |
87/864 (10.1%) |
| Diameter stenosis, % |
39.3±15.4 |
52.6±14.8 |
<0.001 |
39.7±15.4 |
54.5±15.1 |
<0.001 |
39.4±15.5 |
49.9±15.6 |
<0.001 |
39.6±15.5 |
51.9±15.4 |
<0.001 |
39.9±15.7 |
50.1±15.2 |
<0.001 |
| Resting Pd/Pa |
0.98±0.03 |
0.91±0.06 |
<0.001 |
0.98±0.03 |
0.89±0.05 |
<0.001 |
0.98±0.02 |
0.91±0.05 |
<0.001 |
0.98±0.03 |
0.90±0.05 |
<0.001 |
0.98±0.03 |
0.89±0.05 |
<0.001 |
| 0.99 (0.96–1.00) |
0.92 (0.88–0.95) |
|
0.99 (0.96–1.00) |
0.89 (0.87–0.91) |
|
0.99 (0.96–1.00) |
0.92 (0.89–0.93) |
|
0.99 (0.96–1.00) |
0.90 (0.88–0.93) |
|
0.99 (0.96–1.00) |
0.90 (0.87–0.92) |
|
| iFR |
0.98±0.04 |
0.87±0.09 |
<0.001 |
0.98±0.03 |
0.82±0.07 |
<0.001 |
0.98±0.03 |
0.86±0.07 |
<0.001 |
0.98±0.04 |
0.85±0.08 |
<0.001 |
0.98±0.04 |
0.84±0.08 |
<0.001 |
| 0.99 (0.95–1.00) |
0.89 (0.82–0.94) |
|
0.99 (0.95–1.00) |
0.85 (0.80–0.87) |
|
0.99 (0.95–1.00) |
0.88 (0.84–0.91) |
|
0.99 (0.95–1.00) |
0.86 (0.82–0.89) |
|
0.99 (0.95–1.00) |
0.86 (0.81–0.90) |
|
| RFR |
0.96±0.04 |
0.85±0.09 |
<0.001 |
0.96±0.04 |
0.81±0.08 |
<0.001 |
0.96±0.03 |
0.84±0.07 |
<0.001 |
0.96±0.04 |
0.83±0.08 |
<0.001 |
0.96±0.04 |
0.82±0.08 |
<0.001 |
| 0.97 (0.93–0.99) |
0.87 (0.82–0.92) |
|
0.97 (0.93–0.99) |
0.83 (0.78–0.86) |
|
0.97 (0.94–0.99) |
0.86 (0.82–0.89) |
|
0.97 (0.93–0.99) |
0.85 (0.80–0.88) |
|
0.97 (0.93–0.99) |
0.85 (0.79–0.87) |
|
| dPR |
0.97±0.04 |
0.87±0.08 |
<0.001 |
0.97±0.04 |
0.82±0.07 |
<0.001 |
0.97±0.05 |
0.86±0.06 |
<0.001 |
0.97±0.03 |
0.82±0.09 |
<0.001 |
0.97±0.04 |
0.84±0.07 |
<0.001 |
| 0.98 (0.94–1.00) |
0.89 (0.84–0.92) |
|
0.98 (0.94–1.00) |
0.84 (0.80–0.87) |
|
0.98 (0.95–1.00) |
0.87 (0.84–0.90) |
|
0.98 (0.94–1.00) |
0.85 (0.81–0.88) |
|
0.98 (0.94–1.00) |
0.85 (0.80–0.89) |
|
| FFR |
0.92±0.06 |
0.75±0.06 |
<0.001 |
0.91±0.07 |
0.75±0.08 |
<0.001 |
0.92±0.06 |
0.79±0.08 |
<0.001 |
0.91±0.07 |
0.77±0.08 |
<0.001 |
0.91±0.06 |
0.76±0.08 |
<0.001 |
| 0.93 (0.87–0.96) |
0.77 (0.72–0.79) |
|
0.92 (0.86–0.96) |
0.75 (0.70–0.81) |
|
0.93 (0.87–0.97) |
0.80 (0.74–0.84) |
|
0.92 (0.86–0.96) |
0.78 (0.73–0.83) |
|
0.92 (0.86–0.96) |
0.77 (0.71–0.81) |
|
Values are mean±SD, median (interquartile range, 25–75th), estimated mean (95% confidence interval) (per-vessel analysis), or n (%). Generalized estimating equation model or maximum likelihood χ2 tests used for overall and between-group comparisons in per-vessel analysis. †P values for the comparison of variables between high and low FFR groups. ‡P values for the comparison of variables between high and low iFR groups. §P values for the comparison of variables between high and low RFR groups. *P values for the comparison of variables between high and low dPR groups. ¶P values for the comparison of variables between high and low resting Pd/Pa groups. dPR, diastolic pressure ratio; FFR, fractional flow reserve; iFR, instantaneous wave-free ratio; PdPa, resting Pd/Pa; RFR, resting full-cycle ratio.
When the lesions were classified according to resting and hyperemic indices, the rate of discordance between resting physiologic indices and FFR was ≈11–13%. Numerical differences of FFR with resting physiologic indices were 0.07±0.07, 0.06±0.06, 0.07±0.06, and 0.09±0.07, respectively, for iFR, RFR, dPR, and resting Pd/Pa. In 2 types of discordance (Group 2 with high resting and low FFR and Group 3 with low resting and high FFR), the prevalence of Group 2 discordance was consistently higher than Group 3 discordance (Figure 1). In the comparison of baseline clinical characteristics, Group 2 consistently showed youngest age and male predominance, and Group 3 showed the highest proportion of diabetes mellitus. In comparison of angiographic stenosis severity, Group 2 consistently showed higher %DS, compared with Group 3. Group 4 (low resting index and low FFR) showed the highest stenosis severity (Supplementary Tables 2–5).
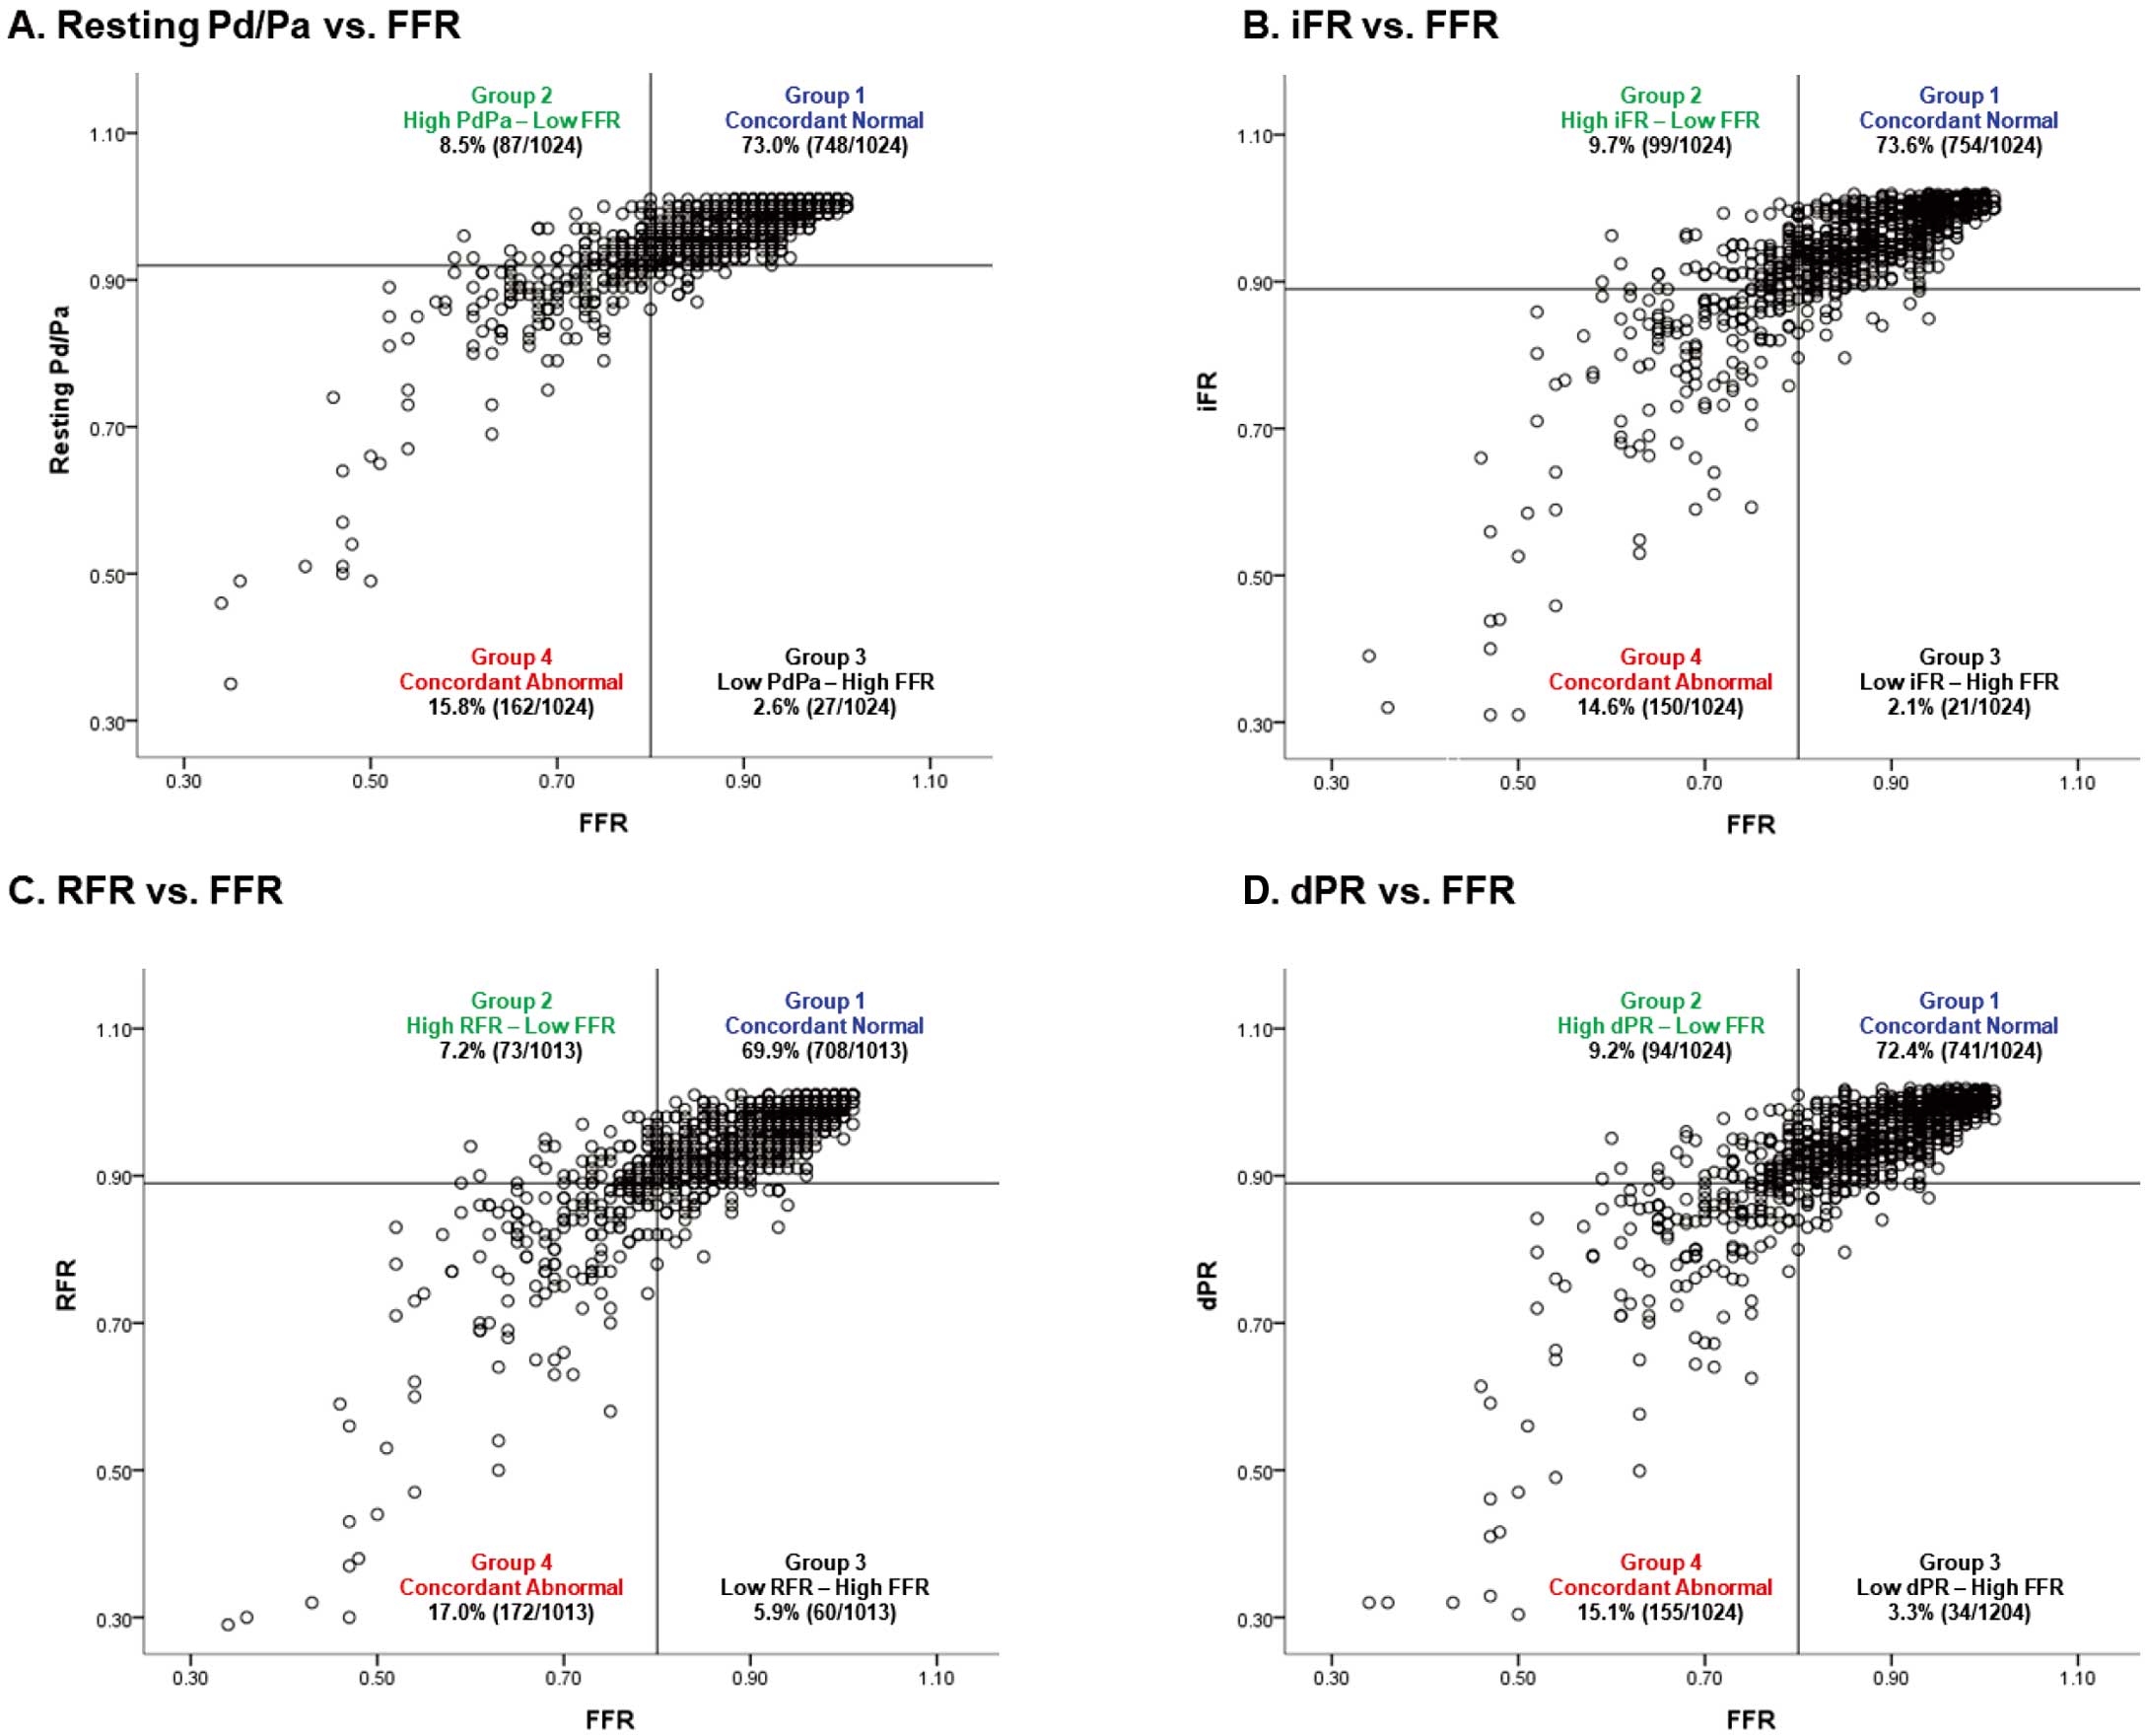
Table 2
and
Figure 2
present the comparison of clinical outcomes according to the 4-group classification by resting physiologic indices and FFR among the deferred lesions. Only Group 4 showed a significantly increased risk of VOCO and ischemia-driven revascularization compared with the other groups (Table 2, Figure 2). In the multivariable model, only Group 4 was independently associated with the risk of VOCO (Table 3). The risk of VOCO was also highest in Group 4 among the total vessels (Supplementary Table 6). In the discordance groups (Groups 2 and 3) of the total vessels, the revascularized vessels showed a numerically higher incidence of VOCO than did the deferred vessels. However, those differences were not statistically significant (Supplementary Figure).
Table 2.
Clinical Outcomes of Vessels According to Classification by Hyperemic and Resting Physiologic Indices
| FFR and iFR |
Group 1
(FFR >0.80 and
iFR >0.89) |
Group 2
(FFR ≤0.80 and
iFR >0.89) |
Group 3
(FFR >0.80 and
iFR ≤0.89) |
Group 4
(FFR ≤0.80 and
iFR ≤0.89) |
P value |
| Per-vessel analysis (n=864) |
735 (85.1%) |
54 (6.3%) |
21 (2.4%) |
54 (6.3%) |
|
| Cardiac death |
0.8% (6) |
0.0% (0) |
5.3% (1) |
0.0% (0) |
0.164 |
| Myocardial infarction |
0.8% (5) |
0.0% (0) |
0.0% (0) |
1.9% (1) |
0.691 |
| Ischemia-driven revascularization |
1.3% (4) |
1.9% (1) |
0.0% (0) |
11.1% (6) |
<0.001 |
| VOCO† |
2.2% (10) |
1.9% (1) |
5.3% (1) |
11.1% (6) |
<0.001 |
| FFR and RFR |
Group 1
(FFR >0.80 and
RFR >0.89) |
Group 2
(FFR ≤0.80 and
RFR >0.89) |
Group 3
(FFR >0.80 and
RFR ≤0.89) |
Group 4
(FFR ≤0.80 and
RFR ≤0.89) |
P value |
| Per-vessel analysis (n=856) |
690 (80.6%) |
39 (4.5%) |
59 (6.9%) |
68 (7.9%) |
|
| Cardiac death |
0.9% (6) |
0.0% (0) |
1.8% (1) |
0.0% (0) |
0.689 |
| Myocardial infarction |
0.9% (5) |
0.0% (0) |
0.0% (0) |
1.5% (1) |
0.756 |
| Ischemia-driven revascularization |
1.3% (3) |
2.6% (1) |
1.8% (1) |
8.8% (6) |
<0.001 |
| VOCO† |
2.2% (9) |
2.6% (1) |
3.5% (2) |
8.8% (6) |
0.001 |
| FFR and dPR |
Group 1
(FFR >0.80 and
dPR >0.89) |
Group 2
(FFR ≤0.80 and
dPR >0.89) |
Group 3
(FFR >0.80 and
dPR ≤0.89) |
Group 4
(FFR ≤0.80 and
dPR ≤0.89) |
P value |
| Per-vessel analysis (n=864) |
717 (83.0%) |
52 (6.0%) |
39 (4.5%) |
56 (6.5%) |
|
| Cardiac death |
0.8% (6) |
0.0% (0) |
2.7% (1) |
0.0% (0) |
0.492 |
| Myocardial infarction |
0.8% (5) |
0.0% (0) |
0.0% (0) |
1.8% (1) |
0.677 |
| Ischemia-driven revascularization |
1.4% (4) |
1.9% (1) |
0.0% (0) |
10.7% (6) |
<0.001 |
| VOCO† |
2.3% (10) |
1.9% (1) |
2.7% (1) |
10.7% (6) |
<0.001 |
| FFR and PdPa |
Group 1
(FFR >0.80 and
PdPa >0.92) |
Group 2
(FFR ≤0.80 and
PdPa >0.92) |
Group 3
(FFR >0.80 and
PdPa ≤0.92) |
Group 4
(FFR ≤0.80 and
PdPa ≤0.92) |
P value |
| Per-vessel analysis (n=864) |
729 (84.4%) |
48 (5.6%) |
27 (3.1%) |
60 (6.9%) |
|
| Cardiac death |
0.8% (6) |
0.0% (0) |
3.9% (1) |
0.0% (0) |
0.299 |
| Myocardial infarction |
0.8% (5) |
0.0% (0) |
0.0% (0) |
1.7% (1) |
0.745 |
| Ischemia-driven revascularization |
1.4% (4) |
2.1% (1) |
0.0% (0) |
10.0% (6) |
<0.001 |
| VOCO† |
2.2% (10) |
2.1% (1) |
3.9% (1) |
10.0% (6) |
<0.001 |
The cumulative incidence of clinical outcomes presented as Kaplan-Meier estimates during median follow-up of 729.0 (699.0–747.0) days. P values are log-rank or Breslow P value in survival analysis. †VOCO included cardiac death, vessel-related myocardial infarction, and vessel-related ischemia-driven revascularization. dPR, diastolic pressure ratio; iFR, instantaneous wave-free ratio; PdPa, resting Pd/Pa; RFR, resting full-cycle ratio; VOCO, vessel-oriented composite outcomes.
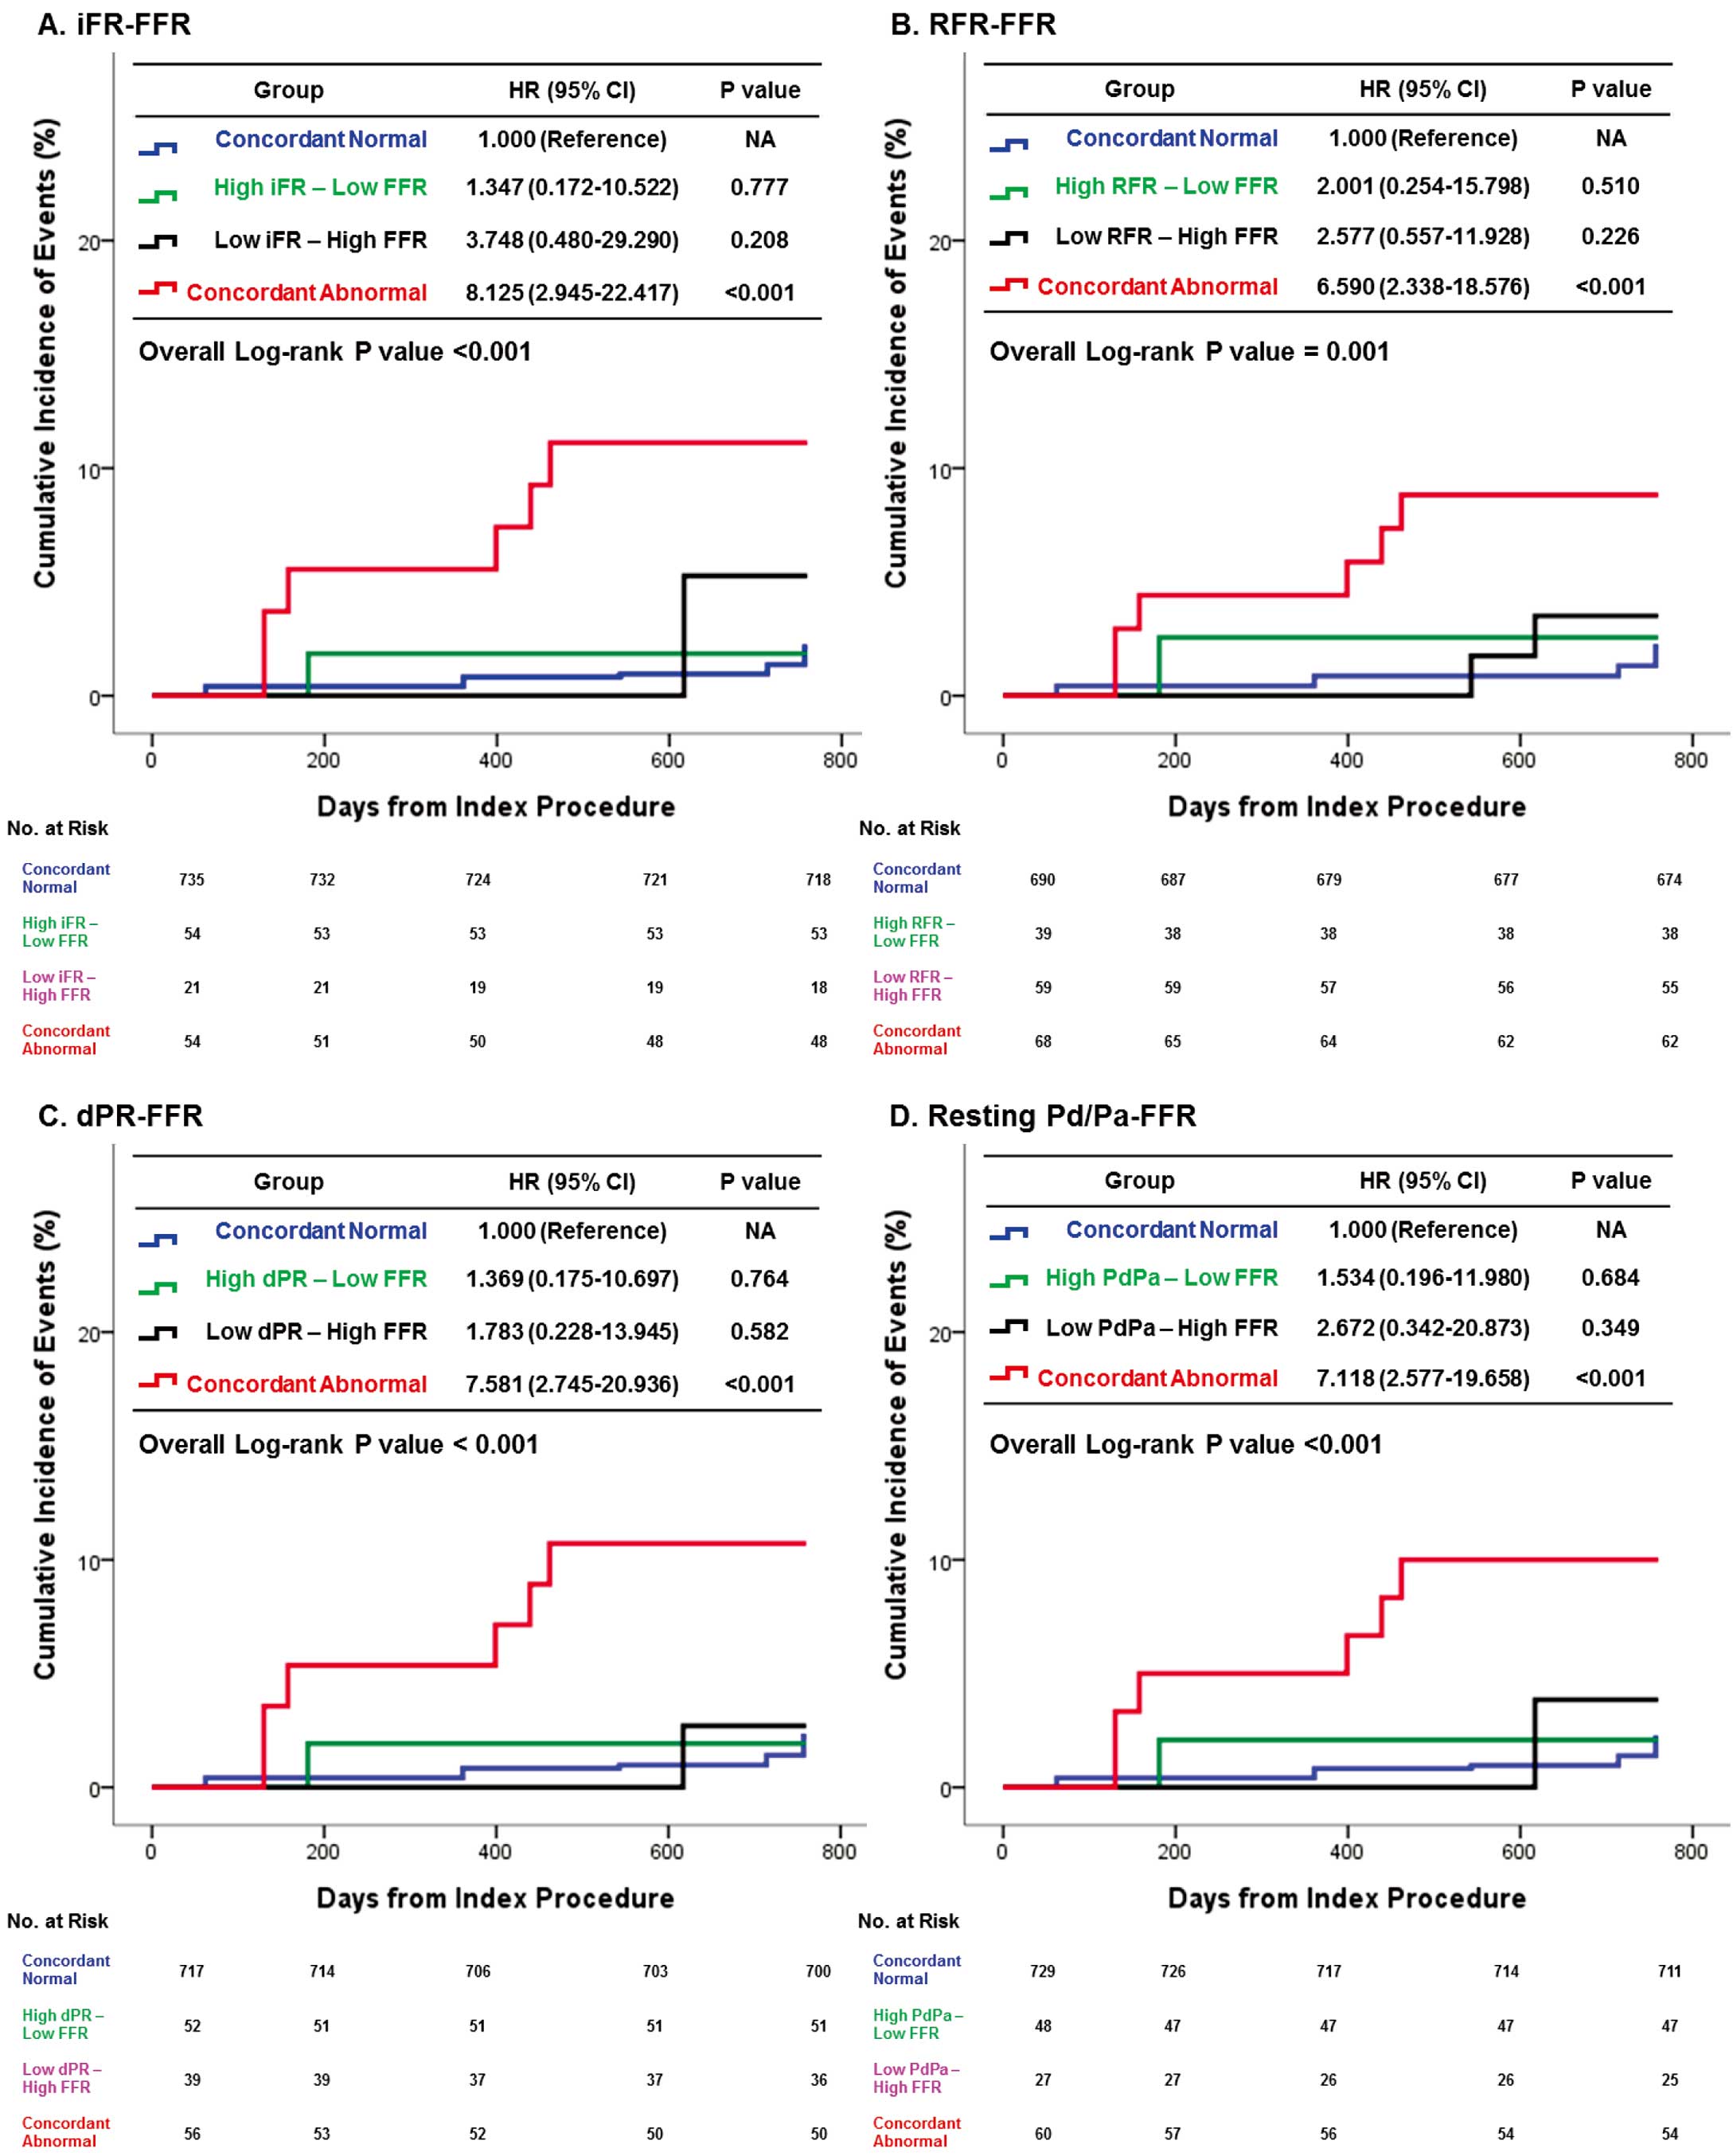
Table 3.
Independent Predictors of VOCO According to Classification by Hyperemic and Resting Physiologic Indices
| |
iFR-FFR |
RFR-FFR |
dPR-FFR |
Resting Pd/Pa-FFR |
| HR (95% CI) |
P value |
HR (95% CI) |
P value |
HR (95% CI) |
P value |
HR (95% CI) |
P value |
| Group 4 (concordant abnormal) |
4.85
(1.56–15.01) |
0.006 |
3.86
(1.23–12.13) |
0.021 |
4.52
(1.46–14.05) |
0.009 |
4.23
(1.39–12.94) |
0.011 |
Group 3 (low resting index and
high FFR) |
4.70
(0.71–31.22) |
0.109 |
3.17
(0.70–14.36) |
0.135 |
2.48
(0.39–15.93) |
0.339 |
3.65
(0.56–23.75) |
0.175 |
Group 2 (high resting index and
low FFR) |
1.59
(0.24–10.62) |
0.631 |
2.41
(0.36–16.36) |
0.367 |
1.46
(0.22–9.59) |
0.695 |
1.59
(0.24–10.62) |
0.631 |
| Age |
1.01
(0.95–1.07) |
0.652 |
1.01
(0.95–1.07) |
0.705 |
1.01
(0.95–1.07) |
0.707 |
1.01
(0.96–1.07) |
0.652 |
| Male |
1.95
(0.46–8.34) |
0.366 |
1.96
(0.45–8.55) |
0.369 |
1.99
(0.46–8.59) |
0.354 |
1.84
(0.43–7.92) |
0.414 |
| Hypertension |
1.53
(0.47–4.99) |
0.478 |
1.69
(0.53–5.38) |
0.379 |
1.68
(0.52–5.41) |
0.386 |
1.51
(0.47–4.90) |
0.491 |
| Current smoking |
2.04
(0.71–5.93) |
0.188 |
1.98
(0.68–5.81) |
0.211 |
1.94
(0.67–5.65) |
0.224 |
1.97
(0.67–5.75) |
0.216 |
| Previous myocardial infarction |
1.37
(0.23–8.26) |
0.731 |
1.52
(0.25–9.08) |
0.649 |
1.43
(0.24–8.53) |
0.698 |
1.49
(0.25–8.99) |
0.666 |
| Diabetes mellitus |
1.29
(0.49–3.41) |
0.607 |
1.34
(0.51–3.51) |
0.556 |
1.35
(0.52–3.54) |
0.538 |
1.28
(0.48–3.41) |
0.624 |
| SYNTAX score |
1.05
(0.99–1.11) |
0.103 |
1.05
(0.99–1.11) |
0.073 |
1.05
(0.99–1.11) |
0.088 |
1.05
(0.99–1.11) |
0.072 |
†VOCO included cardiac death, vessel-related myocardial infarction, and vessel-related ischemia-driven revascularization. C-index of models was 0.763 (0.659–0.866), 0.778 (0.689–0.868), 0.761 (0.657–0.866), and 0.769 (0.670–0.867) for models of iFR-FFR, RFR-FFR, dPR-FFR, and resting Pd/Pa-FFR, respectively. CI, confidence interval; HR, hazard ratio. Other abbreviations as in Table 2.
Table 4
and
Figure 3
present the comparison of clinical outcomes according to the 4-group classifications by iFR and other resting physiologic indices among the deferred lesions. The incidence of discordance between iFR and other resting physiologic indices was lower than that between iFR and other resting indices and was from 2.5% (iFR and dPR) to 7.0% (iFR and RFR) (Table 4). Numerical differences of iFR with other resting physiologic indices were −0.02±0.02, −0.01±0.02, and 0.02±0.03, respectively, for RFR, dPR, and resting Pd/Pa.
Table 4.
Clinical Outcomes of Vessels According to Classification by iFR and Other Resting Physiologic Indices
| iFR and RFR |
Group 1
(iFR >0.89 and
RFR >0.89) |
Group 2
(iFR ≤0.89 and
RFR >0.89) |
Group 3
(iFR >0.89 and
RFR ≤0.89) |
Group 4
(iFR ≤0.89 and
RFR ≤0.89) |
P value |
| Per-vessel analysis (n=856) |
726 (84.8%) |
3 (0.4%) |
55 (6.4%) |
72 (8.4%) |
|
| Cardiac death |
0.8% (6) |
0.0% (0) |
0.0% (0) |
1.4% (1) |
0.856 |
| Myocardial infarction |
0.8% (5) |
0.0% (0) |
0.0% (0) |
1.4% (1) |
0.820 |
| Ischemia-driven revascularization |
1.4% (4) |
0.0% (0) |
1.8% (1) |
8.5% (6) |
<0.001 |
| VOCO† |
2.2% (10) |
0.0% (0) |
1.8% (1) |
9.9% (7) |
<0.001 |
| iFR and dPR |
Group 1
(iFR >0.89 and
dPR >0.89) |
Group 2
(iFR ≤0.89 and
dPR >0.89) |
Group 3
(iFR >0.89 and
dPR ≤0.89) |
Group 4
(iFR ≤0.89 and
dPR ≤0.89) |
P value |
| Per-vessel analysis (n=864) |
765 (88.5%) |
4 (0.5%) |
24 (2.8%) |
71 (8.2%) |
|
| Cardiac death |
0.8% (6) |
0.0% (0) |
0.0% (0) |
1.5% (1) |
0.906 |
| Myocardial infarction |
0.8% (5) |
0.0% (0) |
0.0% (0) |
1.5% (1) |
0.856 |
| Ischemia-driven revascularization |
1.5% (5) |
0.0% (0) |
0.0% (0) |
8.6% (6) |
<0.001 |
| VOCO† |
2.2% (11) |
0.0% (0) |
0.0% (0) |
10.0% (7) |
<0.001 |
| iFR and PdPa |
Group 1
(iFR >0.89 and
PdPa >0.92) |
Group 2
(iFR ≤0.89 and
PdPa >0.92) |
Group 3
(iFR >0.89 and
PdPa ≤0.92) |
Group 4
(iFR ≤0.89 and
PdPa ≤0.92) |
P value |
| Per-vessel analysis (n=864) |
764 (88.4%) |
13 (1.5%) |
25 (2.9%) |
62 (7.2%) |
|
| Cardiac death |
0.8% (6) |
0.0% (0) |
0.0% (0) |
1.7% (1) |
0.849 |
| Myocardial infarction |
0.8% (5) |
0.0% (0) |
0.0% (0) |
1.7% (1) |
0.807 |
| Ischemia-driven revascularization |
1.4% (5) |
0.0% (0) |
0.0% (0) |
9.8% (6) |
<0.001 |
| VOCO† |
2.2% (11) |
0.0% (0) |
0.0% (0) |
11.4% (7) |
<0.001 |
The cumulative incidence of clinical outcomes presented as Kaplan-Meier estimates during median follow-up of 729.0 (699.0–747.0) days. P values are log-rank or Breslow P value in survival analysis. †VOCO included cardiac death, vessel-related myocardial infarction, and vessel-related ischemia-driven revascularization. Abbreviations as in Table 2.
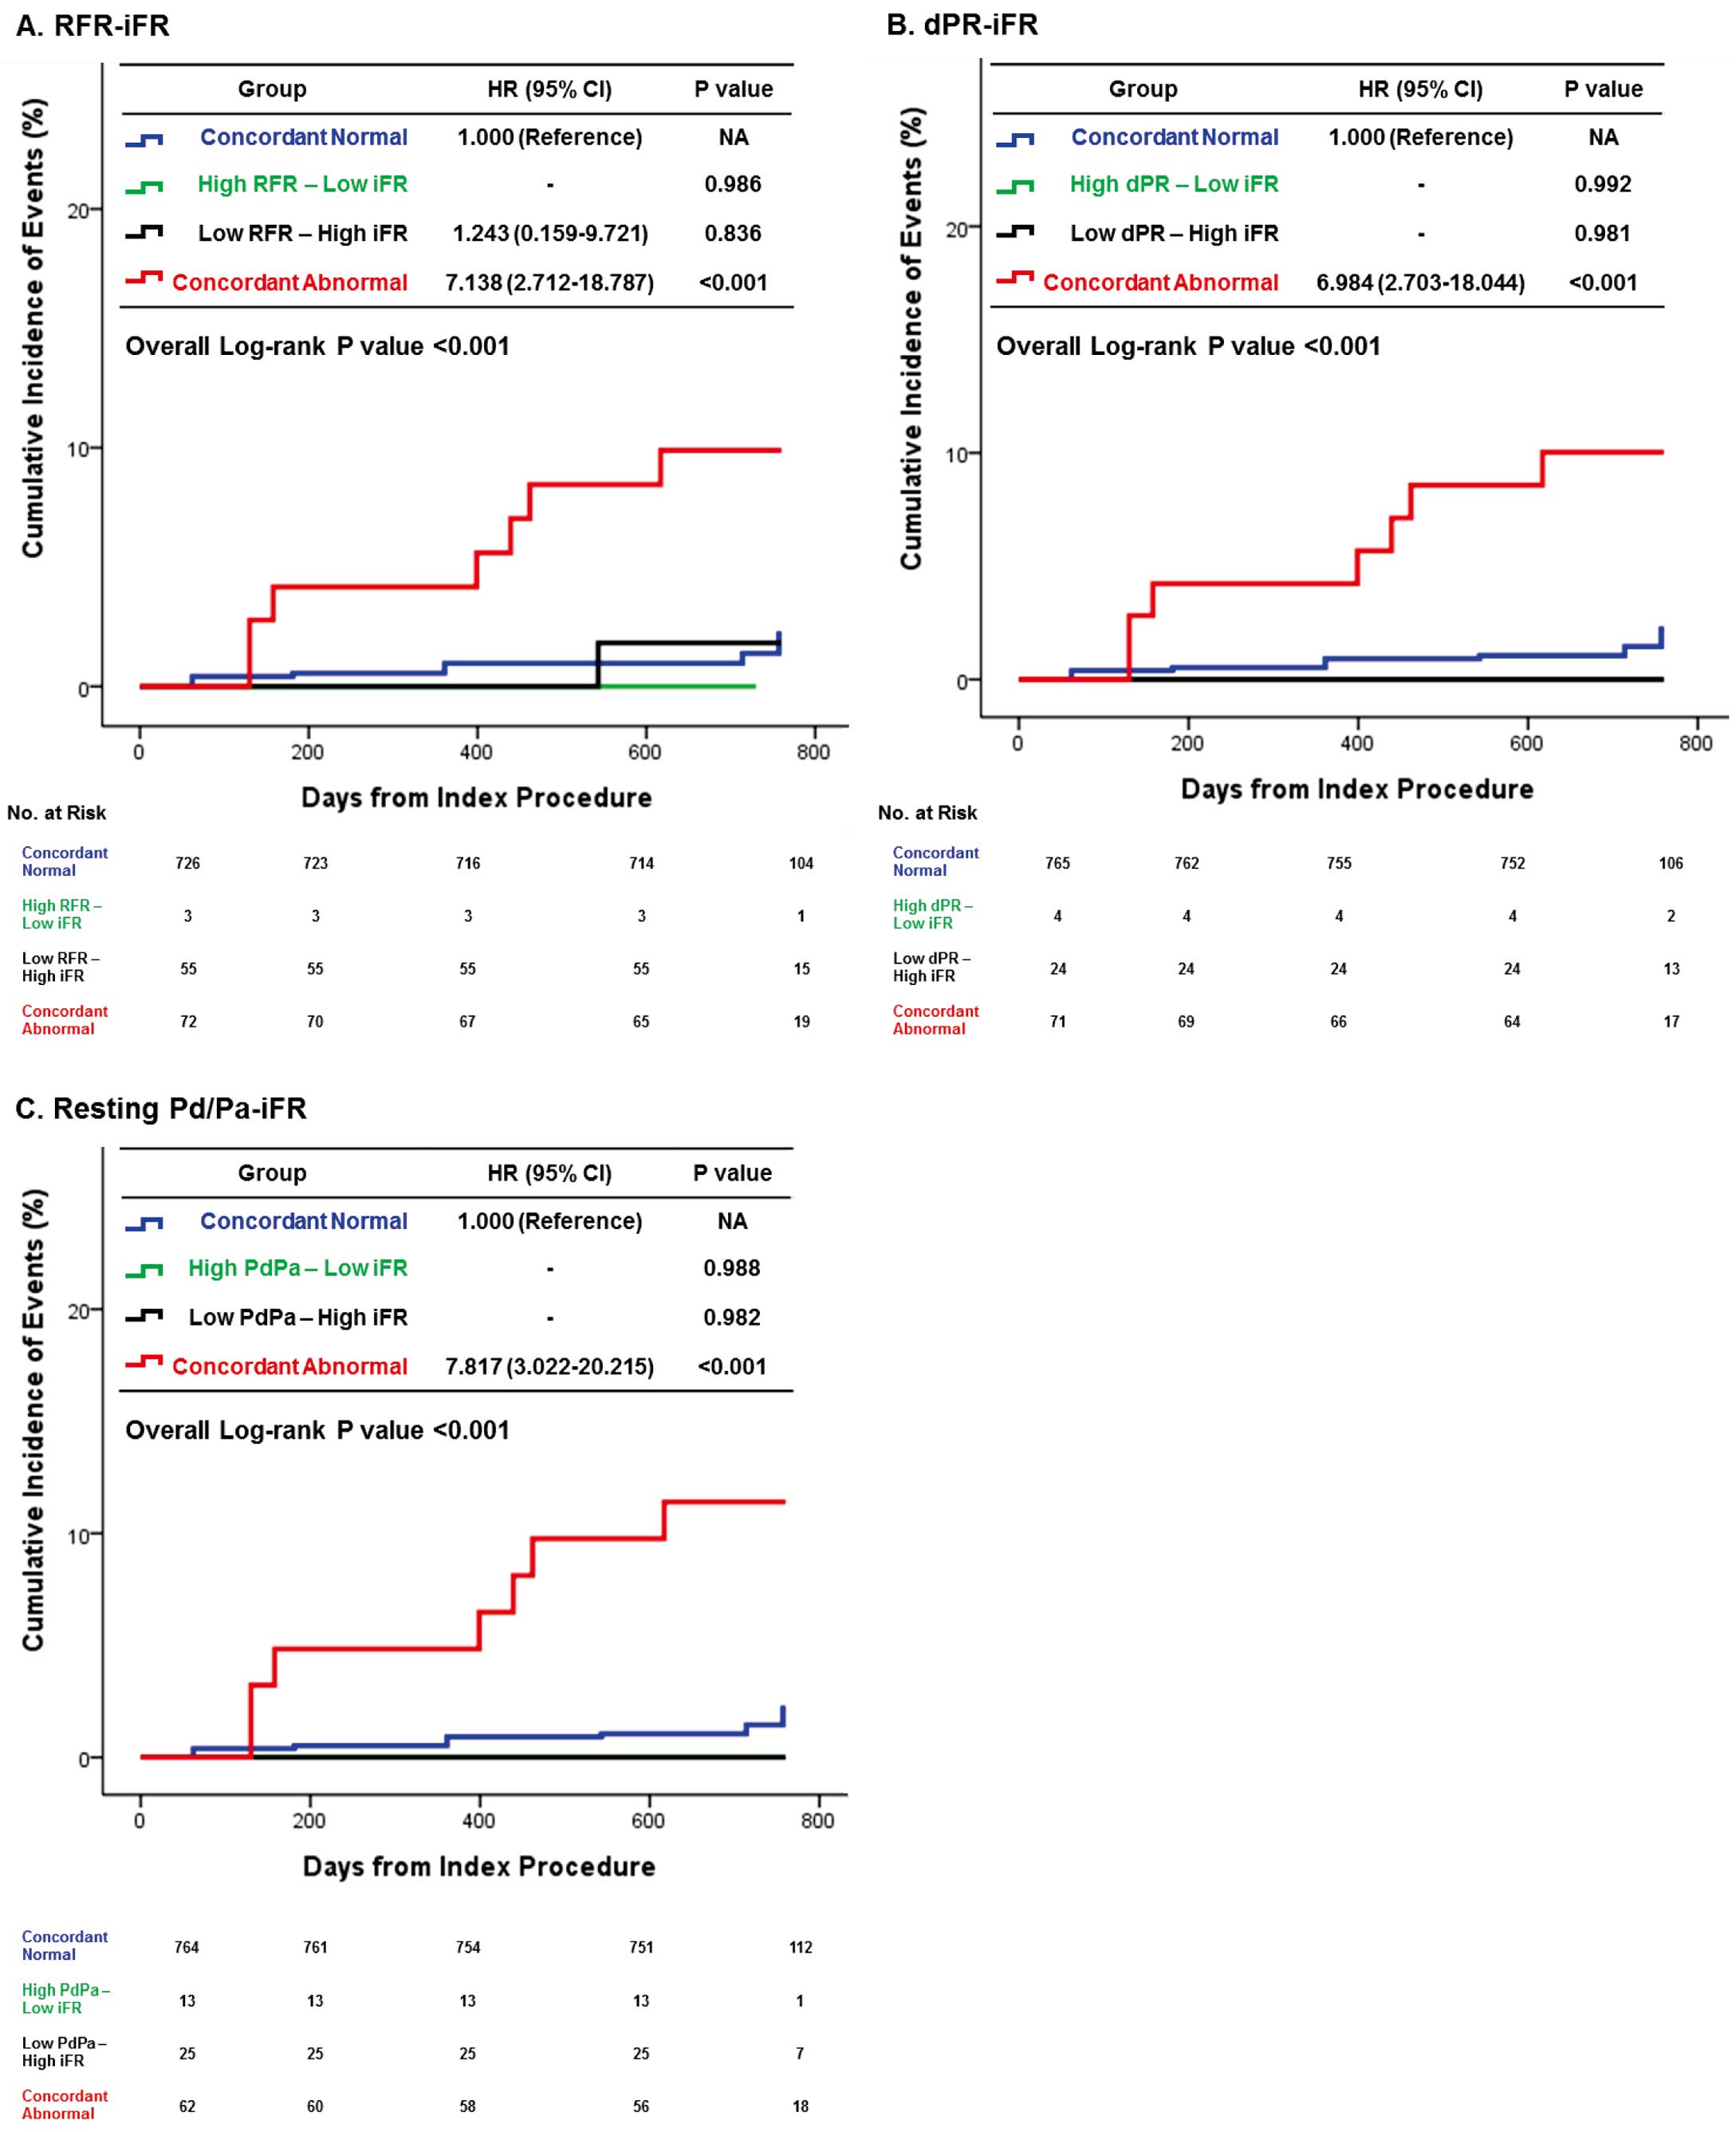
In the comparison of clinical outcomes, only Group 4 with concordant abnormal results between iFR and other resting physiologic indices showed significantly increased risk of VOCO compared with the other groups. There were no prognostic implications of any type of discordance between iFR and other resting physiologic indices (Table 4, Figure 3). In addition, only Group 4 was independently associated with the risk of VOCO (Table 5). The significantly increased risk of VOCO in Group 4 was also similarly observed among total vessels (Supplementary Table 7).
Table 5.
Independent Predictors of VOCO According to Classification by iFR and Other Resting Physiologic Indices
| |
RFR-iFR |
dPR-iFR |
Resting Pd/Pa-FFR |
| HR (95% CI) |
P value |
HR (95% CI) |
P value |
HR (95% CI) |
P value |
| Group 4 (concordant abnormal) |
4.79
(1.61–14.24) |
0.005 |
4.72
(1.62–13.74) |
0.005 |
4.94
(1.70–14.34) |
0.003 |
| Group 3 (low resting index and high iFR) |
1.62
(0.27–9.88) |
0.603 |
1.03
(0.05–22.53) |
0.984 |
1.17
(0.06–24.73) |
0.922 |
| Group 2 (high resting index and low iFR) |
8.25
(0.31–94.81) |
0.208 |
3.65
(0.14–93.53) |
0.434 |
2.47
(0.12–51.99) |
0.562 |
| Age |
1.01
(0.95–1.07) |
0.778 |
1.01
(0.95–1.07) |
0.738 |
1.01
(0.95–1.07) |
0.745 |
| Male |
2.04
(0.48–8.69) |
0.337 |
1.97
(0.46–8.38) |
0.357 |
1.85
(0.45–7.72) |
0.397 |
| Hypertension |
1.57
(0.48–5.15) |
0.459 |
1.55
(0.47–5.07) |
0.472 |
1.44
(0.45–4.65) |
0.541 |
| Current smoking |
1.96
(0.67–5.75) |
0.219 |
2.18
(0.75–6.31) |
0.153 |
1.91
(0.65–5.57) |
0.238 |
| Previous myocardial infarction |
1.41
(0.25–8.11) |
0.700 |
1.32
(0.22–7.97) |
0.761 |
1.47
(0.25–8.62) |
0.667 |
| Diabetes mellitus |
1.26
(0.48–3.31) |
0.646 |
1.31
(0.50–3.46) |
0.579 |
1.37
(0.52–3.61) |
0.528 |
| SYNTAX score |
1.05
(0.99–1.11) |
0.089 |
1.05
(0.99–1.10) |
0.102 |
1.05
(0.99–1.11) |
0.091 |
†VOCO included cardiac death, vessel-related myocardial infarction, and vessel-related ischemia-driven revascularization. C-index of models was 0.765 (0.657–0.873), 0.753 (0.638–0.868), and 0.765 (0.654–0.875) for models of RFR-iFR, dPR-iFR, and Resting Pd/Pa-iFR, respectively. Abbreviations as in Tables 2,3.
Discussion
The current study investigated the prognostic implications of discordance between resting physiologic indices and FFR or between iFR and other resting physiologic indices among deferred lesions. The main findings are as follows. First, all types of resting physiologic indices showed ≈11–13% of discordant results with FFR and 2 types of discordance showed different patients’ risk factor profiles and epicardial coronary stenosis. Second, among deferred lesions, only lesions with concordant abnormal results in both the resting index and FFR showed significantly increased risk of VOCO compared with the other groups. Discordant groups did not show any increased risk of VOCO among deferred vessels. Third, the incidence of discordant results between iFR and other resting physiologic indices was much lower than that between the resting index and FFR. In the comparison of clinical outcomes, there were also no prognostic implications of discordance between iFR and other resting physiologic indices, and only lesions with concordant abnormal results in both iFR and other resting physiologic indices showed an increased risk of VOCO.
Discordance Between Invasive Physiologic Indices
Previous studies have shown that the incidence of discordance between iFR and FFR is ≈10–30%.2
As both indices are measured under different conditions (i.e., FFR under hyperemia vs. iFR under resting status), it may be anticipated to have discordant results in some patients.2,10
Recently, new resting pressure-derived indices such as RFR or dPR have been introduced.14,22
Although Svanerud et al22
and Van’t Veer et al14
showed the diagnostic equivalence of RFR and dPR with iFR, respectively, there are limited data on their prognostic implications. As iFR-guidance showed comparable clinical outcomes with FFR-guidance despite less revascularization in the iFR-guidance group in both the DEFINE-FLAIR5
and iFR-SWEDEHEART trials,6
clinically relevant questions might address whether lesions with discordant results between resting indices and FFR or among resting indices have prognostic implications, thereby affecting clinical decision-making regarding subsequent appropriate treatment for those lesions. Although a recent study evaluated the prognostic implication of iFR, RFR, and dPR,15
prognosis of lesions with discordant results among physiologic indices has not been evaluated in a previous study.
Clinical Outcomes of the Discordance Between Resting Physiologic Indices and FFR
The current study evaluated the prognostic implications of 5 available physiologic indices, comprising FFR, iFR, RFR, dPR, and resting Pd/Pa, and the prognosis of lesions with discordant results. In addition, the current study focused on per-vessel-related events in order to properly evaluate the prognostic implications of lesions with discordant results among these physiologic indices. In our comparison of clinical outcomes among 4 groups classified by both resting indices and FFR, lesions with concordant abnormal results showed the highest risk of VOCO. In addition, only Group 4 (concordant abnormal in both resting index and FFR) showed significantly increased risk of VOCO and the presence of discordance was not a prognosticator, regardless of the resting physiologic indices. In addition, the current results are in line with those of previous studies using 13N-ammonia PET, which showed that lesions in the concordant abnormal group showed a significantly higher incidence of PET-defined myocardial ischemia.9,10
These results indirectly suggest that revascularization might not be beneficial in lesions with discordant results between 2 indices. It is interesting to note that the risk of clinical events was numerically higher in revascularized vessels than in deferred vessels among the discordance groups (Groups 2 and 3).
Recently, post-hoc analysis of the pooled population of the DEFINE-FLAIR and iFR-SWEDEHEART trials25
and post-hoc analysis of the DEFINE-FLAIR trial26
suggested the possible superiority of iFR-guidance in deferral of LAD lesions or patients with acute coronary syndrome, based on higher risk of MACE after FFR-guidance in these patient subsets. However, none of those post-hoc analyses had enough study power to validate the differences among subgroups. The lack of prognostic significance in lesions with discordant results between resting pressure-derived indices and FFR in the current study suggested that different physiologic indices investigated might have similar prognostic implications in daily practice. Nevertheless, further clinical studies are warranted to define the optimal treatment strategy for lesions with discordance.
Clinical Outcomes of the Discordance Between iFR and Other Resting Physiologic Indices
Currently, the iFR-guided strategy is recommended as a Class IA recommendation as with FFR-guided strategy.7
Recently, new resting indices such as RFR and dPR were introduced, and the presence of discordance between iFR and other resting indices has been reported.14,19,22,27
The discordance among resting indices originates from differences in their calculation algorithms, with a reported incidence of ≈2.5–7.0%, which is lower than that between the resting index and FFR. In our comparison of clinical outcomes among groups classified according to iFR and other resting indices, discordant groups did not show an increased risk of VOCO compared with concordant normal lesions. Those results suggested a lack of clinical or prognostic significance of discordance among resting physiologic indices despite differences in the calculation algorithm. Therefore, the resting indices could be used interchangeably according to the availability of devices and consoles in the laboratory. Finally, although the rate of discordance was highest between iFR and RFR and a previous report found that ≈12.2% of lesions showed RFR measured outside of the diastolic period,22
the current results did not find any prognostic implications of these findings. The results suggested that any potential difference in measurement location of the cardiac cycle between iFR and RFR might not have significant clinical relevance.
Study Limitations
Some limitations should be acknowledged. First, because of the limitations of the study design, we could not provide confirmatory results regarding the comparison between revascularization and deferral of revascularization for lesions with discordant results between physiologic indices. Second, the event rates were generally lower than those in previous studies. Third, the decision for revascularization of the target lesion was mainly made based on the FFR value, and not on resting pressure-derived indices.
Conclusions
Among deferred lesions, discordant results between resting physiologic indices and FFR and among resting indices were not associated with increased risk of VOCO. The risk of VOCO was significantly increased only in lesions with abnormal results of both indices.
Acknowledgment
This study was supported by a research grant from Abbott Vascular. The company had no role in study design, conduct, data analysis or manuscript preparation.
Conflict of Interest Disclosures
J.M.L. received a Research Grant from St. Jude Medical (Abbott Vascular) and Philips Volcano. J.-Y.H. received a Research Grant from St. Jude Medical (Abbott Vascular). B.-K.K. received an Institutional Research Grant from St. Jude Medical (Abbott Vascular) and Philips Volcano. All other authors declare they have no conflicta of interest relevant to the submitted work.
Supplementary Files
Please find supplementary file(s);
http://dx.doi.org/10.1253/circj.CJ-19-0230
References
- 1.
Patel MR, Peterson ED, Dai D, Brennan JM, Redberg RF, Anderson HV, et al. Low diagnostic yield of elective coronary angiography. N Engl J Med 2010; 362: 886–895.
- 2.
Lee JM, Doh JH, Nam CW, Shin ES, Koo BK. Functional approach for coronary artery disease: Filling the gap between evidence and practice. Korean Circ J 2018; 48: 179–190.
- 3.
van Nunen LX, Zimmermann FM, Tonino PA, Barbato E, Baumbach A, Engstrom T, et al. Fractional flow reserve versus angiography for guidance of PCI in patients with multivessel coronary artery disease (FAME): 5-year follow-up of a randomised controlled trial. Lancet 2015; 386: 1853–1860.
- 4.
Xaplanteris P, Fournier S, Pijls NHJ, Fearon WF, Barbato E, Tonino PAL, et al. Five-year outcomes with PCI guided by fractional flow reserve. N Engl J Med 2018; 379: 250–259.
- 5.
Davies JE, Sen S, Dehbi HM, Al-Lamee R, Petraco R, Nijjer SS, et al. Use of the instantaneous wave-free ratio or fractional flow reserve in PCI. N Engl J Med 2017; 376: 1824–1834.
- 6.
Gotberg M, Christiansen EH, Gudmundsdottir IJ, Sandhall L, Danielewicz M, Jakobsen L, et al. Instantaneous wave-free ratio versus fractional flow reserve to guide PCI. N Engl J Med 2017; 376: 1813–1823.
- 7.
Neumann FJ, Sousa-Uva M, Ahlsson A, Alfonso F, Banning AP, Benedetto U, et al. 2018 ESC/EACTS Guidelines on myocardial revascularization. Eur Heart J 2019; 40: 87–165.
- 8.
Lee JM, Shin ES, Nam CW, Doh JH, Hwang D, Park J, et al. Discrepancy between fractional flow reserve and instantaneous wave-free ratio: Clinical and angiographic characteristics. Int J Cardiol 2017; 245: 63–68.
- 9.
Lee JM, Hwang D, Park J, Tong Y, Koo BK. Physiologic mechanism of discordance between instantaneous wave-free ratio and fractional flow reserve: Insight from (13)N-ammonium positron emission tomography. Int J Cardiol 2017; 243: 91–94.
- 10.
Lee JM, Hwang D, Park J, Zhang J, Tong Y, Kim CH, et al. Exploring coronary circulatory response to stenosis and its association with invasive physiologic indexes using absolute myocardial blood flow and coronary pressure. Circulation 2017; 136: 1798–1808.
- 11.
Cook CM, Jeremias A, Petraco R, Sen S, Nijjer S, Shun-Shin MJ, et al. Fractional flow reserve/instantaneous wave-free ratio discordance in angiographically intermediate coronary stenoses: An analysis using Doppler-Derived coronary flow measurements. JACC Cardiovasc Interv 2017; 10: 2514–2524.
- 12.
Lee JM, Shin ES, Nam CW, Doh JH, Hwang D, Park J, et al. Clinical outcomes according to fractional flow reserve or instantaneous wave-free ratio in deferred lesions. JACC Cardiovasc Interv 2017; 10: 2502–2510.
- 13.
Svanerud J, Ahn JM, Jeremias A, van’t Veer M, Gore A, Maehara A, et al. Validation of a novel non-hyperaemic index of coronary artery stenosis severity: The Resting Full-cycle Ratio (VALIDATE RFR) study. EuroIntervention 2018; 14: 806–814.
- 14.
Van’t Veer M, Pijls NHJ, Hennigan B, Watkins S, Ali ZA, De Bruyne B, et al. Comparison of different diastolic resting indexes to iFR: Are they all equal? J Am Coll Cardiol 2017; 70: 3088–3096.
- 15.
Lee JM, Choi KH, Park J, Hwang D, Rhee TM, Kim J, et al. Physiological and clinical assessment of resting physiological indexes. Circulation 2019; 139: 889–900.
- 16.
Lee JM, Koo BK, Shin ES, Nam CW, Doh JH, Hwang D, et al. Clinical implications of three-vessel fractional flow reserve measurement in patients with coronary artery disease. Eur Heart J 2018; 39: 945–951.
- 17.
Lee JM, Kim CH, Koo BK, Hwang D, Park J, Zhang J, et al. Integrated myocardial perfusion imaging diagnostics improve detection of functionally significant coronary artery stenosis by 13N-ammonia positron emission tomography. Circ Cardiovasc Imaging 2016; 9: e004768.
- 18.
Hwang D, Jeon KH, Lee JM, Park J, Kim CH, Tong Y, et al. Diagnostic performance of resting and hyperemic invasive physiological indices to define myocardial ischemia: Validation with 13N-ammonia positron emission tomography. JACC Cardiovasc Interv 2017; 10: 751–760.
- 19.
Lee JM, Park J, Hwang D, Kim CH, Choi KH, Rhee TM, et al. Similarity and difference of resting distal to aortic coronary pressure and instantaneous wave-free ratio. J Am Coll Cardiol 2017; 70: 2114–2123.
- 20.
Lee JM, Kim CH, Koo BK, Hwang D, Park J, Zhang J, et al. Integrated myocardial perfusion imaging diagnostics improve detection of functionally significant coronary artery stenosis by 13N-ammonia positron emission tomography. Circ Cardiovasc Imaging 2016; 9: e004768.
- 21.
Sen S, Escaned J, Malik IS, Mikhail GW, Foale RA, Mila R, et al. Development and validation of a new adenosine-independent index of stenosis severity from coronary wave-intensity analysis: Results of the ADVISE (ADenosine Vasodilator Independent Stenosis Evaluation) study. J Am Coll Cardiol 2012; 59: 1392–1402.
- 22.
Svanerud J, Ahn JM, Jeremias A, van’t Veer M, Gore A, Maehara A, et al. Validation of a novel non-hyperaemic index of coronary artery stenosis severity: The Resting Full-cycle Ratio (VALIDATE RFR) study. EuroIntervention 2018; 14: 806–814.
- 23.
Jeremias A, Maehara A, Genereux P, Asrress KN, Berry C, De Bruyne B, et al. Multicenter core laboratory comparison of the instantaneous wave-free ratio and resting Pd/Pa with fractional flow reserve: The RESOLVE study. J Am Coll Cardiol 2014; 63: 1253–1261.
- 24.
Berhane K, Weissfeld LA. Inference in spline-based models for multiple time-to-event data, with applications to a breast cancer prevention trial. Biometrics 2003; 59: 859–868.
- 25.
Escaned J, Ryan N, Mejia-Renteria H, Cook CM, Dehbi HM, Alegria-Barrero E, et al. Safety of the deferral of coronary revascularization on the basis of instantaneous wave-free ratio and fractional flow reserve measurements in stable coronary artery disease and acute coronary syndromes. JACC Cardiovasc Interv 2018; 11: 1437–1449.
- 26.
Sen S, Ahmad Y, Dehbi HM, Howard JP, Iglesias JF, Al-Lamee R, et al. Clinical events after deferral of LAD revascularization following physiological coronary assessment. J Am Coll Cardiol 2019; 73: 444–453.
- 27.
Kobayashi Y, Johnson NP, Zimmermann FM, Witt N, Berry C, Jeremias A, et al. Agreement of the resting distal to aortic coronary pressure with the instantaneous wave-free ratio. J Am Coll Cardiol 2017; 70: 2105–2113.

