Abstract
Background:
Left ventricular (LV) torsion is a key parameter in cardiac function and predicts functional capacity (FC) more appropriately than LV ejection fraction (EF). We sought to investigate LV torsion as a marker of hospitalization for worsening heart failure (HF) in non-ischemic dilated cardiomyopathy (DCM) patients.
Methods and Results:
The 91 outpatients with newly diagnosed DCM (53±13 years, 20% female) were evaluated with 3D speckle-tracking imaging and followed up for 12 months; 43 healthy sex- and age-matched volunteers served as controls. LV torsion, LVEF, right ventricular function, LV global longitudinal (GLS) and circumferential (GCS) strain values, peak oxygen uptake (peak V̇O2) from FC and B-type natriuretic peptide levels were measured at baseline. Peak V̇O2
correlated successively with LV torsion, diastolic filling and GCS (r=0.70, −0.52 and −0.41, P<0.01) disclosing the central role of LV torsion. During follow-up (median 272 days), 24 (26%) cardiac events occurred. A reduced LV torsion (<0.59 degrees/cm) predicted cardiac events similar to a reduced peak V̇O2
(<19 mL/kg/min) (unadjusted hazard ratio 6.41 and 5.90, P<0.001). LV torsion provided a significant incremental value over right ventricular function and peak V̇O2
(C-index: 0.85, P=0.02).
Conclusions:
The results demonstrated a clear relation between LV torsion and disease severity, suggesting that LV torsion has additional prognostic relevance in DCM patients.
Left ventricular (LV) torsion results from the opposing rotations of the LV base and apex during systole. This wringing action of the heart is the result of longitudinal, circumferential and radial deformation of the myocardium, and is dependent on the LV’s helically oriented myofibers.1–3
Progressive LV dilation, for instance, negatively influences LV torsional deformation and also results in a further decline of LV function as observed in patients with non-ischemic dilated cardiomyopathy (DCM).4
We have recently shown that LV torsion predicts functional capacity (FC) and, thus, severity of the disease in DCM more appropriately than LV ejection fraction (EF).5
LV rotation is integral to the development of normal LV function.6,7
It represents a parameter with higher sensitivity for changes in LV contractility than LVEF.8
Although the scientific community has given up on the idea that LVEF alone appropriately reflects FC9,10
and clinical frailty in heart failure (HF) patients,11,12
LVEF is still used as the main echocardiographic marker for therapy guidance. But this approach has been questioned recently. Myocardial strain analysis was introduced as a more reliable alternative to routine EF evaluation.13
Until now, no studies have been able to elucidate the relationship between LV torsion and clinical outcome in DCM patients, so the aim of the present study was to analyze reduced LV torsion as a potential marker of disease severity and, therefore, account for hospital admission even in apparently clinically stable patients with DCM.
Methods
Study Population
As part of our observational prospective HF registry, 105 consecutive clinically stable outpatients newly diagnosed (<6 months) with DCM were screened prospectively in our HF ambulance. All participants gave informed consent and the study was approved by the local institutional review board [#55022011]. In brief, the DCM patients had a reduced LVEF (<50%) in the absence of coronary disease, hypertensive heart disease or congenital abnormalities, and received the most appropriate medical treatment (>6 weeks).14
All included patients were in sinus rhythm, without ventricular pacing or cardiac resynchronization/modulation therapy at enrollment. Further exclusion criteria were significant mitral valve insufficiency and typical left bundle branch block (n=6). During the screening period, N-terminal pro-B-type natriuretic peptide (NT-proBNP) levels were measured at rest, New York Heart Association (NYHA) functional class was assessed, and patients underwent a standardized symptom-limited cardiopulmonary exercise testing (CPET) protocol as described previously.5
In addition, 50 age- and sex-matched healthy persons, without any history of cardiovascular diseases, with normal LVEF (>50%) and without the need for cardiovascular medications were screened as controls. Our study complied with the Declaration of Helsinki.
Follow-up and Definition of Study Endpoint
All eligible patients received a standard clinical follow-up visit every 3 months. Decisions regarding shortened follow-up intervals for patients were made at the physicians’ discretion. Both the patient and the clinician were blinded to the results of LV torsion. No patient was lost during follow-up. The primary endpoint for this study was hospital admission for worsening HF within 12 months after enrollment.
Echocardiographic Image Acquisition and Analysis
At study enrollment all subjects underwent standardized 2D echocardiography as described.15
The apical full 3D data sets of the LV were acquired immediately after 2D echocardiography by the same operator. ECG-gated subvolumes of 4–6 heart cycles were acquired during a single breath hold. Elevation tilt, lateral contrast and volume rates (23±3 videos/s) were adjusted for the best imaging quality. The 2D and 3D echocardiographic data sets were obtained using a PST-25SX (Artida, Canon Medical Systems) or a X5-1 (iE33, Philips Medical Systems) phased-array matrix transducer. After further exclusion of subjects with a suboptimal acoustic window (patients: n=8 and controls: n=7), the 3D data sets of the remaining 91 patients and 43 healthy controls were analyzed off-line with a specific vendor-independent speckle-tracking software (4D LV Analysis, version 3.1.2, TomTec Imaging Systems) as previously described.16,17
LV end-diastolic and end-systolic volumes, as well as LV stroke volume (SV), were indexed to body surface area and used for the calculation of LVEF or LV end-systolic sphericity.18
For 3D strain analysis, the LV was automatically divided into 16 segments. The analysis software provided averaged time curves, from which peaks of global longitudinal strain and global circumferential strain (GLS and GCS) were determined. The analysis software generated LV basal and apical rotation angles and “instantaneous” LV twist time curves, from which peak basal rotation, peak apical rotation, peak LV twist and torsion were measured. In addition, LV torsion, which is the twist per level distance (degrees/cm), was obtained by dividing twist by the automatically computed distance between the base and apex.
Cardiac MRI Acquisition and Feature Tracking Analysis
Measurements of LV rotation by 3D speckle-tracking imaging (STI) were validated by cardiac magnetic resonance imaging (MRI) in 27 participants within 24 h of the echocardiographic data acquisition at baseline. Cardiac MRI (Signa®
3T; GE Healthcare) was performed using an 8-channel cardiac coil with the patient in a supine position. From the ventricular apex to the base, ECG-triggered, breath-hold (10–15 s), balanced steady-state free precession sequences (SSFP) were obtained in the short-axis view with 8–14 short-axis slices (8 mm thickness) encompassing the entire LV. The LV basal and apical short-axis SSFP images were analyzed with dedicated feature tracking (FT) software (2D CPA MR; TomTec Imaging Systems).16
For each of the 2 short-axis plane SSFP images the LV endocardial borders at end-diastole were manually drawn on a single frame. The software automatically followed the contour throughout the cardiac cycle and determined peak endocardial rotation by averaging the peak values of the segments at the LV basal and apical levels. The entire rotational data of a cardiac cycle (i.e., basal and apical planes) were exported into a data-frame and “instantaneous” peak LV twist values were calculated off-line.
Statistical Analysis
All statistical analyses were performed with open-source software R (version 3.4.0, 2017, The R Foundation for Statistical Computing). The 3D-STI-derived LV rotational measures were compared with the referenced cardiac FT-MRI values. The comparisons included linear regression, intraclass correlation coefficient (ICC), and Bland-Altman analyses to assess the bias and limits of agreement (Supplementary Figure). Intra- and interobserver agreements were estimated from 20 randomly selected data sets within 1 week by 2 investigators blinded to previous results and expressed as the ICC. Patients were stratified into 2 groups according to the median of measured LV torsion (> or <0.59 degrees/cm) and defined as relatively preserved or reduced, respectively (Tables 1,2). Results are expressed as mean±standard deviation or frequency and percentage unless otherwise specified. Statistical difference was assessed using Student’s t-test, Wilcoxon’s test or Fisher’s exact test as appropriate. The relationships among echocardiographic and clinical data were evaluated using Pearson’s or Spearman’s correlation coefficient and summarized as a correlation table with Bonferroni correction in order to account for the family-wise error rate (Table 3). Cumulative hospitalization curves were estimated by the Kaplan-Meier method and the log-rank test (Figure 1A,B) between patient groups defined by the median of LV torsion or the median of peak oxygen uptake (peak V̇O2=19.0 mL/min/kg) from CPET. Hazard ratios (HRs) and 95% confidence intervals (95% CI) of LV torsion and peak V̇O2
(referenced to the median) for hospitalization of DCM patients were visualized continuously using the ‘coxsimLinear’ function from the ‘simPH’19
package (Figure 1C,D). Additional stratification of patients was performed according to the occurrence of cardiac events during follow-up period and depicted in
Figure 2. For purposeful variable selection regarding events during the follow-up period, we performed a 2-step approach as follows: each significant predictor of the univariate Cox regression analyses (P<0.10) (Figure 3A) was analyzed in separate nested Cox regression models with important clinical parameters as adjusting covariates (i.e., age, NYHA class and log-transformed NT-proBNP) and depicted as “adjusted” HRs with corresponding 95% CIs (Figure 3B). Finally, we performed an additive step-up procedure of these significant variables disclosing the predictive power for events during follow-up. Nested Cox models were separately compared by likelihood ratio tests and expressed as global χ2
values with the corresponding C-index as the measure of goodness-of-model-fit (Figure 4). Final statistical significance was defined as a 2-tailed P-value <0.05.
Table 1.
Demographic, Clinical and Exercise Test Data at Baseline for Study Patients With Dilated Cardiomyopathy
| Variable |
Controls
(n=43) |
All patients
(n=91) |
P value |
Relatively
preserved LV
torsion (n=46) |
Reduced LV
torsion (n=45) |
P value |
| Demographic and clinical data |
| Age (years) |
49±15 |
53±13 |
0.11 |
53±15 |
52±13 |
0.74 |
| Female sex, n (%) |
9 (20) |
17 (20) |
0.99 |
7 (15) |
10 (22) |
0.61 |
| Body surface area (m2) |
1.95±0.13 |
1.98±0.20 |
0.94 |
1.95±0.19 |
2.00±0.20 |
0.09 |
| Heart rate (beats/min) |
69±9 |
71±9 |
0.17 |
71±8 |
72±10 |
0.78 |
| SBP (mmHg) |
119±16 |
125±18 |
0.11 |
125±18 |
123±21 |
0.61 |
| DBP (mmHg) |
62±11 |
71±10 |
<0.05 |
70±10 |
72±11 |
0.52 |
| NT-proBNP (pmol/L) |
/ |
613 [256–1,804] |
/ |
499 [194–778] |
1,360 [451–2,403] |
0.003 |
| NYHA Class, n (%) |
|
|
|
|
|
0.28 |
| I |
/ |
41 (46) |
/ |
25 (54) |
17 (38) |
|
| II |
/ |
40 (44) |
/ |
17 (37) |
23 (51) |
|
| III |
/ |
9 (10) |
/ |
4 (9) |
5 (11) |
|
| Medications |
| BB, n (%) |
/ |
86 (94) |
/ |
44 (96) |
42 (93) |
0.67 |
| IAA, n (%) |
/ |
87 (96) |
/ |
43 (93) |
44 (97) |
0.61 |
| Diuretics, n (%) |
/ |
86 (94) |
/ |
43 (94) |
43 (96) |
0.99 |
| Cardiopulmonary exercise test data |
| Peak workload (Watts) |
/ |
134±43 |
/ |
152±43 |
111±31 |
<0.001 |
| Peak heart rate (beats/min) |
/ |
129±26 |
/ |
140±23 |
115±23 |
<0.001 |
| Peak SBP (mmHg) |
/ |
159±33 |
/ |
172±30 |
144±31 |
0.003 |
| V̇E/CO2-slope |
/ |
32±5 |
/ |
29±3 |
35±5 |
<0.001 |
| Peak V̇O2 (mL/kg/min) |
/ |
20±4 |
/ |
22±5 |
16±4 |
<0.001 |
| Primary endpoint during follow-up |
| Hospitalization, n (%) |
/ |
24 (26) |
/ |
3 (7) |
21 (47) |
<0.001 |
P-values denote the significance level of unpaired Student’s t-test, Wilcoxon signed-rank test or Fisher’s exact test as appropriate. Relatively preserved left ventricular (LV) torsion: >0.59 degrees/cm; reduced LV torsion: <0.59 degrees/cm; data are presented as mean±standard deviation – except for NT-proBNP (median with 25–75% quantiles), or as absolute numbers n with relative frequencies (%); SBP, systolic blood pressure; DBP, diastolic blood pressure; NT-proBNP, N-terminal pro brain natriuretic peptide; NYHA, New York Heart Association; BB, β-blockers; IAA, inhibitors of angiotensin-converting enzyme and angiotensin-receptor; Peak V̇O2, peak oxygen uptake; V̇E/CO2, minute ventilation/carbon dioxide production.
Table 2.
Resting Echocardiographic Data at Baseline for Study Patients With Dilated Cardiomyopathy
| Variable |
Controls
(n=43) |
All patients
(n=91) |
P value |
Relatively
preserved LV
torsion (n=46) |
Reduced LV
torsion (n=45) |
P value |
| LV dimensions |
| EDV-index (mL/m2) |
63±10 |
105±23 |
<0.001 |
97±21 |
113±23 |
<0.001 |
| ESV-index (mL/m2) |
28±7 |
72±22 |
<0.001 |
63±18 |
82±21 |
<0.001 |
| Sphericity-index |
0.52±0.11 |
0.59±0.21 |
0.004 |
0.53±0.19 |
0.65±0.21 |
0.01 |
| LV function |
| LVEF (%) |
56±4 |
33±10 |
<0.001 |
36±9 |
29±9 |
<0.001 |
| SV-index (mL/m2) |
36±5 |
33±10 |
0.04 |
35±10 |
31±9 |
0.06 |
| E/E’ ratio |
8±2 |
14±5 |
<0.001 |
12±4 |
16±5 |
<0.001 |
| LV strain |
| GLS (%) |
−13.9±2.2 |
−7.9±3.2 |
<0.001 |
−9.2±3.1 |
−6.7±2.8 |
<0.001 |
| GCS (%) |
−23.8±4.7 |
−10.7±4.9 |
<0.001 |
−12.1±4.9 |
−9.3±4.6 |
<0.01 |
| LV twist motion and rotation |
| Twist (degrees) |
9.1±3.1 |
4.1±2.2 |
<0.001 |
5.7±2.4 |
2.4±1.2 |
<0.001 |
| Base-apex distance (mm) |
8.0±0.4 |
8.2±0.9 |
0.22 |
8.1±0.8 |
8.3±0.9 |
0.41 |
| Torsion (degrees/cm) |
1.30±0.34 |
0.62±0.31 |
<0.001 |
0.87±0.22 |
0.37±0.12 |
<0.001 |
| Apical rotation (degrees) |
6.1±2.5 |
1.4±2.4 |
<0.001 |
2.3±2.2 |
0.1±1.5 |
<0.001 |
| Reversed apical rotation, n (%) |
0 (0) |
24 (26) |
<0.001 |
3 (7) |
21 (47) |
<0.001 |
| Basal rotation (degrees) |
−4.4±2.65 |
−2.7±2.3 |
<0.001 |
−3.2±2.5 |
−2.1±2.1 |
0.02 |
| RV dimensions and function |
| EDD (mm) |
27±4 |
30±5 |
0.008 |
29±5 |
31±6 |
0.11 |
| TAPSE (mm) |
24±3 |
19±5 |
<0.001 |
20±5 |
18±5 |
0.03 |
Data are presented as mean±standard deviation, or absolute numbers n with relative frequencies (%). P-values denote the significance level of unpaired Student’s t-test or Wilcoxon signed-rank test as appropriate. Relatively preserved left ventricular (LV) torsion: >0.59 degrees/cm; reduced LV torsion: <0.59 degrees/cm. EDV, end-diastolic volume; ESV. end-systolic volume; EF, ejection fraction; SV, stroke volume; E/E’, ratio of pulsed-wave Doppler-derived early diastolic transmitral flow and tissue Doppler-derived early diastolic velocity from the lateral mitral annulus; GLS, global longitudinal strain; GCS, global circumferential strain; RV, right ventricular; EDD, end-diastolic dimension; TAPSE, tricuspid annular plane systolic excursion.
Table 3.
Relationships Among Peak V̇O
2 and LV Torsion With the Demographic, Clinical, and Echocardiographic Parameters in the Study Patients With DCM (n=91)
| Variables |
Peak V̇O2 |
P value |
LV torsion |
P value |
| LV deformation parameters |
| Torsion |
0.70 |
<0.001 |
– |
– |
| Apical rotation |
0.33 |
0.01 |
0.68 |
<0.001 |
| Basal rotation |
−0.31 |
0.05 |
−0.35 |
0.005 |
| GCS |
−0.41 |
<0.001 |
−0.38 |
0.002 |
| GLS |
−0.36 |
0.007 |
−0.29 |
0.05 |
| Ventricular geometry and function |
| LVEF |
0.35 |
0.006 |
0.38 |
0.002 |
| LV E/E’-ratio |
−0.52 |
<0.001 |
−0.36 |
0.004 |
| Spheroidicity |
−0.35 |
0.008 |
−0.36 |
0.004 |
| TAPSE |
0.20 |
0.31 |
0.24 |
0.21 |
| Demographic and clinical data |
| Age |
−0.14 |
0.99 |
0.08 |
0.99 |
| (log) NT-proBNP |
−0.45 |
0.009 |
−0.26 |
0.05 |
| Peak V̇O2 |
– |
– |
0.70 |
<0.001 |
| Peak workload |
0.54 |
0.001 |
0.51 |
0.002 |
P-values denote the significance level of correlation coefficients adjusted for multiple testing by Bonferroni correction. Abbreviations as in Tables 1,2.
Results
Characteristics of the Study Population
We enrolled 91 stable DCM patients without clinical signs of acute cardiac decompensation in this prospective observational study. Anthropomorphic and clinical characteristics of the study group are presented in
Table 1. No significant differences were noted in age, heart rate, systolic blood pressure, and body surface area between the DCM patients and the control subjects (n=43). As expected, patients with DCM had both significantly larger LV volume and impaired LV function compared with controls (Table 2). During a median follow-up period of 272 days, 24 (26%) patients with DCM were admitted to hospital because of worsening HF. As summarized in
Figure 1A, patients with a relatively preserved LV torsion (>0.59 degrees/cm) were less frequently hospitalized (n=3, 7%) than patients with a reduced LV torsion (<0.59 degrees/cm) (n=21, 47%) (P<0.001). Of the latter, 2 died during hospital stay and 4 received LV assist devices. In line with these findings, patients with a reduced LV torsion exhibited reduced LV function, altered LV geometry, higher levels of NT-proBNP, elevated V̇E/CO2-slopes and lower peak V̇O2
values (Tables 1,2). Age, sex, NYHA class and medications did not confound these findings.
Relationship Among LV Torsion, LV Function and Clinical Status
Among the echocardiographic parameters, LV torsion had the strongest relationship with peak V̇O2, followed by E/E’-ratio, GCS, GLS and LVEF, as summarized in
Table 3. Interestingly, LV torsion significantly correlated with workload and the E/E’-ratio (r=0.51 and −0.36, P<0.01 for all). Although LV apical rotation inter-correlated significantly with LV torsion (r=0.68, P<0.001), both LV apical and basal rotation exhibited separate modest relationships with peak V̇O2
(r=0.33 and −0.31, respectively). Patients with reduced LV torsion had more often a reversed LV apical rotation (<0.0 degrees) as shown in
Table 2. These patients more often exhibited a reduced FC (peak V̇O2
<19 mL/kg/min) than patients with a normally directed apical rotation (crude odds ratio 3.25, P=0.03). Tricuspid annular plane systolic excursion (TAPSE) did not significantly correlate with LV apical rotation, LV torsion, (log) NT-proBNP or peak V̇O2
(r=0.14, 0.24, −0.23 and 0.20, respectively; P>0.05). In contrast, GCS and GLS showed significant correlation with (log) NT-proBNP (r=−0.46 and −0.41, respectively; P<0.05), with LV spheroidicity (r=0.67 and 0.57, respectively; P<0.05) and with the E/E’-ratio (r=0.43 and 0.36, respectively; P<0.05). As expected, LVEF correlated strongly with SV, GLS and GCS (r=0.67, −0.71, −0.63, respectively; P<0.001), but modestly with LV spheroidicity (−0.36, P<0.01). Age was not associated with E/E’-ratio, GLS, GCS, LVEF, TAPSE or LV torsion (r=0.19, 0.16, 0.19, −0.05, −0.09 and 0.06, respectively; P>0.05 for all).
Predictors of Hospitalization
Primary Kaplan-Meier analyses (Figure 1A,B) demonstrated that DCM patients with a reduced LV torsion (<0.59 degrees/cm) or reduced peak V̇O2
(<19 mL/kg/min) had higher risk for hospitalization compared with those without these criteria (respective unadjusted HRs: 6.41 (95% CI 2.19–18.83) and 5.90 (95% CI 2.31–15.06), P<0.001). With decreasing LV torsion or peak V̇O2
at baseline, the relative likelihood of hospital admission because of worsening HF increased (Figure 1C,D). In comparison, a reduced LVEF (<median=33%) was not a significant predictor of the endpoint (unadjusted HR: 2.00 (95% CI 0.88–4.58), P=0.13). As shown in
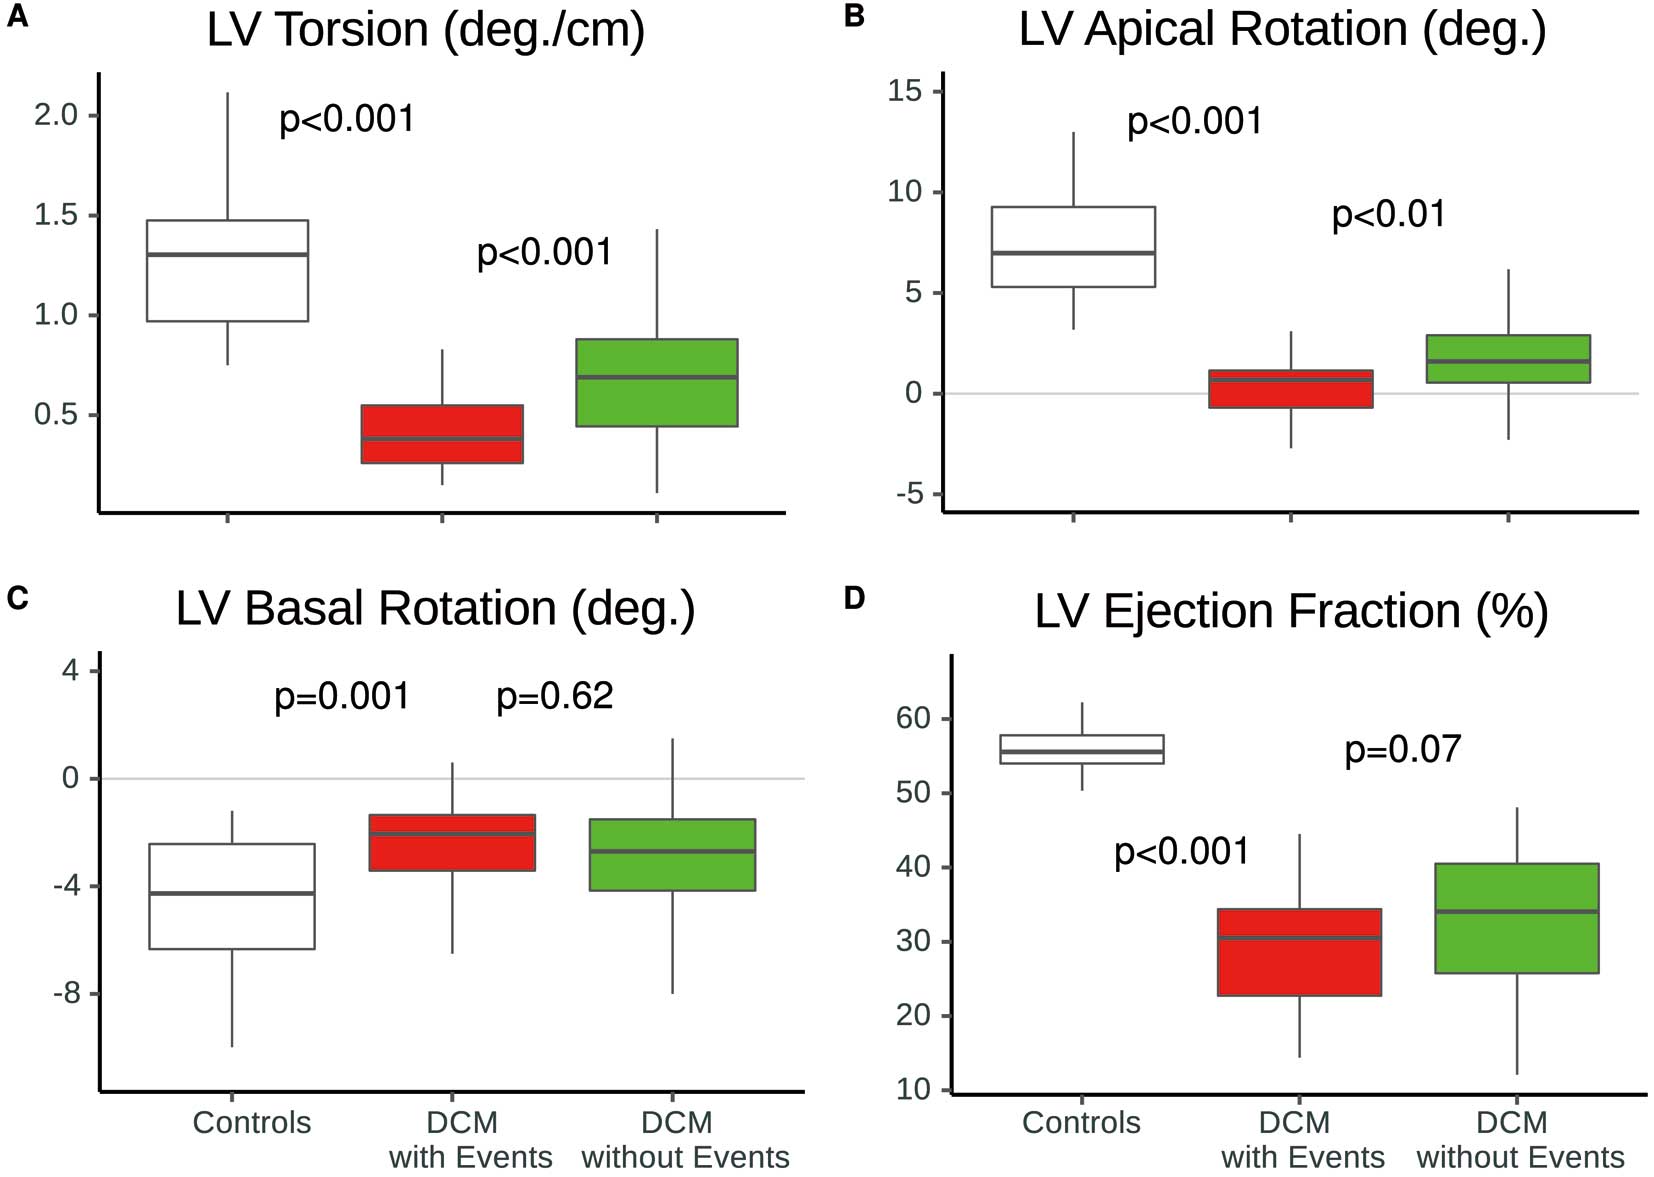
Figure 2, we found that those patients with cardiac events (n=24) during the follow-up period already showed a significantly higher reduction in LV torsion and LV apical rotation at baseline than those patients without cardiac events (P<0.001). Furthermore, 9 patients with events (37.5%) exhibited reversed LV apical rotation (<0.0 degrees) at baseline. Although the initial results of univariate Cox analyses indicated significant association of NT-proBNP, peak V̇O2, GCS, GLS, TAPSE, and E/E’-ratio with the occurrence of hospitalization, only peak V̇O2, LV torsion and TAPSE remained statistically significant predictors in our patients (Figure 3). Based on these findings, we performed separate nested regression analyses for each significant parameter and tested its incremental value to predict hospitalization, as summarized in
Figure 4. As anticipated, LV torsion with peak V̇O2
improved predictive power for future hospitalization for worsening HF beyond TAPSE alone.
Inter-Technique Comparisons of 3D-STI and Cardiac FT-MRI
Mean LV basal and apical rotation as well as twist were −7.22, 5.32 and 13.10 degrees, respectively, in the 3D-STI measurements and −7.93, 5.83 and 14.12 degrees on cardiac FT-MRI (mean bias: 0.71, −0.51 and 1.02 deg., P<0.05) for 27 participants (i.e., 12 controls and 15 patients). As anticipated, both methods showed high agreement with each other (ICC=0.94, 0.99 and 0.97, P<0.001) as illustrated in
Supplementary Figure. Furthermore, inter- and intra-observer agreement (ICC) for LV apical and LV basal rotation, as well for LV torsion, was as follows: 0.95, 0.94, 0.94; 0.92, 0.93 and 0.93 (P<0.001 for all).
Discussion
The present study evaluated the relationship between LV torsion and future hospital admission for patients with DCM. The major findings of this study were: (1) an attenuated LV torsion was indicative of a more rigid ventricle, which appropriately reflects disease severity in DCM patients (Tables 1,2); (2) patients with reduced LV torsion (i.e., <0.59 degrees/cm) were more often hospitalized for worsening HF during the follow-up period than patients with relatively preserved rotational mechanics (Figure 1); and (3) LV torsion provided relevant additional information about unfavorable outcome regarding 1-year hospitalization for HF worsening (Figures 3,4).
During disease progression of DCM the LV becomes more spheroidal in shape, which has a negative influence on LV function.1,20
In line with this observation, we found that LV systolic and diastolic function was dependent on the amount of LV dilation. The degree of LV spheroidicity impaired not only circumferential/longitudinal deformation but more importantly also reduced the LV twisting motion. Van Dalen et al elegantly demonstrated the negative influence of progressive LV dilation on rotational mechanics in DCM.4
One may assume that with increasing cavity dimension the function and orientation of the myocardial fibers is altered. Indeed, recent reports21,22
underpin our belief that impaired angular reorganization of LV helical myofibers during systole may account for both the reduced longitudinal-circumferential strain (i.e., twist) and the impaired radial thickening in DCM. However, the mechanical disturbances during progression of HF are complex. Cardiac remodeling in DCM is not solely epitomized by LV dilation, but also involves a reduction of myocardial contractility with impaired compliance resulting in increased LV stiffness. Myocardial replacement fibrosis in DCM, for instance, is supposed to play a key role in cardiac remodeling and is found not only in the subendomyocardium but also in the LV mid-wall, which preferentially affect the function of circumferential fibers and therefore, attenuates the LV twisting motion.23
In other words, both altered fiber orientation and myocardial fibrosis eventually lead to a more rigid LV. Increased myocardial stiffness therefore impairs torsional deformation and thus reduces the corresponding suction during diastolic filling with respect to the underlying fluid mechanics.24,25
In line with these observations, we have shown that both impaired LV diastolic filling (i.e., higher E/E’-ratio) and the state of volume overload (i.e., higher NT-proBNP level and LV spheroidicity) were associated not only with reduced LV circumferential deformation but also with impaired LV twist/torsion. Indeed, systolic emptying and LV filling show a complex interplay, which is influenced by the state of loading conditions and the degree of myocyte relaxation, especially in patients with DCM.7,26,27
This force-dependency of rotational mechanics enables LV torsion to represent an integrative measure of systolic and diastolic function based on the principles of the Frank-Starling mechanism.28
Therefore, it is consistent that LV torsional mechanics play an important role in the generation of an adaptive SV and peak V̇O2
during exercise, as demonstrated in recent studies.6,29
Although we measured LV rotation at rest we could clearly re-establish the relationship between torsion and peak V̇O2
even in a new and broader cohort of patients with DCM,5
and also demonstrated that LV apical rotation is the main “driving force” behind LV torsion (r=0.69) (Table 3). Attenuated LV torsional mechanics would be particularly detrimental during training, when mainly the filling time is shortened, which would be critical to the ability of the ventricle to increase SV, thereby not achieving adequate cardiac output and not contributing to higher peak V̇O2. Put differently, relatively preserved LV torsional mechanics at rest could function as a prerequisite for the generation of a “contractile reserve”, especially during exercise for those patients with already reduced LV systolic and longitudinal function. Indeed, we demonstrated that blunted LV torsion with reversed apical rotation indicated a more advanced stage of disease in DCM, which is in line with the findings of Popescu et al.30
In the present DCM patients, LV torsion but not apical rotation was predictive of future hospitalization (Figure 3). LV apical rotation only represented rotational deformation in 1 cross-section of the LV. In contrast, torsion integrates both the apical and basal rotational components and takes into consideration the 3D deformation of the ventricle. Although assessment of right ventricular function, the E/E’-ratio and natriuretic peptide levels has become an integral part of clinical outpatient care,31–33
LV torsion gives prognostic value beyond these traditional parameters (Figure 4). Moreover, we demonstrated, for the first time, that an attenuated LV torsion had similar predictive value as reduced FC (Figures 3,4). Nevertheless, peak V̇O2
derived from exercise testing further remains a very strong clinical predictor of disease progression and of outcome in HF patients.34
Both the amount of LV torsion and the level of FC are supposed to be dependent on the state of myocardial contractility and distensibility. However, based on the “central role of the periphery”,35
recent studies have described the influence of peripheral oxygen extraction, peripheral muscle mass/function as well as vascular/neurohumoral activity on LV function and exercise capacity in HF patients.36,37
The key question is: how much impact these pathophysiological variables have on LV torsion in DCM? This remains to be elucidated in further studies. Nevertheless, considering the central role of torsional mechanics in LV function, the interplay of ventricular function and peak V̇O2, as well as the strong relationship between FC and cardiac prognosis, LV torsion has potential to identify HF patients with a poorer prognosis.
Study Limitations
Our study was designed to test whether LV torsion can function as an additional predictor for hospital admission for worsening HF in DCM patients. Because of the observational nature of our study, which was hypothesis-generating, further randomized clinical prospective trials are needed to establish LV torsion as an integral part of the first-line examinations of HF patients with DCM. We believe that a broader population of HF patients would provide a more definitive statement about patients’ mortality. The number of events was limited, and this circumstance did not allow us to adjust the variables in a fully multivariable model. Nevertheless, clinical outcome is age-dependent, which might limit the generalizability of our study results, but we could strengthen the fact that patients’ age did not undermine the clinical importance of LV torsion. Moderate or even mild mitral regurgitation may affect exercise tolerance; however, we excluded patients with significant mitral regurgitation. Finally, 3D-STI is limited by its relative low temporal resolution, which decreases its ability to capture events occurring in the fast phases of the cardiac cycle, such as isovolumetric relaxation. Hence, we have not assessed the LV untwist rate, which measures the diastolic LV back-rotation during the short isovolumetric relaxation period. However, we demonstrated good intra- and interobserver agreement of LV rotational measurements and between 3D-STI and cardiac MRI. Furthermore, we are confident that the ongoing development in echocardiographic imaging will augment the usability of this method in order to enable future studies.
Conclusion and Clinical Implications
The results of the present study demonstrated a clear relationship between LV torsion and disease severity, suggesting that LV torsion has strong prognostic relevance in DCM patients. The results of this study supported the idea that assessment of torsion should have more importance in first-line examinations of HF patients in the future. These findings underscored the importance of further characterizing and phenotyping DCM beyond EF. 3D-STI is a valuable and non-invasive tool in the diagnostic work-up of DCM to monitor changes in disease progression and has the potential to refine therapy guidance. Nevertheless, more studies are needed to comprehend the full clinical effect of LV torsion in DCM.
Acknowledgments
We thank J. Grundmann for assistance in the performance of CPET. Furthermore, we thank Baris Cansiz, from the Institute for Structural Analysis of the Technical University Dresden, Germany, for his critical contribution and intellectual input.
Disclosures
The Authors declare that there is no conflict of interest.
Funding
This research was supported by the Deutsche Forschungsgemeinschaft (DFG, KA 1163/18).
Supplementary Files
Please find supplementary file(s);
http://dx.doi.org/10.1253/circj.CJ-18-0986
References
- 1.
Sengupta PP, Tajik AJ, Chandrasekaran K, Khandheria BK. Twist mechanics of the left ventricle: Principles and application. JACC Cardiovasc Imaging 2008; 1: 366–376.
- 2.
Rüssel IK, Götte MJW, Bronzwaer JG, Knaapen P, Paulus WJ, van Rossum AC. Left ventricular torsion: An expanding role in the analysis of myocardial dysfunction. JACC Cardiovasc Imaging 2009; 2: 648–655.
- 3.
Beladan CC, Călin A, Roşca M, Ginghină C, Popescu BA. Left ventricular twist dynamics: Principles and applications. Heart 2014; 100: 731–740.
- 4.
van Dalen BM, Kauer F, Vletter WB, Soliman OII, van der Zwaan HB, ten Cate FJ, et al. Influence of cardiac shape on left ventricular twist. J Appl Physiol 2010; 108: 146–151.
- 5.
Sveric KM, Ulbrich S, Rady M, Ruf T, Kvakan H, Strasser RH, et al. Three-dimensional left ventricular torsion in patients with dilated cardiomyopathy: A marker of disease severity. Circ J 2017; 81: 529–536.
- 6.
Doucende G, Schuster I, Rupp T, Startun A, Dauzat M, Obert P, et al. Kinetics of left ventricular strains and torsion during incremental exercise in healthy subjects: The key role of torsional mechanics for systolic-diastolic coupling. Circ Cardiovasc Imaging 2010; 3: 586–594.
- 7.
Notomi Y, Srinath G, Shiota T, Martin-Miklovic MG, Beachler L, Howell K, et al. Maturational and adaptive modulation of left ventricular torsional biomechanics: Doppler tissue imaging observation from infancy to adulthood. Circulation 2006; 113: 2534–2541.
- 8.
Kim WJ, Lee BH, Kim YJ, Kang JH, Jung YJ, Song JM, et al. Apical rotation assessed by speckle-tracking echocardiography as an index of global left ventricular contractility. Circ Cardiovasc Imaging 2009; 2: 123–131.
- 9.
Hasselberg NE, Haugaa KH, Sarvari SI, Gullestad L, Andreassen AK, Smiseth OA, et al. Left ventricular global longitudinal strain is associated with exercise capacity in failing hearts with preserved and reduced ejection fraction. Eur Heart J Cardiovasc Imaging 2015; 16: 217–224.
- 10.
Franciosa JA, Park M, Barry Levine T. Lack of correlation between exercise capacity and indexes of resting left ventricular performance in heart failure. Am J Cardiol 1981; 47: 33–39.
- 11.
Stanton T, Leano R, Marwick TH. Prediction of all-cause mortality from global longitudinal speckle strain: Comparison with ejection fraction and wall motion scoring. Circ Cardiovasc Imaging 2009; 2: 356–364.
- 12.
Zhang KW, French B, May Khan A, Plappert T, Fang JC, Sweitzer NK, et al. Strain improves risk prediction beyond ejection fraction in chronic systolic heart failure. J Am Heart Assoc 2014; 3: 1–11.
- 13.
Cikes M, Solomon SD. Beyond ejection fraction: An integrative approach for assessment of cardiac structure and function in heart failure. Eur Heart J 2016; 37: 1642–1650.
- 14.
Mcmurray JJV, Adamopoulos S, Anker SD, Auricchio A, Böhm M, Dickstein K, et al. ESC Guidelines for the diagnosis and treatment of acute and chronic heart failure 2012. Eur J Heart Fail 2012; 14: 803–869.
- 15.
Evangelista A, Flachskampf F, Lancellotti P, Badano L, Aguilar R, Monaghan M, et al. European Association of Echocardiography recommendations for standardization of performance, digital storage and reporting of echocardiographic studies. Eur J Echocardiogr 2008; 9: 438–448.
- 16.
Kaku K, Takeuchi M, Tsang W, Takigiku K, Yasukochi S, Patel AR, et al. Age-related normal range of left ventricular strain and torsion using three-dimensional speckle-tracking echocardiography. J Am Soc Echocardiogr 2014; 27: 55–64.
- 17.
Obokata M, Nagata Y, Wu VCC, Kado Y, Kurabayashi M, Otsuji Y, et al. Direct comparison of cardiac magnetic resonance feature tracking and 2D/3D echocardiography speckle tracking for evaluation of global left ventricular strain. Eur Heart J Cardiovasc Imaging 2016; 17: 525–532.
- 18.
Izumo M, Lancellotti P, Suzuki K, Kou S, Shimozato T, Hayashi A, et al. Three-dimensional echocardiographic assessments of exercise-induced changes in left ventricular shape and dyssynchrony in patients with dynamic functional mitral regurgitation. Eur J Echocardiogr 2009; 10: 961–967.
- 19.
Gandrud C. simPH: An R package for showing estimates for interactive and nonlinear effects from Cox proportional hazard models. SSRN Electron J 2013; http://www.ssrn.com/abstract=2318977 (accessed August 29, 2018).
- 20.
Salgo IS, Tsang W, Ackerman W, Ahmad H, Chandra S, Cardinale M, et al. Geometric assessment of regional left ventricular remodeling by three-dimensional echocardiographic shape analysis correlates with left ventricular function. J Am Soc Echocardiogr 2012; 25: 80–88.
- 21.
Von Deuster C, Sammut E, Asner L, Nordsletten D, Lamata P, Stoeck CT, et al. Studying dynamic myofiber aggregate reorientation in dilated cardiomyopathy using in vivo magnetic resonance diffusion tensor imaging. Circ Cardiovasc Imaging 2016; 9: pii: e005018.
- 22.
Nielles-Vallespin S, Khalique Z, Ferreira PF, de Silva R, Scott AD, Kilner P, et al. Assessment of myocardial microstructural dynamics by in vivo diffusion tensor cardiac magnetic resonance. J Am Coll Cardiol 2017; 69: 661–676.
- 23.
Taylor RJ, Umar F, Lin ELS, Ahmed A, Moody WE, Mazur W, et al. Mechanical effects of left ventricular midwall fibrosis in non-ischemic cardiomyopathy. J Cardiovasc Magn Reson 2015; 18: 1.
- 24.
Yotti R, Bermejo J, Antoranz JC, Desco MM, Cortina C, Rojo-Álvarez JL, et al. A noninvasive method for assessing impaired diastolic suction in patients with dilated cardiomyopathy. Circulation 2005; 112: 2921–2929.
- 25.
Notomi Y, Popovic ZB, Yamada H, Wallick DW, Martin MG, Oryszak SJ, et al. Ventricular untwisting: A temporal link between left ventricular relaxation and suction. Am J Physiol Heart Circ Physiol 2007; 294: H505–H513.
- 26.
Saito M, Okayama H, Nishimura K, Ogimoto A, Ohtsuka T, Inoue K, et al. Determinants of left ventricular untwisting behaviour in patients with dilated cardiomyopathy: Analysis by two-dimensional speckle tracking. Heart 2009; 95: 290–296.
- 27.
Iwanaga Y, Nishi I, Furuichi S, Noguchi T, Sase K, Kihara Y, et al. B-type natriuretic peptide strongly reflects diastolic wall stress in patients with chronic heart failure: Comparison between systolic and diastolic heart failure. J Am Coll Cardiol 2006; 47: 742–748.
- 28.
Weiner RB, Weyman AE, Khan AM, Reingold JS, Chen-Tournoux AA, Scherrer-Crosbie M, et al. Preload dependency of left ventricular torsion: The impact of normal saline infusion. Circ Cardiovasc Imaging 2010; 3: 672–678.
- 29.
Stöhr EJ, González-Alonso J, Shave R. Left ventricular mechanical limitations to stroke volume in healthy humans during incremental exercise. Am J Physiol Heart Circ Physiol 2011; 301: H478–H487.
- 30.
Popescu BA, Beladan CC, Călin A, Muraru D, Deleanu D, Roşca M, et al. Left ventricular remodelling and torsional dynamics in dilated cardiomyopathy: Reversed apical rotation as a marker of disease severity. Eur J Heart Fail 2009; 11: 945–951.
- 31.
Hirata K, Hyodo E, Hozumi T, Kita R, Hirose M, Sakanoue Y, et al. Usefulness of a combination of systolic function by left ventricular ejection fraction and diastolic function by E/E’ to predict prognosis in patients with heart failure. Am J Cardiol 2009; 103: 1275–1279.
- 32.
Savarese G, Musella F, D’Amore C, Vassallo E, Losco T, Gambardella F, et al. Changes of natriuretic peptides predict hospital admissions in patients with chronic heart failure: A meta-analysis. JACC Heart Fail 2014; 2: 148–158.
- 33.
Kawata T, Daimon M, Kimura K, Nakao T, Lee SL, Hirokawa M, et al. Echocardiographic assessment of right ventricular function in routine practice: Which parameters are useful to predict one-year outcome in advanced heart failure patients with dilated cardiomyopathy? J Cardiol 2017; 70: 316–322.
- 34.
Francis DP, Shamim W, Davies LC, Piepoli MF, Ponikowski P, Anker SD, et al. Cardiopulmonary exercise testing for prognosis in chronic heart failure: Continuous and independent prognostic value from VE/VCO2 slope and peak VO2. Eur Heart J 2000; 21: 154–161.
- 35.
Clark AL, Poole-Wilson PA, Coats AJS. Exercise limitation in chronic heart failure: Central role of the periphery. J Am Coll Cardiol 1996; 28: 1092–1102.
- 36.
Kondo T, Yamada S, Asai C, Okumura T, Tanimura D, Murohara T. Skeletal muscle pump function is associated with exercise capacity in patients with heart failure. Circ J 2018; 82: 1033–1040.
- 37.
Fujisue K, Sugiyama S, Matsuzawa Y, Akiyama E, Sugamura K, Matsubara J, et al. Prognostic significance of peripheral microvascular endothelial dysfunction in heart failure with reduced left ventricular ejection fraction. Circ J 2015; 79: 2623–2631.


