Abstract
Background:
Carotid angioplasty and stenting (CAS) is emerging as an alternative treatment for carotid stenosis, but neointimal hyperplasia (NIH) remains a drawback of this treatment strategy. This study aimed to evaluate the effect of variations of carotid bifurcation geometry on local hemodynamics and NIH.
Methods and Results:
Hemodynamic and geometric effects on NIH were compared between 2 groups, by performing computational fluid dynamics (CFD) simulations both on synthetic models and patient-specific models. In the idealized models, multiple regression analysis revealed a significant negative relationship between internal carotid artery (ICA) angle and the local hemodynamics. In the patient-derived models, which were reconstructed from digital subtraction angiography (DSA) of 25 patients with bilateral CAS, a low time-average wall shear stress (TAWSS) and a high oscillatory shear index (OSI) were often found at the location of NIH. Larger difference values of the OSI percentage area (10.56±20.798% vs. −5.87±18.259%, P=0.048) and ECA/CCA diameter ratio (5.64±12.751% vs. −3.59±8.697%, P=0.047) were detected in the NIH-asymmetric group than in the NIH-symmetric group.
Conclusions:
Changes in carotid bifurcation geometry can make apparent differences in hemodynamic distribution and lead to bilateral NIH asymmetry. It may therefore be reasonable to consider certain geometric variations as potential local risk factors for NIH.
Atherosclerosis causes one-quarter of stroke cases worldwide.1
Traditionally, the indications for carotid angioplasty and stenting (CAS) have been limited to high-risk surgical patients,2
but CAS is currently being performed with increasing frequency, because it is minimally invasive,3
which brings extra attention to in-stent restenosis (ISR). Recurrent stenosis is a known risk factor of ipsilateral stroke,4–7
and the collective incidence of ISR varies from 1.6% to 24%.8–10
Several factors have been associated with restenosis after CAS, including advanced age, female sex, dyslipidemia, diabetes and the characteristics of the original plaques.11–16
ISR is mainly attributed to neointimal hyperplasia (NIH) in the early stage after the procedure. Local hemodynamic changes caused by geometric variations have been suggested as a key contributor to NIH.17
To evaluate the geometric parameters of the carotid artery, several imaging modalities, such as duplex scan, computed tomography angiography (CTA), magnetic resonance angiography (MRA), and digital subtraction angiography (DSA), have been used.18–23
Besides the obtaining of a direct diagnosis using a clinical imaging procedure, computational fluid dynamics (CFD) is a valuable means of simulating and analyzing the flow pattern of a particular vascular geometry,24–30
and finally revealing the associations among morphology, hemodynamic effects and NIH. In a recent study with a very small sample size (n=5),31
tortuosity was associated with blood flow ratio in the internal carotid artery (ICA), and the wall shear stress gradient (WSSG) was associated with restenosis.
Nowadays, stent geometry and strut configuration are attracting continual attention32–34
whereas CFD studies of the effects of hemodynamics caused by different carotid geometries on NIH appeals to a minority of researchers. In this study, we investigated the geometric effects on hemodynamics by performing CFD simulations in synthetic models of carotid bifurcation with 6 variations of geometric parameters, including ICA/common carotid artery (CCA) diameter ratio, external carotid artery (ECA)/CCA diameter ratio, sinus/CCA diameter ratio, ICA angle, tortuosity and planarity angle. Furthermore, in order to identify the effects of variations in carotid bifurcation geometry on intraindividual NIH asymmetry and to exclude the effects of other pathophysiological factors (e.g., hypertension, impaired vasoreactivity, preoperative carotid stenosis13,35), we collected the data of 25 patients with bilateral carotid NIH and classified them into NIH-symmetric and NIH-asymmetric groups according to the difference in NIH degree between the bilateral carotid arteries. CFD simulations were performed in these patient-specific models and the influence of both the geometric and hemodynamic parameters on NIH was explored and compared between the 2 groups.
Methods
Patients
The study group comprised 25 patients who underwent simultaneous bilateral carotid artery stent placement (SBCAS) between 2008 and 2016. Patient demographics are summarized in
Table 1. Stents were deployed to cover the stenosis sufficiently from the ICA to the CCA. These patients had undergone DSA before and after the CAS procedure. The post-procedural angiography was performed immediately after the CAS. According to previous research,36,37
ISR occur mostly within the first year after CAS, which was corroborated in the current patient cohort: the follow-up examinations were carried out after 8.02 (±3.097) months on average. The degree of ICA stenosis after stenting was measured using the NASCET criterion.38
The rate of stenosis development during the follow-up period was recorded accurately as the NIH rate. The study protocol was approved by the institutional ethics committee.
Table 1.
Demographics of the Study Population of NIH-Asymmetric and NIH-Symmetric Patients
| Parameter |
Statistics |
| NIH-asymmetric |
NIH-symmetric |
P value |
| n |
13 |
12 |
|
| Age, years |
66.08±7.170 |
66.33±5.449 |
0.921 |
| No. of male subjects (%) |
10 (76.92) |
12 (100.00) |
0.082 |
| BMI, kg/m2 |
22.53±3.071 |
25.69±2.296 |
0.011 |
| Blood pressure, mmHg |
| Systolic |
140.69±20.052 |
137.75±16.023 |
0.691 |
| Diastolic |
78.00±7.800 |
80.67±7.114 |
0.381 |
| Hypertension, % |
61.54 |
83.33 |
0.243 |
| Diabetes mellitus, % |
30.77 |
16.67 |
0.431 |
| Active smoker, % |
53.85 |
33.33 |
0.322 |
| History of TIA, % |
15.38 |
33.33 |
0.314 |
| History of stroke, % |
61.54 |
58.33 |
0.887 |
| Total cholesterol, mmol/L |
4.21±0.943 |
3.96±1.139 |
0.569 |
| Triglycerides, mmol/L |
1.26±0.607 |
2.00±1.021 |
0.038 |
| LDL, mmol/L |
2.52±0.759 |
2.40±0.982 |
0.774 |
| HDL, mmol/L |
1.16±0.238 |
0.93±0.162 |
0.012 |
| Fasting glucose, mmol/L |
5.78±1.544 |
5.39±1.064 |
0.470 |
Except for percentage, data are mean±SD. BMI, body mass index; HDL, high-density lipoprotein; LDL, low-density lipoprotein; NIH, neointimal hyperplasia; TIA, transient ischemic attack.
The benchmark model in this study was established according to the tuning-fork-sharped model of the average human carotid bifurcation (TF-AHCB).39
The original geometric values are presented in
Figure 1A. The arteries in the synthetic models were constructed as cylindrical pipes through the operation of sweep using Geometry (ANSYS, Version 17.0). A specific graph revolved around the center line of the ICA to form the sinus region. The CCA was modeled as a cylinder with a length of 13 mm. The ICA and CCA outlets were on the same horizontal plane in the benchmark model. That is, both the ICA and ECA outlets had a perpendicular distance of 47 mm to the CCA inlet. A constant diameter was assigned to the distal ICA and ECA, whereas the carotid sinus, which shared the same center line with the ICA, had a maximum diameter of 8.6 mm at the middle of the sinus axis.
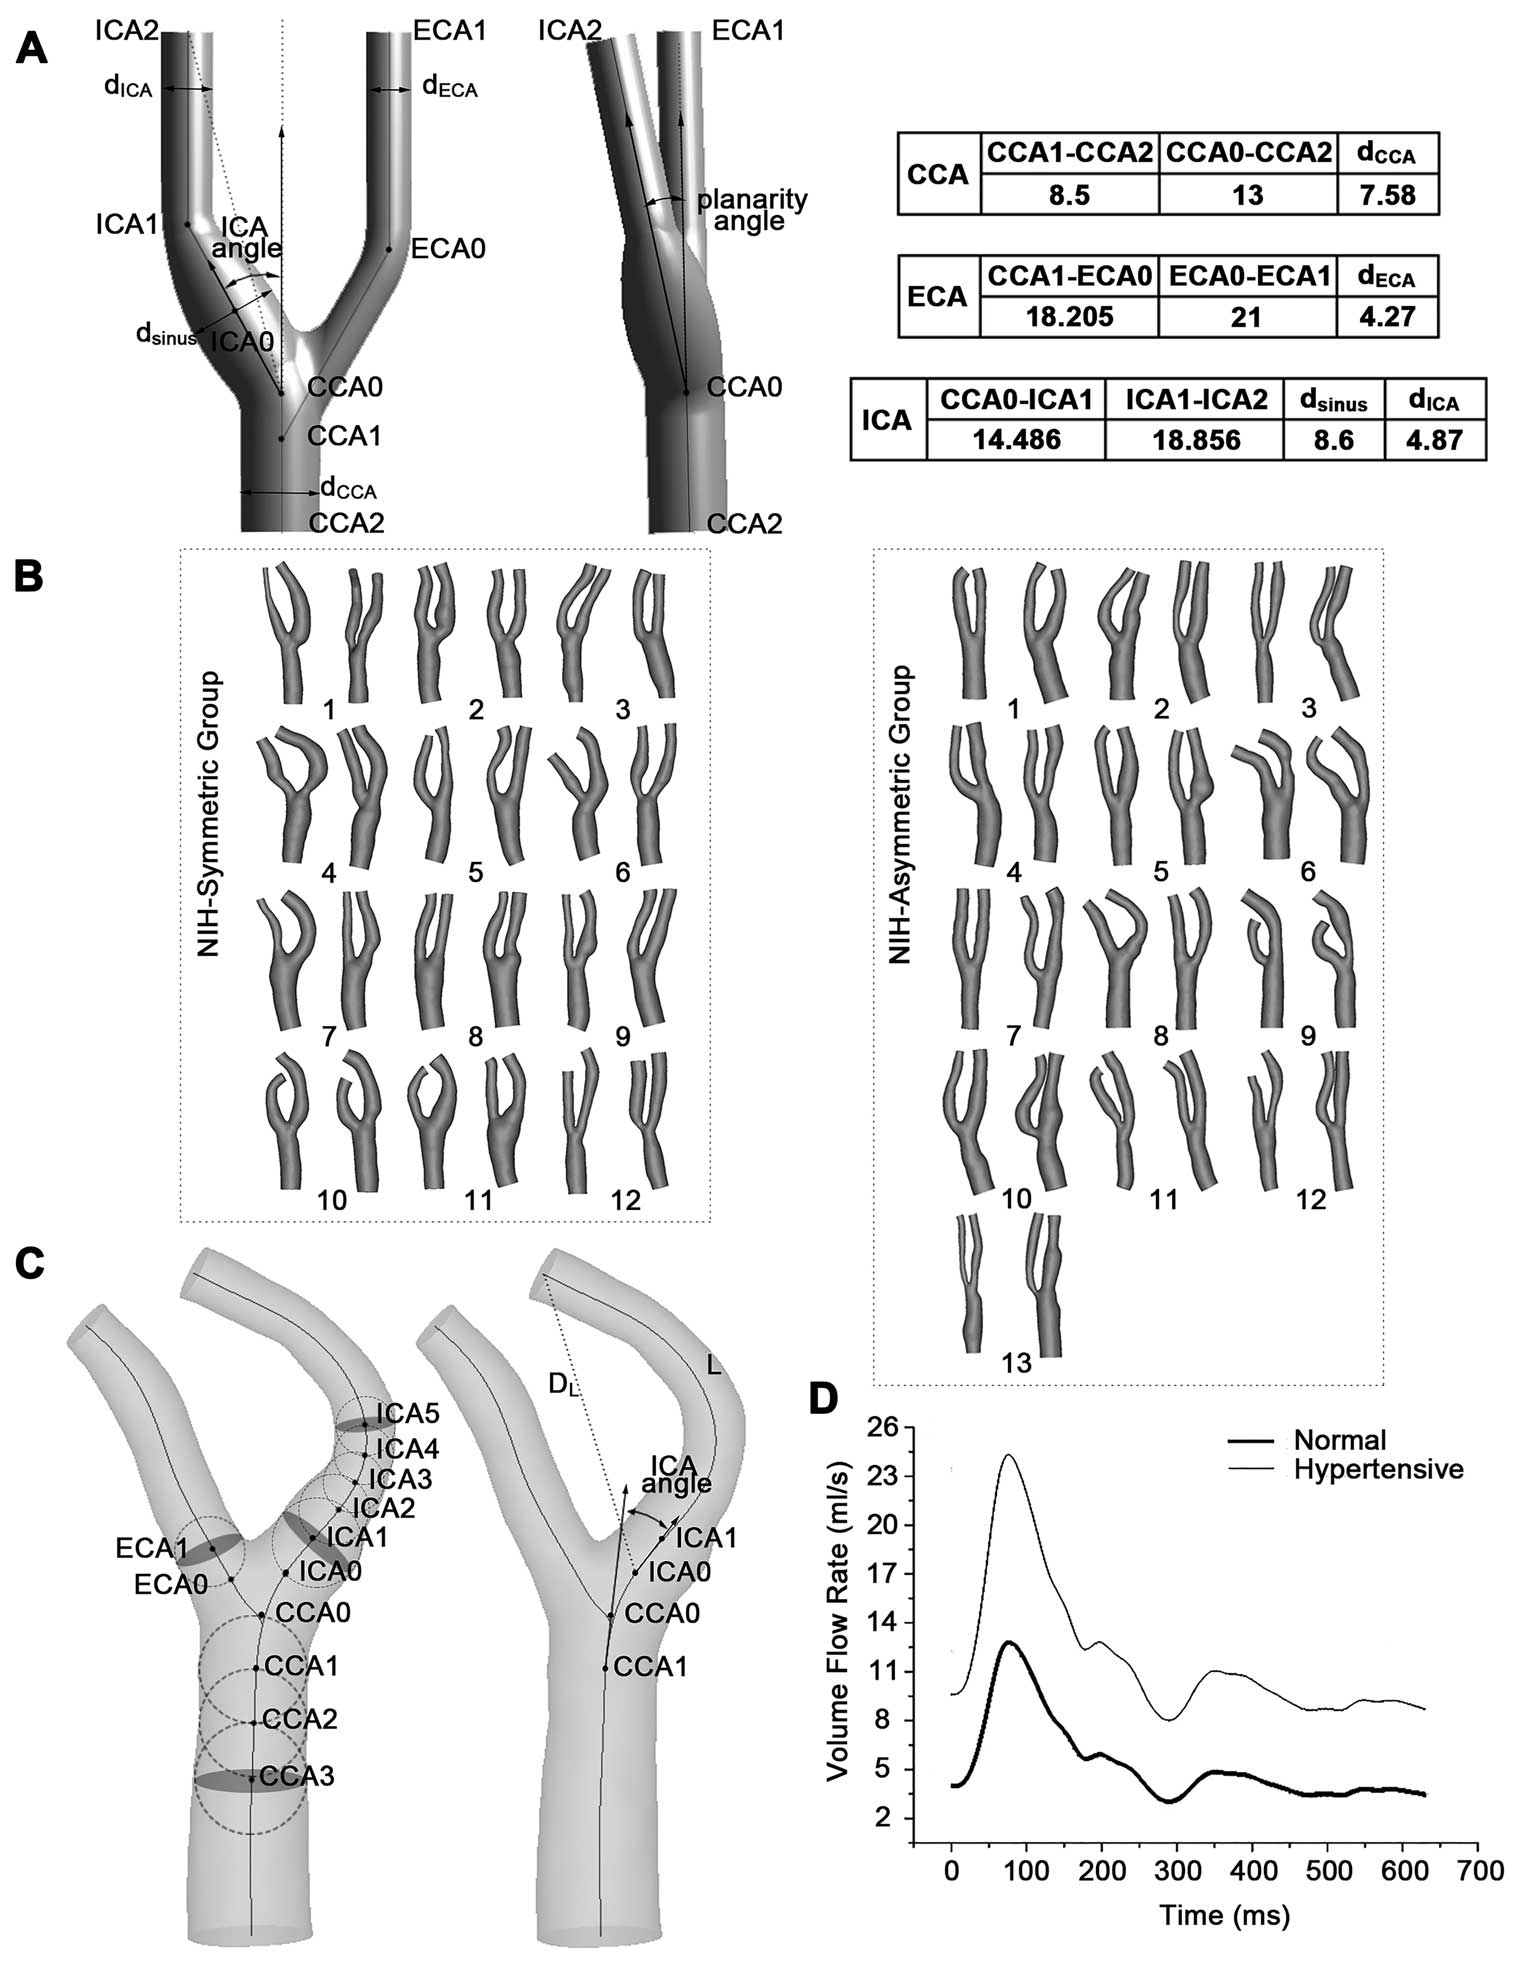
In addition to the synthetic models, patient-specific models were also reconstructed from DSA images for further quantitative analysis (Figure 1B). First, we extracted the carotid centerline from the anteroposterior and lateral views on the DSA images. Second, the diameter of the maximum inscribed circle was obtained by calculating the maximum connected domain. Finally, a 3D reconstruction was realized using a generalized cylinder model. CCA, ECA and ICA were assumed to be on the same plane, because the planarity angles of all subjects included in this study were close to zero. These initial reconstructed models were imported into MIMICS (Version 16.0) for subsequent optimization and morphological measurement. A representative geometry is shown in
Figure 1C. The definition of tortuosity40
in the patient-specific model was consistent with the ideal model and ICA0 was set as the origin of the branch. The vectors extending from the origins (CCA0, ICA0 and ECA0) to a point 1 sphere radius distal (CCA1, ICA1 and ECA1) were defined as the branch orientation. The ICA angle was referred to as the angle between the projections of the ICA and CCA vectors. The ICA/CCA diameter ratio was calculated as the diameter at point ICA5, divided by the CCA3 diameter. As the distal ICA diameter was referred to as ICA5, we used ICA1 to reflect the proximal ICA section in the definition of the sinus/CCA diameter ratio. The ECA/CCA diameter ratio in the patient-specific model was represented as the ratio between the ECA1 and CCA3 diameters.
CFD Analysis
Tetrahedral-element meshes were generated by ICEM CFD (ANSYS, Version 17.0) using a maximum element size of 0.5 mm and a minimum size of 0.2 mm, which were confirmed to be sufficient by performing a denser mesh.
Blood was assumed to be a Newtonian fluid in large blood vessels because the size of blood cells was small enough compared with the diameter of the tubes.41
Blood was modeled to have a density of 1,056 kg/m3
and a viscosity of 0.0035 Pa · s in the present simulation. The arterial wall was assumed to be rigid without displacement.
The inlet pulsatile flow rates were assumed to be consistent in normal subjects. For hypertensive individuals, the interval conversion method was used to adjust the inlet waveform (Figure 1D). In this situation, the normal blood pressure category was 120/80 mmHg and all hypertensive patients were considered as having stage 2 hypertension with 160/100 mmHg.42
The pressures at the ICA and ECA outlets were set to be equal to 75 mmHg. To ensure a consistent axial extent for all 25 pairs of arteries, the ICA branch was clipped 30 mm away from CCA0 while the CCA inlet had a straight-line distance of 20 mm with CCA origin.
Transient CFD simulation was processed with Fluent (ANSYS, Version 17.0) for 1 cardiac cycle with a time step of 0.00628 s. The convergence criterion was satisfied when the residual of continuity was less than 10−4.
The surface distributions of the 3 hemodynamic parameters (TAWSS, OSI and TAWSSG) were computed for each CFD model. The detailed descriptions and explanations of these hemodynamic parameters are provided in
Supplementary Materials.
Statistical Analysis
The carotid sinus was chosen as the region of interest (ROI) for the synthetic models, whereas in the patient-specific models, the original areas of stenosis before CAS were the focus.
The identified threshold values of the hemodynamic parameters were calculated by pooling all data from 50 carotid ROIs, following the method of Stone et al.43
Next, the threshold value (20%) was chosen to find the 20% of cumulative surface with the lowest TAWSS and highest OSI and TAWSSG. These thresholds identified the cutoff values for low TAWSS (synthetic models: 0.185 Pa; patient-specific models: 1.680 Pa), high OSI (synthetic models: 0.221; patient-specific models: 0.006) and high TAWSSG (synthetic models: 3,913.751 Pa/m; patient-specific models: 66,265.89 Pa/m). For each CFD model, its surface area (SA) exposed to TAWSS below (and OSI, TAWSSG above) the respective threshold values was used for further quantitative analysis. Finally, to eliminate the ill effect of arterial size, a percent area (PA) calculated as SA divided by the total area of ROI in each model was adopted.
Multiple linear regression was used to quantify the relationship between the hemodynamic parameters and geometric variables in the synthetic models. The overall quality of regression was assessed by Pearson’s correlation coefficient, adjusted by the number of independent predictors (R2adj). The relative contributions of the geometric variables were identified by the standardized regression coefficients (β).
In the patient-specific simulations, subjects with difference values of bilateral NIH (DVNIH) <5% were considered as NIH-symmetric individuals while patients with DVNIH
≥5% were classified as NIH-asymmetric. The intraindividual difference values (between bilateral carotid arteries) of both the hemodynamic and morphological parameters were calculated for independent-sample t-test between the NIH-symmetric and NIH-asymmetric groups. P<0.05 was regarded as statistically significant. Statistical analyses were carried out using SPSS (Version 19).
Results
Synthetic Models: Univariate and Multivariate Analyses
Simulations and analyses were performed for a wide range of geometric parameters, including diameter ratios (ICA/CCA diameter ratio: 0.64±0.079, ECA/CCA diameter ratio: 0.56±0.079, sinus/CCA diameter ratio: 1.13±0.079) and angles (ICA angle: 30±15.81°, tortuosity: 0.074±0.055, planarity angle: 10±7.90°).
Figure 2
presents a histogram of the relative areas in the different synthetic models. Multiple regressions (Table 2) revealed that the ICA angle may be a far stronger predictor of the hemodynamic environment on the sinus wall. It presented negative correlations with PATAWSS
(β=−0.681, P<0.001), PAOSI
(β=−0.789, P<0.001) and PATAWSSG
(β=−0.596, P=0.001) respectively. That is, the distribution of pathogenic flow dynamics may be relieved with an increasing ICA angle. The sinus/CCA diameter ratio had a significant relationship with PATAWSS
(β=0.296, P=0.020). Moreover, there was a strong positive correlation (β=0.308, P=0.016) between the ECA/CCA diameter ratio and PATAWSS,
but this geometric variation had an inverse effect on PATAWSSG
(β=−0.342, P=0.042).
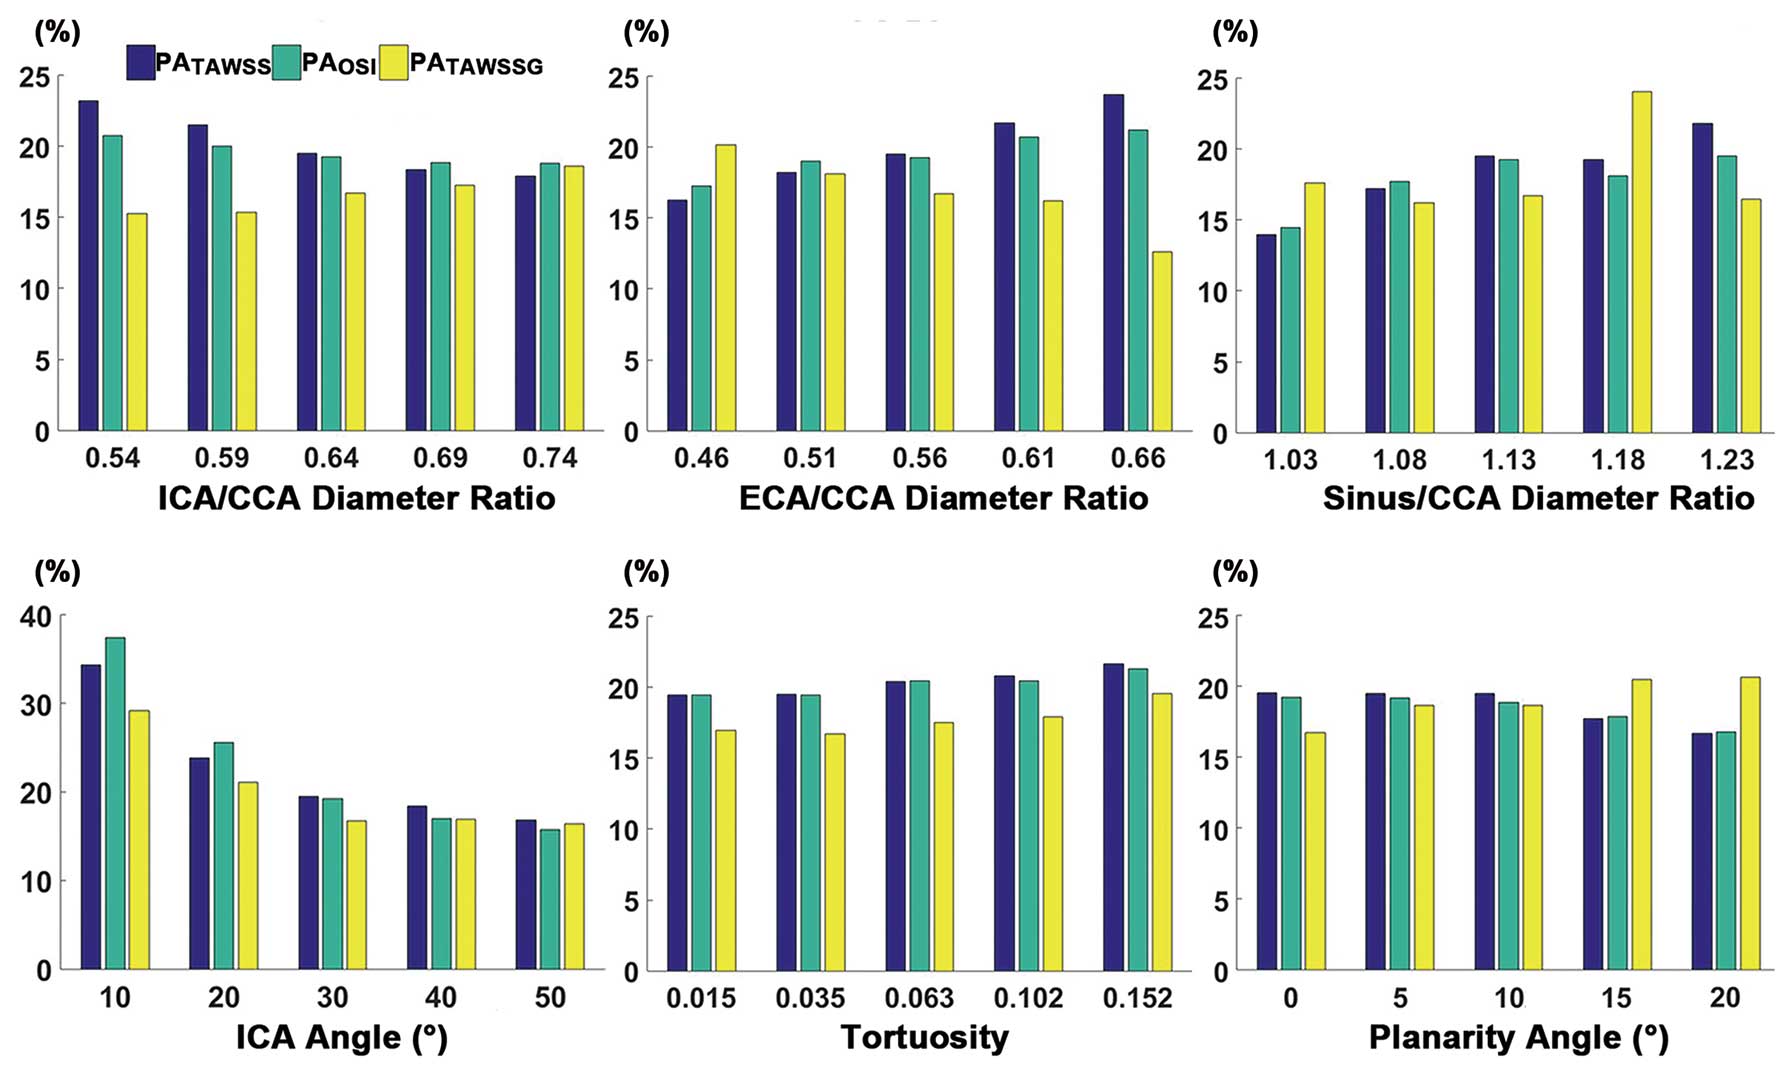
Table 2.
Multiple Linear Regression of PA (%) With Geometric Variations in the Synthetic Models
| |
PATAWSS |
PAOSI |
PATAWSSG |
| Model quality |
| R2adj |
0.679 |
0.618 |
0.416 |
| P value |
<0.001 |
<0.001 |
0.012 |
| ICA/CCA diameter ratio |
| β |
−0.231 |
−0.076 |
0.172 |
| P value |
0.061 |
0.556 |
0.286 |
| ECA/CCA diameter ratio |
| β |
0.308 |
0.145 |
−0.342 |
| P value |
0.016 |
0.265 |
0.042 |
| Sinus/CCA diameter ratio |
| β |
0.296 |
0.158 |
0.112 |
| P value |
0.020 |
0.226 |
0.482 |
| ICA angle |
| β |
−0.681 |
−0.789 |
−0.596 |
| P value |
<0.001 |
<0.001 |
0.001 |
| Tortuosity |
| β |
0.075 |
0.062 |
0.079 |
| P value |
0.525 |
0.633 |
0.622 |
| Planarity angle |
| β |
−0.225 |
−0.181 |
0.212 |
| P value |
0.069 |
0.171 |
0.194 |
Values are ICA/CCA diameter ratio, ECA/CCA diameter ratio, sinus/CCA diameter ratio, ICA angle (°), tortuosity and planarity angle (°). PATAWSS, PAOSI, and PATAWSSG
respectively indicate a relative area of low TAWSS, high OSI and high TAWSSG in the region of interest. CCA, common carotid artery; ECA, external carotid artery; ICA, internal carotid artery; OSI, oscillatory shear index; PA, percent area; TAWSS, time-average wall shear stress; TAWSSG, time-average spatial wall shear stress gradient.
The 50 carotid bifurcation models with various morphological characteristics (ICA/CCA diameter ratio: 0.62±0.128, ECA/CCA diameter ratio: 0.52±0.117, sinus/CCA diameter ratio: 0.65±0.167, ICA angle: 26.38±15.424°, tortuosity: 0.04±0.058) were evaluated using CFD simulations.
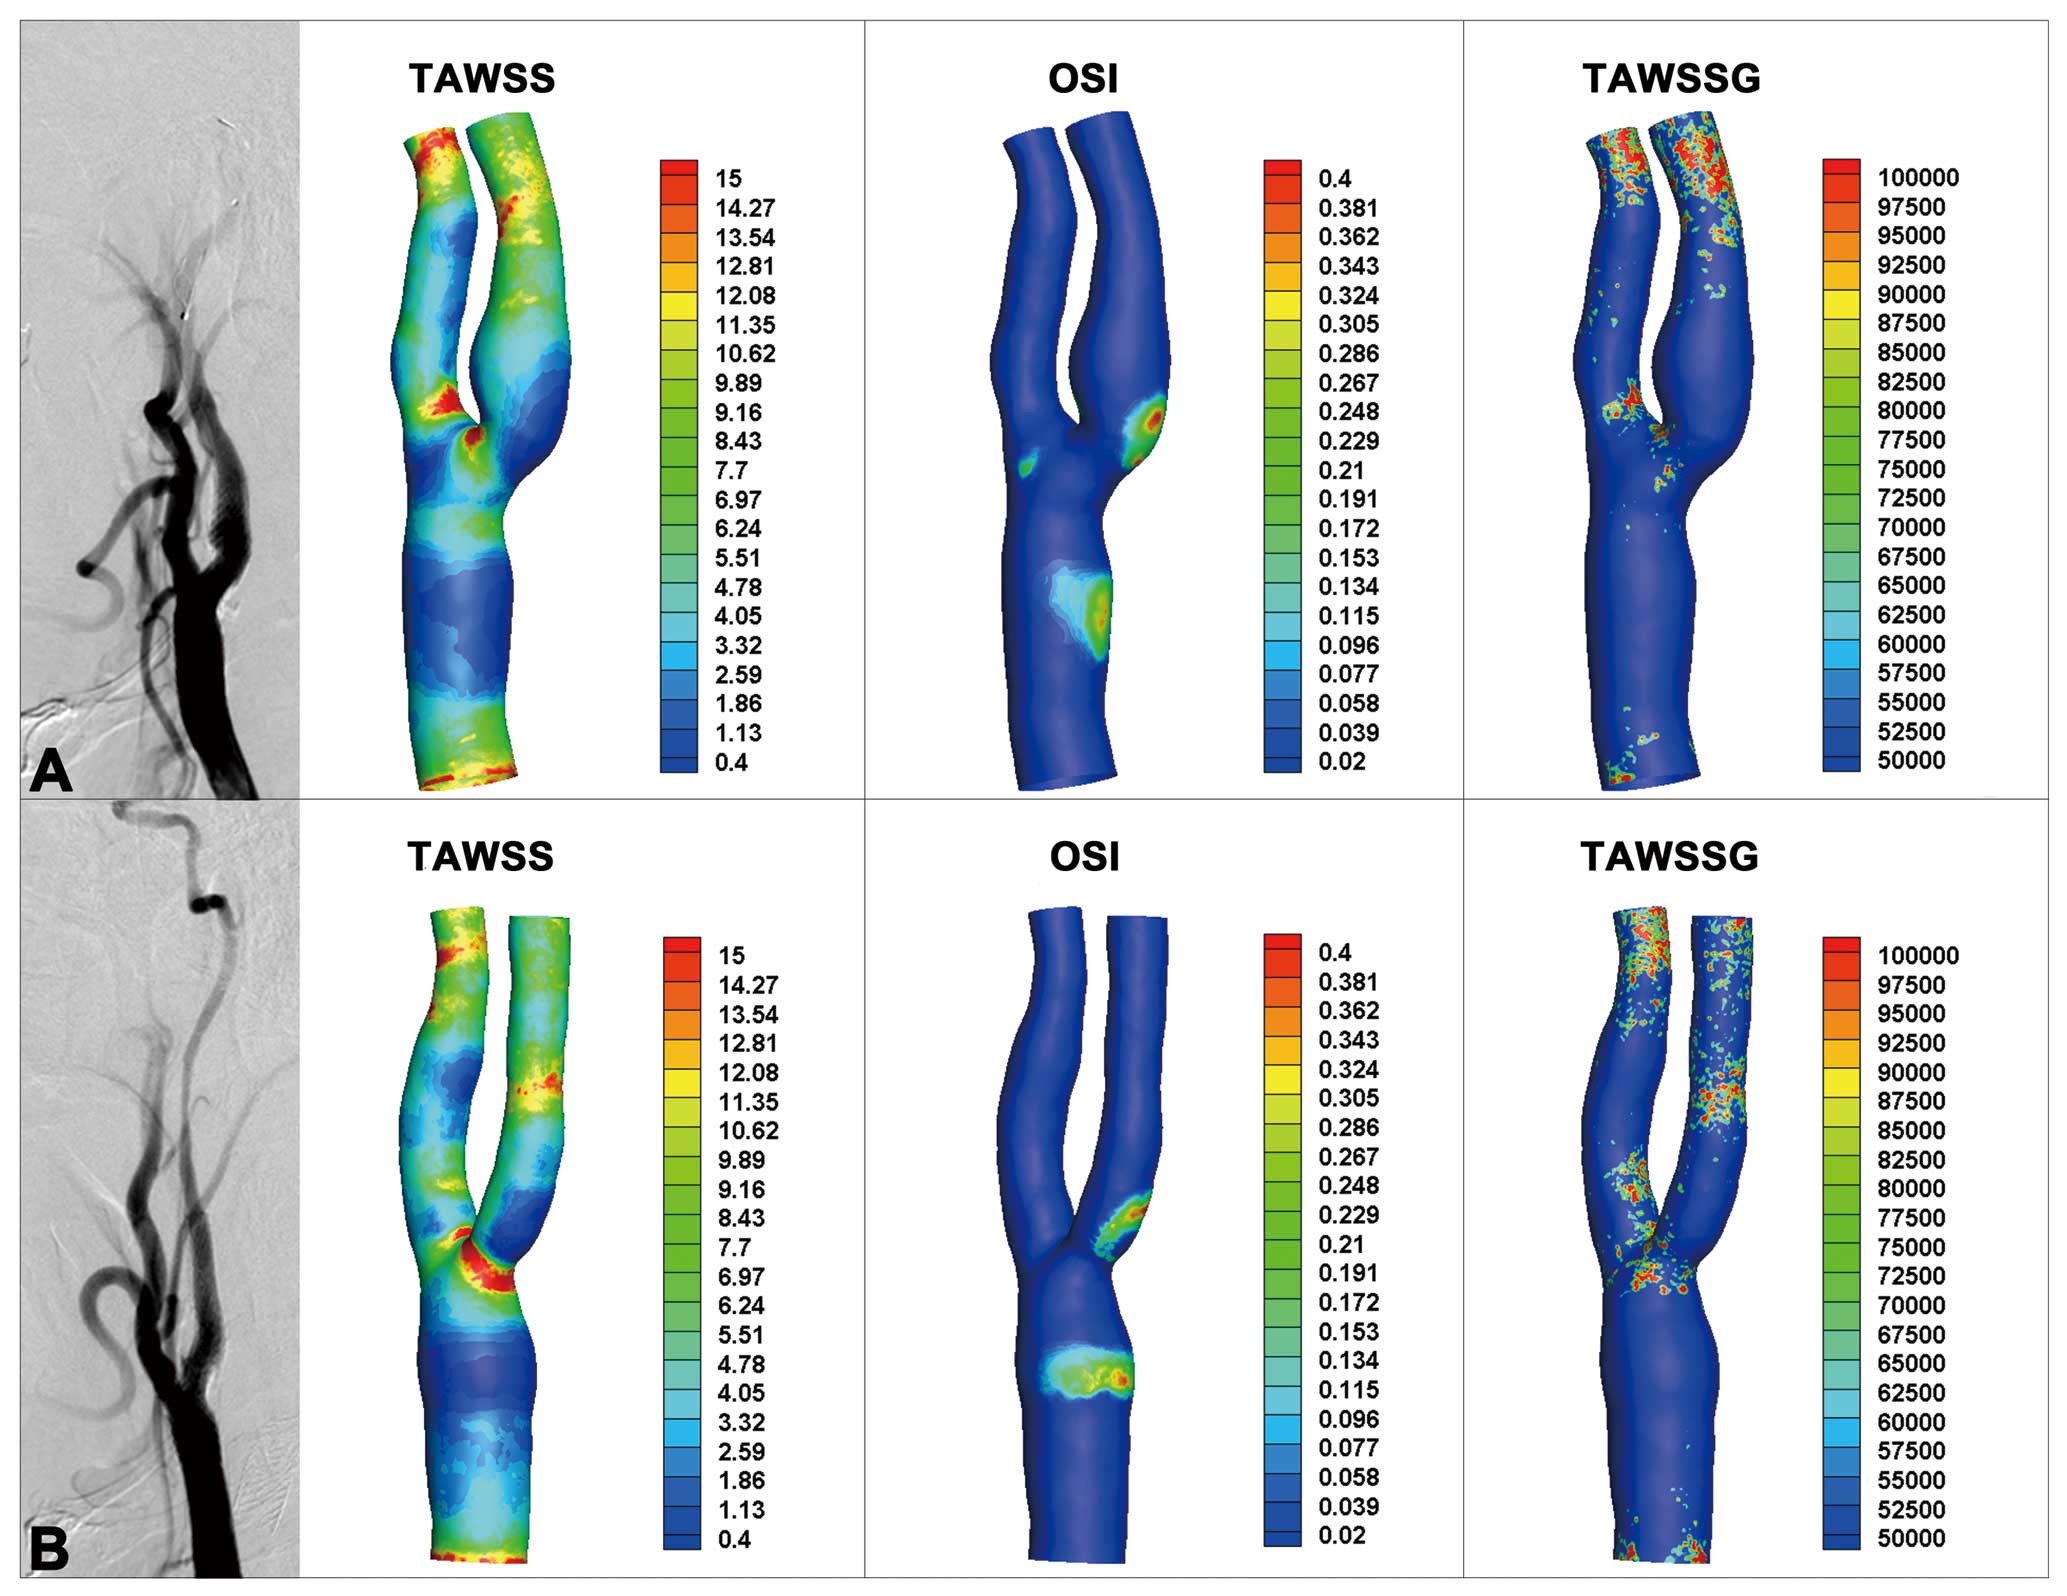
Figure 3
shows a pair of carotid arteries from a patient who underwent SBCAS. The regions indicated by dark blue in the TAWSS distribution are TAWSS lower than the critical value of 0.4 Pa, while the red color represents an OSI >0.4 or TAWSSG >105
Pa/m in the distribution maps of OSI and TAWSSG respectively. For the bilateral arteries, there were distributions of low TAWSS and high OSI on the outer wall of the carotid sinus, because the flow separation in this area would induce flow reversal stagnation point flow. As a contrast, high TAWSSG just occurred at the distal branches and artery crotches. Regions with low TAWSS and high OSI appeared on the sinus, which was consistent with the location of neointima.
As shown in
Table 3, NIH-asymmetric and NIH-symmetric patients presented a statistical difference of the OSI percentage area (10.56±20.798% vs. −5.87±18.259%, P=0.048) and ECA/CCA diameter ratio (5.64±12.751% vs. −3.59±8.697%, P=0.047). Patients with different NIH rates between the bilateral carotid arteries had larger difference values of PAOSI
and ECA/CCA diameter ratio.
Table 3.
Descriptive Statistics for Hemodynamic and Geometric Parameters in the NIH-Asymmetric vs. NIH-Symmetric Group
| Parameter |
NIH-asymmetric |
NIH-symmetric |
P value |
| n |
13 |
12 |
|
| PATAWSS |
−1.94±23.269 |
−8.24±15.796 |
0.440 |
| PAOSI |
10.56±20.798 |
−5.87±18.259 |
0.048 |
| PATAWSSG |
1.20±7.724 |
2.22±20.591 |
0.874 |
| ICA/CCA diameter ratio |
−0.49±17.896 |
−2.90±13.352 |
0.708 |
| ECA/CCA diameter ratio |
5.64±12.751 |
−3.59±8.697 |
0.047 |
| Sinus/CCA diameter ratio |
−7.12±19.886 |
−9.53±22.646 |
0.780 |
| ICA angle |
5.37±24.837 |
1.30±23.778 |
0.680 |
| Tortuosity |
−0.45±5.587 |
−1.30±7.362 |
0.747 |
Data are mean±SD. Values are intraindividual differences of parameters including PATAWSS, PAOSI, PATAWSSG, ICA/CCA diameter ratio, ECA/CCA diameter ratio, sinus/CCA diameter ratio and tortuosity (%) and ICA angle (°). PATAWSS, PAOSI, and PATAWSSG
respectively indicate a relative area of low TAWSS, high OSI and high TAWSSG in the region of interest. Other abbreviations as in Tables 1,2.
Discussion
It is acknowledged that DSA is the gold standard investigation to assess stenosis of the carotid vessels, so morphological measurement based on this imaging modality is widely accepted in clinical research.20–22
We previously compared the reproducibility of different image-based (e.g., CTA and/or MRA data) computational models of cerebral arteries.44
In the present study, to assess the morphological measurement of carotid artery geometry more precisely, we used DSA data for 25 SBCAS patients to compare the hemodynamic and geometric effects on NIH rates between bilateral stents.
It is widely accepted that the distribution of flow dynamics can predict the likely location of restenosis. However, in the current study, significant correlation was not found between the hemodynamic parameters (TAWSS, OSI and TAWSSG) and the neointima (P=0.445, 0.510, 0.788, respectively). Nevertheless, the flow distribution shown in
Figure 3
suggested that carotid regions with a low TAWSS and a high OSI were prone to neointimal proliferation. According to the comparison of the NIH-asymmetric and the NIH-symmetric groups, OSI was the most significant predictor of NIH asymmetry (10.56±20.798% vs. −5.87±18.259%, P=0.048). Patients with different NIH rates had a large difference value of PAOSI, whereas this parameter in the NIH-symmetric group was smaller. It indicated that OSI may be an essential factor for intraindividual asymmetry of bilateral NIH.
Analysis of the synthetic models revealed that the ICA angle had a significant correlation with OSI, which suggested that the ICA angle may be considered an essential geometric risk factor for NIH asymmetry. Harrison and Marshall found no significant difference between the bifurcation angles of normal patients vs. those with stenosis,20
but the important role of branch angle has been suggested in several studies.45–47
Moreover, as shown in
Table 3, there was a significant difference in the ECA/CCA diameter ratio (5.64±12.751% vs. −3.59±8.697%, P=0.047) between the 2 groups. Diversity in the diameter of ECA would affect the split ratio between the 2 carotid branches, which indicated a prominent effect of the ECA/CCA diameter ratio on stenosis. Results of the synthetic models also showed that the ECA/CCA diameter ratio had contradictory effects on TAWSS and TAWSSG. A recent study revealed that patients with stenotic atheromatous vessels had smaller diameters of the ECA,48
but the influence of ECA diameter on ICA neointimal proliferation deserves further study.
Statistical analysis was also conducted between the NIH-with (NIH rate ≥5%) and NIH-without (NIH rate <5%) groups. The 50 carotid artery models were classified into 2 groups according to the rate of stenosis development during the follow-up period. As shown in
Table 4, statistical difference only appeared in the ICA/CCA diameter ratio (59.12±11.188% vs. 67.00±14.413%, P=0.035), which indicated the hindering effect of downstream narrowing. However, the P values for OSI and the ECA/CCA diameter ratio showed that these 2 risk factors of NIH asymmetry might not be significant (P=0.891, 0.411, respectively) predictors of severe NIH.
Table 4.
Descriptive Statistics for Hemodynamic and Geometric Parameters in the NIH-With vs. NIH-Without Group
| Parameter |
NIH-with |
NIH-without |
P value |
| n |
27 |
23 |
|
| PATAWSS |
18.66±17.821 |
22.90±20.967 |
0.443 |
| PAOSI |
20.91±16.090 |
20.23±18.844 |
0.891 |
| PATAWSSG |
20.93±12.782 |
19.34±17.388 |
0.713 |
| ICA/CCA diameter ratio |
59.12±11.188 |
67.00±14.413 |
0.035 |
| ECA/CCA diameter ratio |
53.69±11.828 |
50.93±11.657 |
0.411 |
| Sinus/CCA diameter ratio |
61.64±14.863 |
68.96±18.155 |
0.124 |
| ICA angle |
29.40±15.793 |
22.84±14.518 |
0.135 |
| Tortuosity |
4.14±5.096 |
4.84±6.601 |
0.673 |
Data are mean±SD. Values are PATAWSS, PAOSI, PATAWSSG, ICA/CCA diameter ratio, ECA/CCA diameter ratio, sinus/CCA diameter ratio and tortuosity (%) and ICA angle (°). PATAWSS, PAOSI, and PATAWSSG
respectively indicate a relative area of low TAWSS, high OSI and high TAWSSG in the region of interest. Other abbreviations as in Tables 1,2.
One limitation of this study is that a few modeling assumptions were made to simplify the analysis. For example, the arterial wall was considered as rigid with no slip, which is contrary to the elasticity of real vessels. Secondly, the sample size of the retrospective study was relatively small. Prospective randomized studies with a larger sample size will be addressed to investigate the potential role of geometry in NIH. Thirdly, the asymmetry of upstream hemodynamics was ignored in this study because simulations were mainly focused on carotid bifurcation downstream. The upstream risk factors of NIH, such as the discontinuity of atherosclerosis, tortuosity or aortic stenosis, should be discussed in further studies. Fourthly, the patient-derived arterial models were reconstructed from DSA image data, which lack some 3D information about bifurcation morphology. Studies based on CTA or MRA may provide supplementary results regarding the influence of bifurcation geometry on carotid NIH.
Conclusion
This retrospective study carried out a morphometric analysis of carotid artery bifurcation using synthetic simulations and patient-specific models reconstructed from DSA images to investigate the effects of carotid geometry on NIH. Several geometric variations, such as sinus/CCA diameter ratio, ECA/CCA diameter ratio, and ICA angle, were suggested as important parameters by multiple linear regression analysis of the synthetic models. In addition, 25 follow-up subjects were classified into NIH-symmetric and NIH-asymmetric groups according to the different rates of NIH in the bilateral carotid arteries. Flow distribution of the patients’ carotid arteries indicated a low TAWSS and a high OSI as predictors of neointima development, and statistical differences were found in the PAOSI
and ECA/CCA diameter ratio between the 2 groups. Therefore, the ICA angle and ECA/CCA diameter ratio may be noteworthy characteristics of the carotid arteries that can predict asymmetric NIH.
Acknowledgments
We thank all participants of the study.
Disclosures
The authors report no conflict of interest concerning the materials or methods used in this study or the findings specified in this paper.
Sources of Funding
This research is supported by the National Basic Research Program of China (973 program) [grant number 2013CB733800], the National Nature Science Foundation of China [grant numbers 61821002, 11422222, 11302050, 11772093], the Fundamental Research Funds for the Central Universities, the National Demonstration Center for Experimental Biomedical Engineering Education (Southeast University), the Funds for Young Zhishan Scholors (Southeast University), and ARC [grant number FT140101152].
Supplementary Files
Please find supplementary file(s);
http://dx.doi.org/10.1253/circj.CJ-18-1152
References
- 1.
Ruan L, Chen W, Srinivasan SR, Sun M, Wang H, Toprak A, et al. Correlates of common carotid artery lumen diameter in black and white younger adults: The Bogalusa Heart Study. Stroke 2009; 40: 702–707.
- 2.
Bates ER, Babb JD, Casey DE, Cates CU, Duckwiler GR, Feldman TE, et al. ACCF/SCAI/SVMB/SIR/ASITN 2007 clinical expert consensus document on carotid stenting: A report of the American College of Cardiology Foundation Task Force on Clinical Expert Consensus Documents (ACCF/SCAI/SVMB/SIR/ASITN Clinical Expert Consensus Document Committee on Carotid Stenting). J Am Coll Cardiol 2007; 49: 126–170.
- 3.
Brott TG, Hobson RW, Howard G, Roubin GS, Clark WM, Brooks W, et al. Stenting versus endarterectomy for treatment of carotid-artery stenosis. N Engl J Med 2010; 363: 11–23.
- 4.
Misaki K, Uchiyama N, Mohri M, Hayashi Y, Ueda F, Nakada M. Prediction of carotid artery in-stent restenosis by quantitative assessment of vulnerable plaque using computed tomography. J Neuroradiol 2016; 43: 18–24.
- 5.
Matsumoto H, Yako R, Masuo O, Hirayama K, Uematsu Y, Nakao N. A case of in-stent neoatherosclerosis 10 years after carotid artery stent implantation: Observation with optical coherence tomography and plaque histological findings. Neurol Med-Chir 2014; 54: 139–144.
- 6.
Bonati LH, Ederle J, McCabe DJH, Dobson J, Featherstone RL, Gaines PA, et al. Long-term risk of carotid restenosis in patients randomly assigned to endovascular treatment or endarterectomy in the Carotid and Vertebral Artery Transluminal Angioplasty Study (CAVATAS): Long-term follow-up of a randomised trial. Lancet Neurol 2009; 8: 908–917.
- 7.
Bonati LH, Gregson J, Dobson J, McCabe DJH, Nederkoorn PJ, van der Worp HB, et al. Restenosis and risk of stroke after stenting or endarterectomy for symptomatic carotid stenosis in the International Carotid Stenting Study (ICSS): Secondary analysis of a randomised trial. Lancet Neurol 2018; 17: 587–596.
- 8.
de Donato G, Setacci C, Deloose K, Peeters P, Cremonesi A, Bosiers M. Long-term results of carotid artery stenting. J Vasc Surg 2008; 48: 1431–1440.
- 9.
de Borst GJ, Ackerstaff RGA, de Vries JPPM, Pavoordt EDV, Vos JA, Overtoom TT, et al. Carotid angioplasty and stenting for postendarterectomy stenosis: Long-term follow-up. J Vasc Surg 2007; 45: 118–123.
- 10.
Dai ZZ, Xu GL. Restenosis after carotid artery stenting. Vascular 2017; 25: 576–586.
- 11.
Shankar JJS, Zhang JW, dos Santos M, Lesiuk H, Mohan R, Lum C. Factors affecting long-term restenosis after carotid stenting for carotid atherosclerotic disease. Neuroradiology 2012; 54: 1347–1353.
- 12.
Shinozaki N, Ogata N, Ikari Y. Plaque protrusion detected by intravascular ultrasound during carotid artery stenting. J Stroke Cerebrovasc Dis 2014; 23: 2622–2625.
- 13.
Zapata-Arriaza E, Moniche F, Gonzalez A, Bustamante A, Escudero-Martinez I, Laviana FJD, et al. Predictors of restenosis following carotid angioplasty and stenting. Stroke 2016; 47: 2144–2147.
- 14.
Lal BK, Beach KW, Roubin GS, Lutsep HL, Moore WS, Malas MB, et al. Restenosis after carotid artery stenting and endarterectomy: A secondary analysis of CREST, a randomised controlled trial. Lancet Neurol 2012; 11: 755–763.
- 15.
Barros P, Felgueiras H, Pinheiro D, Guerra M, Gama V, Veloso M. Restenosis after carotid artery stenting using a specific designed ultrasonographic protocol. J Stroke Cerebrovasc Dis 2014; 23: 1416–1420.
- 16.
Arquizan C, Trinquart L, Touboul PJ, Long A, Feasson S, Terriat B, et al. Restenosis is more frequent after carotid stenting than after endarterectomy: The EVA-3S study. Stroke 2011; 42: 1015–1020.
- 17.
Birchall D, Zaman A, Hacker J, Davies G, Mendelow D. Analysis of haemodynamic disturbance in the atherosclerotic carotid artery using computational fluid dynamics. Eur Radiol 2006; 16: 1074–1083.
- 18.
Phan TG, Beare RJ, Jolley D, Das G, Ren M, Wong K, et al. Carotid artery anatomy and geometry as risk factors for carotid atherosclerotic disease. Stroke 2012; 43: 1596–1601.
- 19.
Bijari PB, Wasserman BA, Steinman DA. Carotid bifurcation geometry is an independent predictor of early wall thickening at the carotid bulb. Stroke 2014; 45: 473–478.
- 20.
Does the geometry of the carotid bifurcation affect its predisposition to atheroma? Stroke 1983; 14: 117–118.
- 21.
Fisher M, Fieman S. Geometric factors of the bifurcation in carotid atherogenesis. Stroke 1990; 21: 267–271.
- 22.
Schulz UGR, Rothwell PM. Major variation in carotid bifurcation anatomy: A possible risk factor for plaque development? Stroke 2001; 32: 2522–2529.
- 23.
Yoshida K, Fukumitsu R, Kurosaki Y, Funaki T, Kikuchi T, Takahashi JC, et al. The association between expansive arterial remodeling detected by high-resolution MRI in carotid artery stenosis and clinical presentation. J Neurosurg 2015; 123: 434–440.
- 24.
Zhao SZ, Ariff B, Long Q, Hughes AD, Thom SA, Stanton AV, et al. Inter-individual variations in wall shear stress and mechanical stress distributions at the carotid artery bifurcation of healthy humans. J Biomech 2002; 35: 1367–1377.
- 25.
Zhu F, Qian Y, Xu B, Gu Y, Karunanithi K, Zhu W, et al. Quantitative assessment of changes in hemodynamics of the internal carotid artery after bypass surgery for moyamoya disease. J Neurosurg 2018; 129: 677–683.
- 26.
Xue YJ, Gao PY, Duan Q, Lin Y, Dai CB. Preliminary study of hemodynamic distribution in patient-specific stenotic carotid bifurcation by image-based computational fluid dynamics. Acta Radiol 2008; 49: 558–565.
- 27.
Nguyen KT, Clark CD, Chancellor TJ, Papavassiliou DV. Carotid geometry effects on blood flow and on risk for vascular disease. J Biomech 2008; 41: 11–19.
- 28.
Lee SW, Antiga L, Spence JD, Steinman DA. Geometry of the carotid bifurcation predicts its exposure to disturbed flow. Stroke 2008; 39: 2341–2347.
- 29.
Markl M, Wegent F, Zech T, Bauer S, Strecker C, Schumacher M, et al. In vivo wall shear stress distribution in the carotid artery: Effect of bifurcation geometry, internal carotid artery stenosis, and recanalization therapy. Circ Imaging 2010; 3: 647–655.
- 30.
Lauric A, Hippelheuser JE, Malek AM. Induction of aneurysmogenic high positive wall shear stress gradient by wide angle at cerebral bifurcations, independent of flow rate. J Neurosurg 2018; 1: 1–11.
- 31.
Uemiya N, Lee CJ, Ishihara S, Yamane F, Zhang Y, Qian Y. Analysis of restenosis after carotid artery stenting: Preliminary results using computational fluid dynamics based on three-dimensional angiography. J Clin Neurosci 2013; 20: 1582–1587.
- 32.
Kouvelos GN, Patelis N, Antoniou GA, Lazaris A, Matsagkas MI. Meta-analysis of the effect of stent design on 30-day outcome after carotid artery stenting. J Endovasc Ther 2015; 22: 789–797.
- 33.
Pierce DS, Rosero EB, Modrall JG, Adams-Huet B, Valentine RJ, Clagett GP, et al. Open-cell versus closed-cell stent design differences in blood flow velocities after carotid stenting. J Vasc Surg 2009; 49: 602–606.
- 34.
Sahin M, Acar G, Ozkan B, Alici G, Yazicioglu MV, Bulut M, et al. Comparison of short-term outcomes after carotid artery stenting according to different stent designs. Postep W Kardiol Interwencyjnej 2013; 9: 121–125.
- 35.
Daou B, Chalouhi N, Starke RM, Dalyai R, Polifka A, Sarkar K, et al. Predictors of restenosis after carotid artery stenting in 241 cases. J Neurointerv Surg 2016; 8: 677–679.
- 36.
Groschel K, Riecker A, Schulz JB, Ernemann U, Kastrup A. Systematic review of early recurrent stenosis after carotid angioplasty and stenting. Stroke 2005; 36: 367–373.
- 37.
Wasser K, Schnaudigel S, Wohlfahrt J, Psychogios MN, Schramm P, Knauth M, et al. Clinical impact and predictors of carotid artery in-stent restenosis. J Neurol 2012; 259: 1896–1902.
- 38.
North-American Symptomatic Carotid Endarterectomy Trial. Methods, patient characteristics, and progress. Stroke 1991; 22: 711–720.
- 39.
Ding ZR, Wang KQ, Li J, Cong XS. Flow field and oscillatory shear stress in a tuning-fork-shaped model of the average human carotid bifurcation. J Biomech 2001; 34: 1555–1562.
- 40.
Thomas JB, Antiga L, Che SL, Milner JS, Steinman DAH, Spence JD, et al. Variation in the carotid bifurcation geometry of young versus older adults: Implications for geometric risk of atherosclerosis. Stroke 2005; 36: 2450–2456.
- 41.
Ku DN. Blood flow in arteries. Annu Rev Fluid Mech 1997; 29: 399–434.
- 42.
Gabb GM, Mangoni A, Anderson CS, Cowley D, Dowden JS, Golledge J, et al. Guideline for the diagnosis and management of hypertension in adults-2016. Med J Aust 2016; 205: 85–87.
- 43.
Stone PH, Coskun AU, Kinlay S, Clark ME, Sonka M, Wahle A, et al. Effect of endothelial shear stress on the progression of coronary artery disease, vascular remodeling, and in-stent restenosis in humans: In vivo 6-month follow-up study. Circulation 2003; 108: 438–444.
- 44.
Ren Y, Chen GZ, Liu Z, Cai Y, Lu GM, Li ZY. Reproducibility of image-based computational models of intracranial aneurysm: A comparison between 3D rotational angiography, CT angiography and MR angiography. Biomed Eng Online 2016; 15: 50.
- 45.
Saho T, Onishi H. Evaluation of the impact of carotid artery bifurcation angle on hemodynamics by use of computational fluid dynamics: A simulation and volunteer study. Radiol Phys Technol 2016; 9: 1–9.
- 46.
Perktold K, Peter RO, Resch M, Langs G. Pulsatile non-Newtonian blood flow in three-dimensional carotid bifurcation models: A numerical study of flow phenomena under different bifurcation angles. J Biomed Eng 1991; 13: 507–515.
- 47.
Konishi T, Yamamoto T, Funayama N, Nishihara H, Hotta D. Relationship between left coronary artery bifurcation angle and restenosis after stenting of the proximal left anterior descending artery. Coron Artery Dis 2016; 27: 449–459.
- 48.
Huang X, Yin XP, Xu YJ, Jia XW, Li JH, Niu P, et al. Morphometric and hemodynamic analysis of atherosclerotic progression in human carotid artery bifurcations. Am J Physiol Circ Physiol 2016; 310: H639–H647.
